Sunday, July 12 2015
Here we go again. The markets are trading back and forth, with no clear direction. That is because there IS no direction, other than sideways. And, as we have said many times before, sideways or flat markets result from uncertainty amongst everyone in the market. The volatility you see in flat markets comes from the floor traders that can trade with up to $200 billion in a very short time period. Their time horizon is in minutes/hours, NOT days/months like us. The floor traders can trade long in the morning and short a few minutes/hours later, often more than one round-trip per day. The ignorant little "day traders" usually get whipsawed trying to trade in these types of markets.
The uncertainty in the recent past has been about "nothing". The market has been mainly focused on things going on in Greece, China, and the Fed. The events surrounding all of the above are all very important, but most likely have very little long-term ramifications for the USA.
Greece
There are really only two choices in the current Greek situation, and neither will greatly effect the USA. Why? Because, the GDP for Greece is less than that of most states in the USA and even less than some of our larger cities. Where Greece can affect the USA/Europe/the World is if it causes great pain in the Euro Zone. I don't see that happening; but, of course, it could.
China
After a stock market "bubble" of almost unbelievable growth (kind of like our 1990-2000 tech bubble), the China market fell over 25-35% in the last 3 months. About 85% of the stocks on the China stock exchange are owned by the "little guys", who have been coming in to the Chinese markets in record numbers (mostly on margin). Of course, that is a recipe for disaster. The Chinese gov't handled it this way - they made it against the law for big guys to trade for several months. Simple in a communist state, but not so here. Anyway, short-term this stopped the slide and their markets have even bounced back almost to their "pre-crash" levels (no harm really done outside of China).
The Fed
The Fed has been awfully quiet and timid about raising interest rates even just a little. Aunt Yellen, the STOCK MARKET HERO, is not going to do anything to upset our markets, so you can rest easy here (at least for 2015). Of course, the press will probably scream "Disaster" when the Fed first raises rates, even if only by 1/4 of 1%; but it should not get much attention from investors or cause any noticeable pain.
Here is where we stand now:
So there you have it... nothing out there now to upset our markets, but the big guys and the press can make a big issue out of any news (no mater how important or unimportant), and put the market on a new trend of their choosing (up or down).
In the graph below, you will see that the market dropped about 4% in the ten trading days between 6/8/15 and 7/7/15, and has bounced back some since then. The market movement in the next few days will depend on what happens in Greece, and then it will go on from there on the next wave of useless news.
But, we still need to know how to trade this market; and for that we will depend upon the MIPS signals.
Current MIPS Signals (MIPS Members only)
MIPS 1,2,34 Signals... http://www.mipstiming.com/current_signals
MIPS/Nitro Signals..... http://www.mipstiming.com/current_nitro_
Sunday, July 05 2015
In case you have not heard by now, the results today (Sunday) of the Greek vote for the Refurendum below ended with a large majority (61%) of the Greek citizens voting "NO" !!!
Refurendum:
1) YES, accept more austerity conditions laid out by the European lenders (higher
taxes, pension cuts, etc.) in exchange for extended credit, or
2) NO, reject the offer (and hopefully negotiate a better deal from its lenders).
Their socialist Prime Minister, Alexis Tsipras, strongly urged the Greek people to vote "NO"; thus (in his mind only) putting him in a better position to negotiate a better deal with his European creditors. Most likely, the outcome will be just the opposite.
Needless to say, the rest of the world thinks this "NO" vote could lead to a disaster for Greece [financial ruin, exit from the Euro (Grexit), etc.]. If all of this mess affects Greece only, the worldwide ramifications may not be too bad; but if this type of behavior spreads to the other PIIGS countries (Portugal, Italy, Ireland, and Spain), it could lead to a worldwide crisis and stock market crashes throughout the rest of the world.
To this end, the e-mini futures are down tonight (Dow -200; SP500 -25, Nasdaq -50).
And, the MIPS2, MIPS3, MIPS4, models are all "SHORT" as of the EOD on 6/29/2015 !
Thursday, July 02 2015
This is a re-visit of my blog of Mar 15, 2015
- see updated graph below !!!
- are we getting close to the end ?
- is Grexit going to be the final catalyst "IF" it defaults ?
- do we need to get out now ?
Wait for MIPS to tell us what to do (stay tuned) !!!
================================================
C O N F ID E N T I A L
From Paul D.
- this is simply my opinion / observation and it has nothing to do with our MIPS models...
Expect a market crash before August 2015 ???
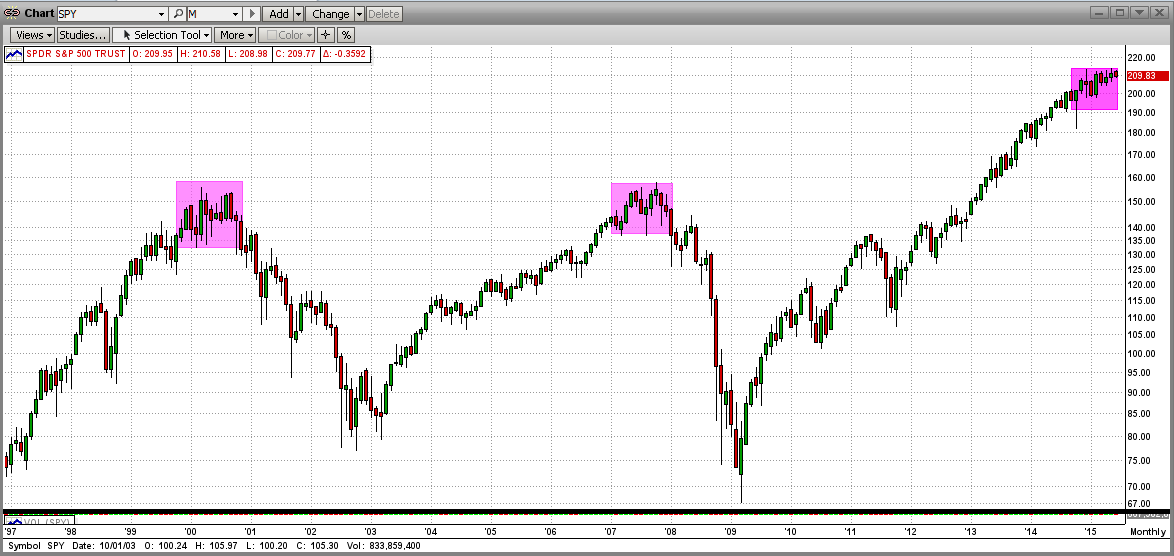
In the graph below, you will see that it took 11-12 months of sideways trading for the market (the SPY) to "top out" in both 1999-2000 and in 2007-2008.
My opinion is that this is roughly how long it takes for the big guys (Goldman Sachs, Morgan Stanley, UBS, etc) to liquidate the holdings that they want to dump at the top (call me and I will explain this). For example, it would take months for a big guy to sell 100 million shares each of GE and Walmart and Merck, etc without driving their prices through the floor. And, at the top, they hold 1,000's of positions just like that.
In the graph below, you can see that in 2014-2015 the market has basically traded sideways for 6 full months through Feb 2015, or 7 months counting March 2015 [it has been10 months now through June 2015; and the SPY is sitting on, or breaking through, the long-term trendline]. So, after 7 months in this sideways trading pattern, if the market stays in this relatively flat range for a few more months (highly likely), I believe that a Big Crash will come in July or August 2015 (most likely July 2015). If not, we could see the S&P 500 at 2500 or higher before the big crash finally comes. [New - The end of July 2015 will mark the 11th month this sideways market has been in effect. Previous crashes happened after "topping" for 11-12 months !!! ]
This definitely does not mean that the MIPS models see the market the same way that I do (thankfully), so let's be patient while the market makes up its mind and MIPS follows it. Stay tuned ... Updated on 7/01/2015

Wednesday, June 24 2015
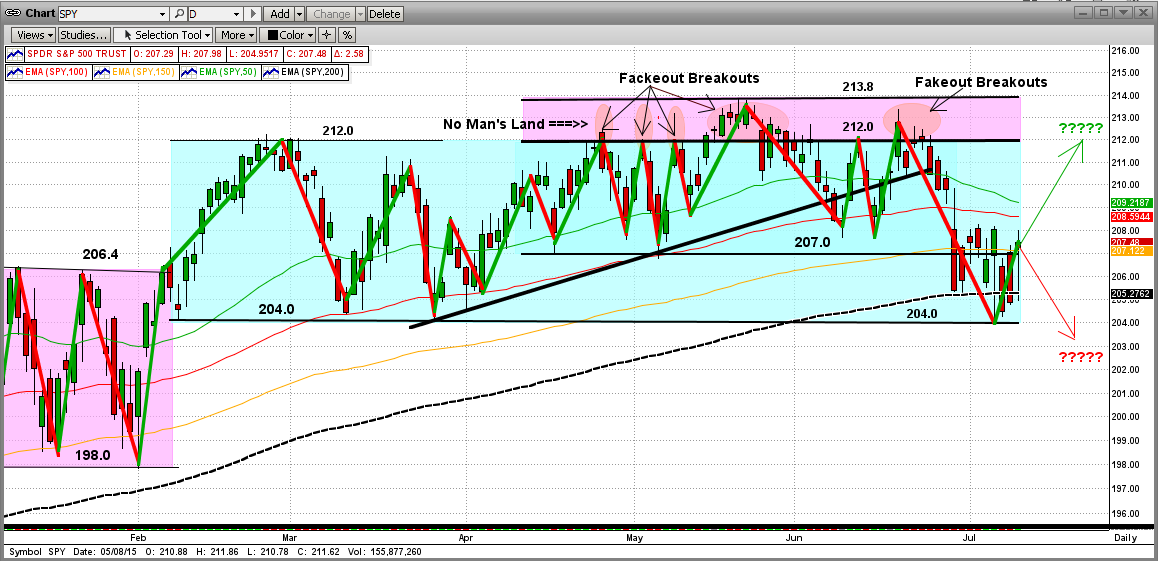
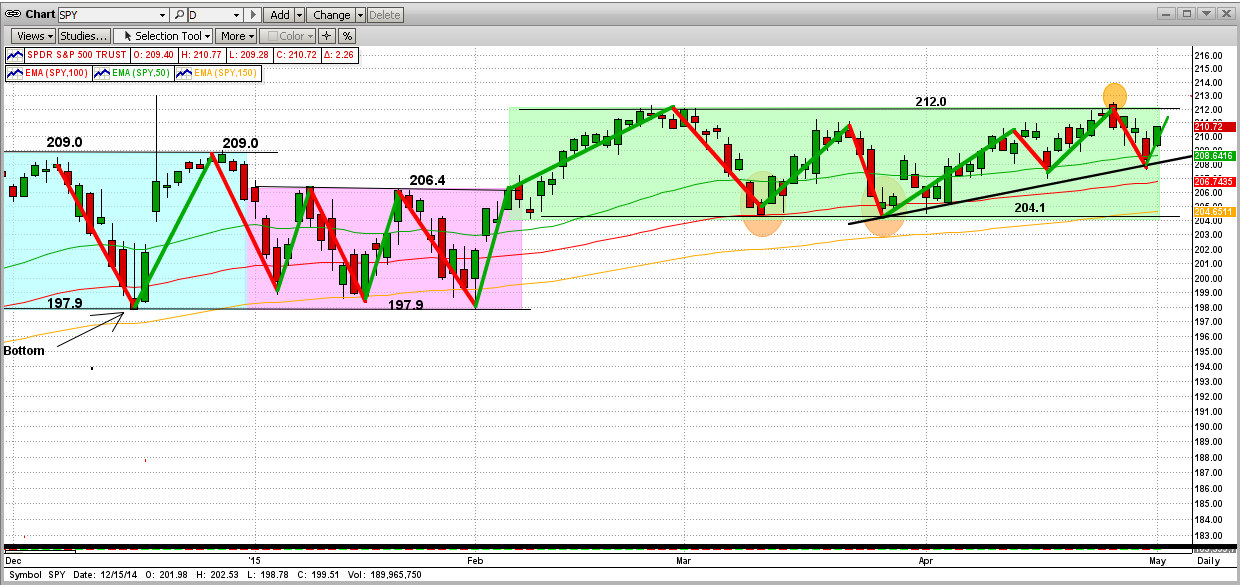
Since our previous blog (below), the "Market to Nowhere" has kept on going nowhere. The very tight trading range for the SPY in the last 6 months has changed its direction between 207.0 and 213.8 thirteen times, with no breakout above 213.8. That is a plus and minus change of only $3.4 around a mid-line of $210.4 (or 1.6%), which is not worth paying a lot of attention to from a pure performance standpoint. But, it does give a lot to think about.
As you can see in the graph immediately below, we again deemed the territory between the top two resistance levels ($212.0 and $213.8) as "No Man's Land". Every time in the 60 trading days that the Bulls have pushed the SPY into "No Man's Land" (pink area), it has gotten beaten back by the Bears. The only good news here is that this behavior cannot last forever, and is most likely coming to an end soon.
This rare kind of behavior shows extreme confusion and uncertainty as to which way this market will break out. Of course, since we cannot go sideways forever, there are only two ways the market can go, Up or Down. See our take on which way is the most likely under the graph.
UP or DOWN MARKET ???
In this market, there are compelling reasons as to why this market will continue up as in the last 6 years, but also some compelling reasons as to why it will turn down big-time. In short, the main reasons are:
Reasons for a Down Market Reasons for an Up Market
- Economy not doing well - The behavior of the Fed
- Potential higher interest rates - The behavior of the Fed
- Potential Greek default - The behavior of the Fed
- China economy slowing - The behavior of the Fed
- Oil price and energy profits - The behavior of the Fed
- Stocks overbought - No other place to invest outside of the stock market
- The market may be "topping" - Long-term, tight-range markets break up 70% of the time
- Will go where the big guys want it to - Will go where the big guys want it to go
See more about the last 2 reasons in both columns in our "previous blog" below.
Ok, I gotta say it... I think the SPY will break to the upside in the short-term, followed by a big crash in the next 4-6 months. But, as we all know, MIPS knows better than me (or you), so let's speculate as long as we want to (for fun), but follow the MIPS signals to manage our money (for gains).
And, we may not know why, but WE DO KNOW that the market will go the way the big guys want it to go. Even though the big guys don't like it, they leave a footprint when they are buying and/or selling, and MIPS knows how to track their action, and follow it.
Paul Distefano, PhD
MIPS Timing Systems, LLC
Houston, TX
281-251-MIPS(6477)
===============================================================
<<< Previous Blog >>>
MIPS Members:
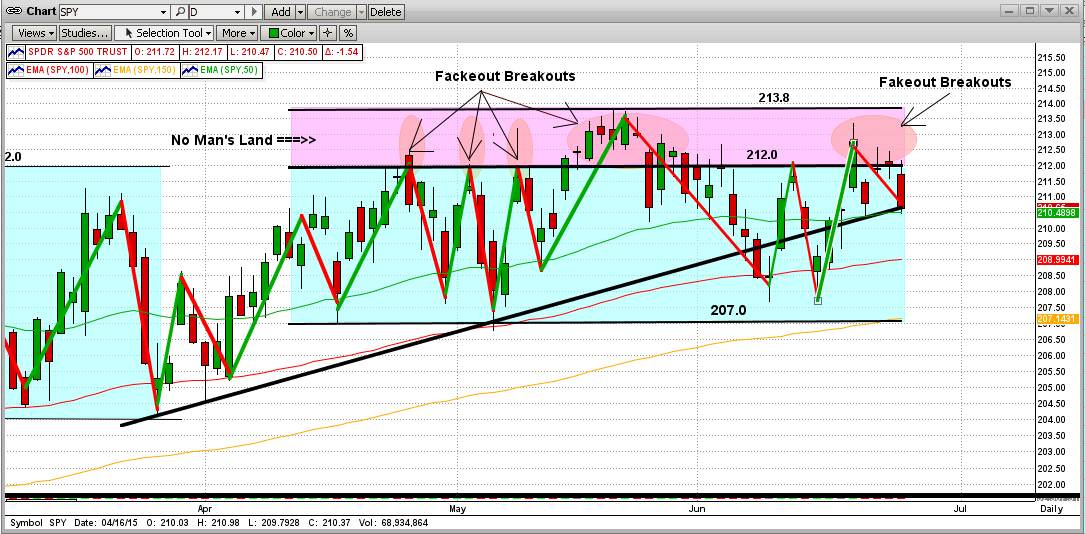
As you know by now, the market's "march to nowhere" continues. As said on CNBC, "The biggest story in the stock market this year has been, well, no story at all." And, according to technical analyst Jonathan Krinsky (MKM Partners), "The Dow hasn't done this in over 100 years."
What has the Dow not done in its history going back to the 1890's? The Dow has never traded in a narrow trading range of less than 6.2% for the first 6 months of any year. We are about 3 weeks short of that record time now, and the Dow's max top-to-bottom range has been about 6.2%. That's a plus-or-minus deviation of 3.1% around its mean-line in 6 months !!!
Yes, multiple trillions of dollars have been traded in this time frame with almost no real gains/losses in the indices. Needless to say, that shows a lot of uncertainty. See the graph for the SPY below (with a couple of "fakeout" breakouts).
No one has any idea where this market will go from here, and there are two good cases.
- you need to follow this market daily.
THE BULL's CASE
According to technical analyst Jonathan Krinsky, the Dow has traded in a narrow trading range of 10% (as opposed to 6% now) in the first 6 months of any given year 19 times since 1896. Of these 19 times, almost 70% or the time (13 out of 19), the market ended up higher for the remainder of the year. We have 3 weeks left to go in the 1st 6 months of this year. This market may still have steam, and the little guys could push it much higher with euphoric buying.
THE BEAR's CASE
There is a good chance that all of this "flatness" is NOT all about uncertainty, but is part of a "rollover" of this 6.5 year bull market into a full-fledged bear market. Of course, all rollovers are caused by the big guys selling at the top of a bull market (like now), or buying at the bottom of a bear market (like in 2009). At a top, the big guys sell the market down, and the little guys buy the dips right back up to the tops. A "topping" market takes the form of a "rollover" (instead of an immediate "reversal") because it takes the big guys at least 12 months to dump the major part of their portfolios; and then they let the little guys ride it down all the way to the bottom for the umpteenth time. SEE THE GRAPH IMMEDIATELY BELOW. If this indeed what is going on, we only have a few months left, so watch closely.
OUR ADVANTAGE
We can't "go this alone" and try to pick the time that this market is going to crash. We are not smart enough and we do not think fast enough to even come close. We are not going to out-think the mathematics that make up good models and go through even one thousandth of the conditions that the computer can analyze in milliseconds.
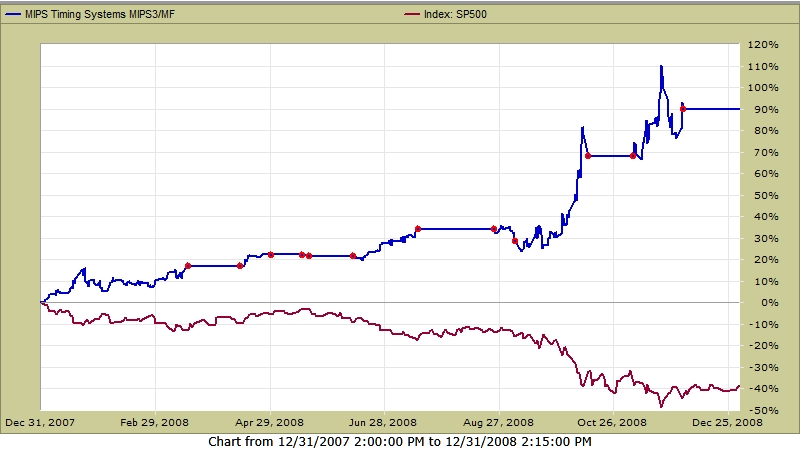
For example, study the graph below (from TimerTrac.com with verified signals) to see how MIPS3 actually traded the SPY in 2008. Who would you bet on: yourself, or MIPS, or some other model that you have not seen successfully handle a market crash? I know how I would answer that question. Stay tuned !!!
Monday, June 08 2015
As you know by now, the market's "march to nowhere" continues. As said on CNBC, "The biggest story in the stock market this year has been, well, no story at all." And, according to technical analyst Jonathan Krinsky (MKM Partners), "The Dow hasn't done this in over 100 years."
What has the Dow not done in its history going back to the 1890's? The Dow has never traded in a narrow trading range of less than 6.2% for the first 6 months of any year. We are about 3 weeks short of that record time now, and the Dow's max top-to-bottom range has been about 6.2%. That's a plus-or-minus deviation of 3.1% around its mean-line in 6 months !!!
Yes, multiple trillions of dollars have been traded in this time frame with almost no real gains/losses in the indices. Needless to say, that shows a lot of uncertainty. See the graph for the SPY below (with a couple of "fakeout" breakouts).
No one has any idea where this market will go from here, and there are two good cases.
- you need to follow this market daily.
THE BULL's CASE
According to technical analyst Jonathan Krinsky, the Dow has traded in a narrow trading range of 10% (as opposed to 6% now) in the first 6 months of any given year 19 times since 1896. Of these 19 times, almost 70% or the time (13 out of 19), the market ended up higher for the remainder of the year. We have 3 weeks left to go in the 1st 6 months of this year. This market may still have steam, and the little guys could push it much higher with euphoric buying.
THE BEAR's CASE
There is a good chance that all of this "flatness" is NOT all about uncertainty, but is part of a "rollover" of this 6.5 year bull market into a full-fledged bear market. Of course, all rollovers are caused by the big guys selling at the top of a bull market (like now), or buying at the bottom of a bear market (like in 2009). At a top, the big guys sell the market down, and the little guys buy the dips right back up to the tops. A "topping" market takes the form of a "rollover" (instead of an immediate "reversal") because it takes the big guys at least 12 months to dump the major part of their portfolios; and then they let the little guys ride it down all the way to the bottom for the umpteenth time. SEE THE GRAPH IMMEDIATELY BELOW. If this indeed what is going on, we only have a few months left, so watch closely.
OUR ADVANTAGE
We can't "go this alone" and try to pick the time that this market is going to crash. We are not smart enough and we do not think fast enough to even come close. We are not going to out-think the mathematics that make up good models and go through even one thousandth of the conditions that the computer can analyze in milliseconds.
For example, study the graph below (from TimerTrac.com with verified signals) to see how MIPS3 actually traded the SPY in 2008. Who would you bet on: yourself, or MIPS, or some other model that you have not seen successfully handle a market crash? I know how I would answer that question. Stay tuned !!!
Thursday, May 14 2015
After 3 failed attempts in the last 15 days, the SPY finally broke up above its very strong resistance level and closed on a new high at 212.2 (and 2121 on the S&P500). While we are pleased that the S&P 500 made a new high, and the breakout was on a big rise today following an "up-gap" from yesterday, the volume was relatively low for a breakout (just a little negative, but very bullish overall).
The market movement seems to have transitioned from a sideways market to a "rising wedge" pattern, which usually breaks out following the trend that got it there in the first place (up, in this case). So far it has, and all is good. However, as we all know, the Bears are most likely NOT going to give up easily (they have a ton of short positions to "protect", so they may be selling big-time). On the other hand, if the Bears decide to "cover" their outstanding shorts, that would be VERY bullish. So, although things look bullish, this market can go either way from here. We can watch the price movements and chart patterns as they happen, but we can't analyze these volume-weighted movements anywhere close to how intricately MIPS does. For that reason (and many more), let's rely on MIPS to help us navigate our portfolio in these uncertain times.
Stay tuned...
===========================================================================
<<< Previous Blog >>>
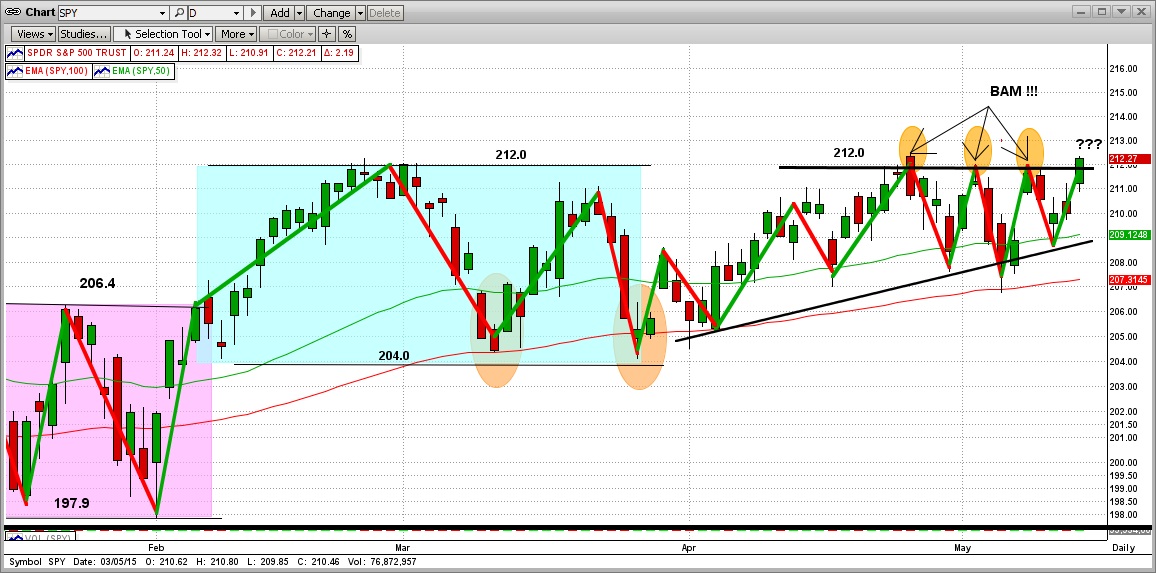
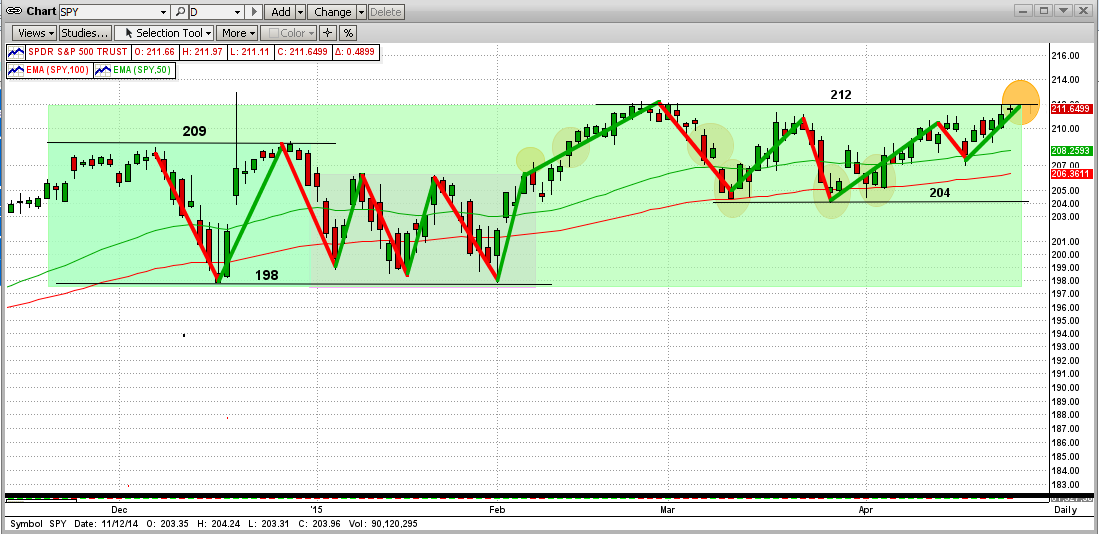
Needless to say, in the last few days the market has not performed well. In fact, some emails that we have received are borderline "panic". So, how bad is the market now and where are we headed?
If we look at a daily chart, as usual it looks like the market is coming apart (see the 1st graph below). From this viewpoint, we can see very clearly that the SPY hit the Bear's front-line resistance at 212.0 twice in five days, and got slammed back both times ("Bam"). Even though the market has been flat for over 5 months, the daily action has been very volatile. So, even though it is very obvious that the short-term trend is "flat", it is difficult to see where the intermediate-term is going.
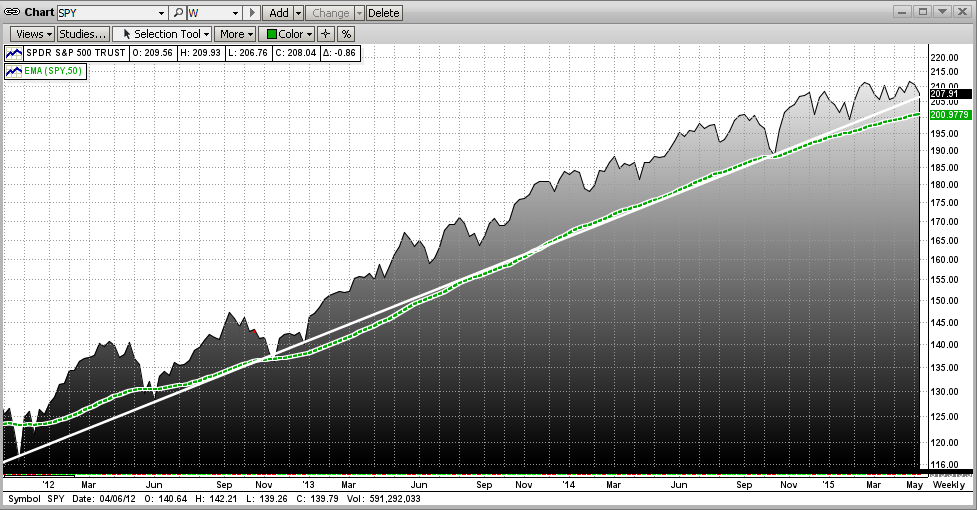
Like most other things in life, if we want to see the "big picture" we need to step back and look at the situation from afar. In this case, let's turn to a graph with weekly data instead of daily data (kind of smooths out the crazy ups-and-downs of everyday activities, as the "floor trades" sell one day and buy back the next.
The next graph shows the rare, "near perfect" 3-year trend from January 2012 through today (5/06/2015). [The trend line is white and the 50-week EMA is green.] As you can see, the SPY hit (or dropped back close to), its trend line (or EMA line) 7-8 times, but the trend line proved to be excellent resistance as the SPY bounced back up every time. As you can see, we are there again today.
Lots of smallish short-term "traders" (if we can call them that) got whipsawed mercilessly in this "froth" above the trendline, a place where the big floor traders live. Little guys trying to navigate that territory usually get killed. And, what for? Why take the risk of trading against the big guys IN THEIR OWN EXCLUSIVE TERRITORY when you can experience good returns following the trend. Greed, maybe?
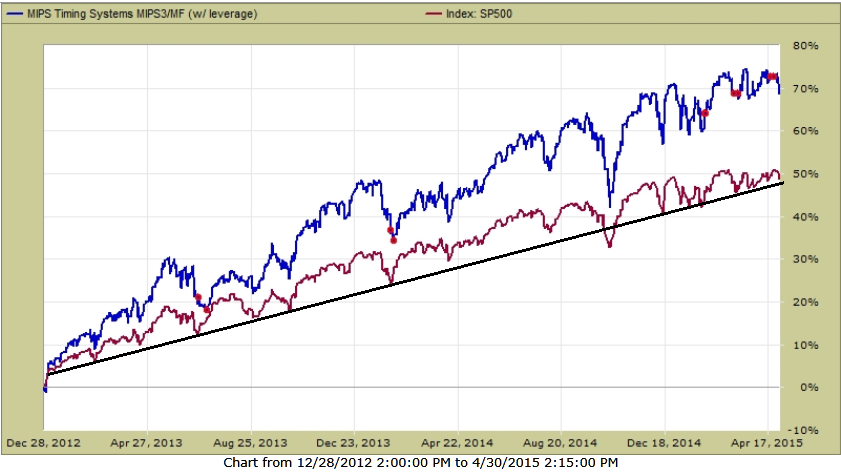
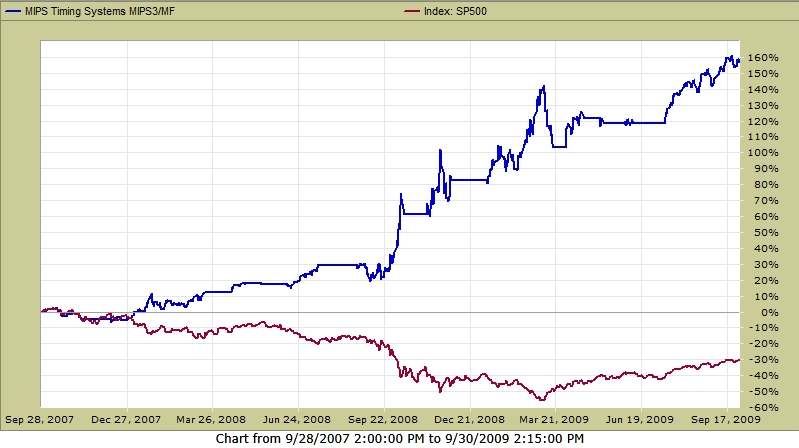
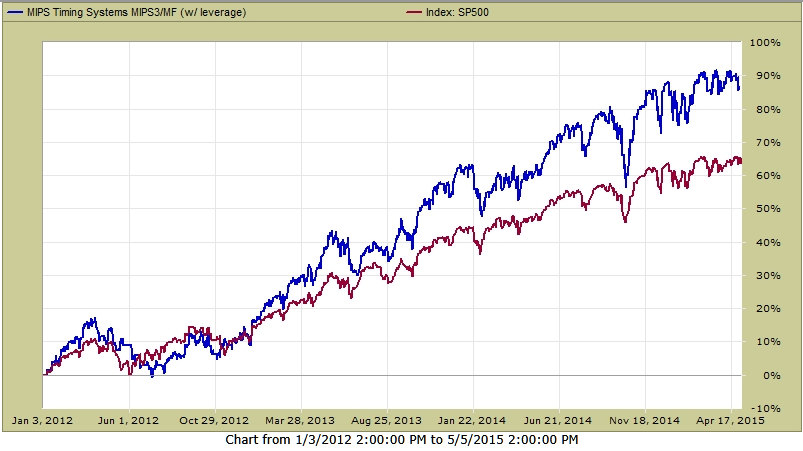
We just said the you could make good money following the trend instead of jumping into the froth above the trendline and getting killed. OK, so how did MIPS do in this time period? For that, we refer to TimerTrac.com, where MIPS3 has been "verified" since late 2005 (MIPS4 would have done better, but it was not introduced until 1Q'13).
As you can see below, MIPS3 trading 1.5x leverage SPY ended up +87%, while the SPY was up +64%.
- Just in case you don't know, if you did that well for the next 21 years, your portfolio then would be
about 80 times the value of what you have now (e.g., $50,000 would be about $4,000,000) !!!
- Still want to "play the froth" and lose your butt, or can you be patient and possibly get rich ?
Stay tuned and follow MIPS !!!
Thursday, May 07 2015
Needless to say, in the last few days the market has not performed well. In fact, some emails that we have received are borderline "panic". So, how bad is the market now and where are we headed?
If we look at a daily chart, as usual it looks like the market is coming apart (see the 1st graph below). From this viewpoint, we can see very clearly that the SPY hit the Bear's front-line resistance at 212.0 twice in five days, and got slammed back both times ("Bam"). Even though the market has been flat for over 5 months, the daily action has been very volatile. So, even though it is very obvious that the short-term trend is "flat", it is difficult to see where the intermediate-term is going.
Like most other things in life, if we want to see the "big picture" we need to step back and look at the situation from afar. In this case, let's turn to a graph with weekly data instead of daily data (kind of smooths out the crazy ups-and-downs of everyday activities, as the "floor traders" sell one day and buy back the next.
The next graph shows the rare, "near perfect" 3-year trend from January 2012 through today (5/06/2015). [The trendline is white and the 50-week EMA is green.] As you can see, the SPY hit (or dropped back close to), its trendline (or EMA line) 7-8 times, but the trendline proved to be excellent resistance as the SPY bounced back up every time. As you can see, we are there again today.
Lots of smallish short-term "traders" (if we can call them that) got whipsawed mercilessly in this "froth" above the trendline, a place where the big floor traders live. Little guys trying to navigate that territory usually get killed. And, what for? Why take the risk of trading against the big guys IN THEIR OWN EXCLUSIVE TERRITORY when you can experience good returns following the trend. Greed, maybe?
We just said the you could make good money following the trend instead of jumping into the froth above the trendline and getting killed. OK, so how did MIPS do in this time period? For that, we refer to TimerTrac.com, where MIPS3 has been "verified" since late 2005 (MIPS4 would have done better, but it was not introduced until 1Q'13).
As you can see below, MIPS3 trading 1.5x leverage SPY ended up +87%, while the SPY was up +64%.
- Just in case you don't know, if you did that well for the next 21 years, your portfolio then would be
about 80 times the value of what you have now (e.g., $50,000 would be about $4,000,000) !!!
- Still want to "play the froth" and lose your butt, or can you be patient and possibly get rich ?
Stay tuned and follow MIPS !!!
Sunday, May 03 2015
Most investors are sick and tired of hearing about the market "moving sideways" for the last 5 months !!! And by now, no one seems to care why. They have totally accepted that the real reason for this is "universal uncertainty" in all markets. No point in beating that drum anymore.
But, the question remains.... "Where do we go from here" ?
We believe that the market will break to the upside from here as in the graph immediately below.
Our rationale is that:
1) the market made a big reversal on Friday, following Apple's earnings and Yellen's dovish speech,
2) the market seems to have formed a new uptrend within the sideways pattern (black line), and
3) at 210.7, the SPY is about 1/2 of 1% from its all-time high.
Opposite View:
Of course, with the market as fragile as it is now, almost ANY bad news (earnings, Greece, China, etc.), could upset expected up movements, and the SPY could very easily head in the opposite direction of that shown above. Remember, the Bear's "front-line" at 212.0 has provided very strong "resistance level" to any movements above that. And, the Bears are not going to give up without a fight (as they have proven for the last 5+ months).
It's interesting to study the market and attempt to forecast what might happen in the near future. But, these types of forecasts are usually not very accurate. That is why investors need a strong, analytic model like MIPS to dig deep into the roots of what is happening and provide them with a quantitative judgement of the market direction.
So, let's wait for MIPS to tell us what to do next !!!
Sunday, April 26 2015
As most of you know, this market has been "flat" and going nowhere for over 5 months now (see our previous blog and the updated graph immediately below).
We all know that a market that stays flat for 5 MONTHS is really "long-in-the-tooth". Flat markets simply DO NOT last much longer than this. Why? Because $ trillions have changed hands (aka "traded") and the market has changed less than 3% !!!
Usually, in these types of flat markets:
1) the market breaks out in the same direction that it came in,
2) the longer the market stays sideways, the bigger the breakout.
Since these types of markets result from universal uncertainty, a major "catalyst" is necessary to inspire one side or the other to move with force (and then, the other side simply gives up and joins the newly formed trend). From where we are today, I see Apple as that catalyst. After the close on Monday, Apple will announce their earnings and offer their guidance for the near-term future. So, Tuesday could be a BIG day for the US markets. But, the large/institutional investors that know what Apple is going to say could also influence the market in Monday's trading.
Remember, above $212 on the SPY is "new high" territory !!!
I personally believe that we will break to the updside. This is just my opinion, not that of MIPS. We can believe what we want, but let's wait for MIPS to tell us what to do going forward. Stay tuned...
===========================================================================
<<< Previous Blog >>>
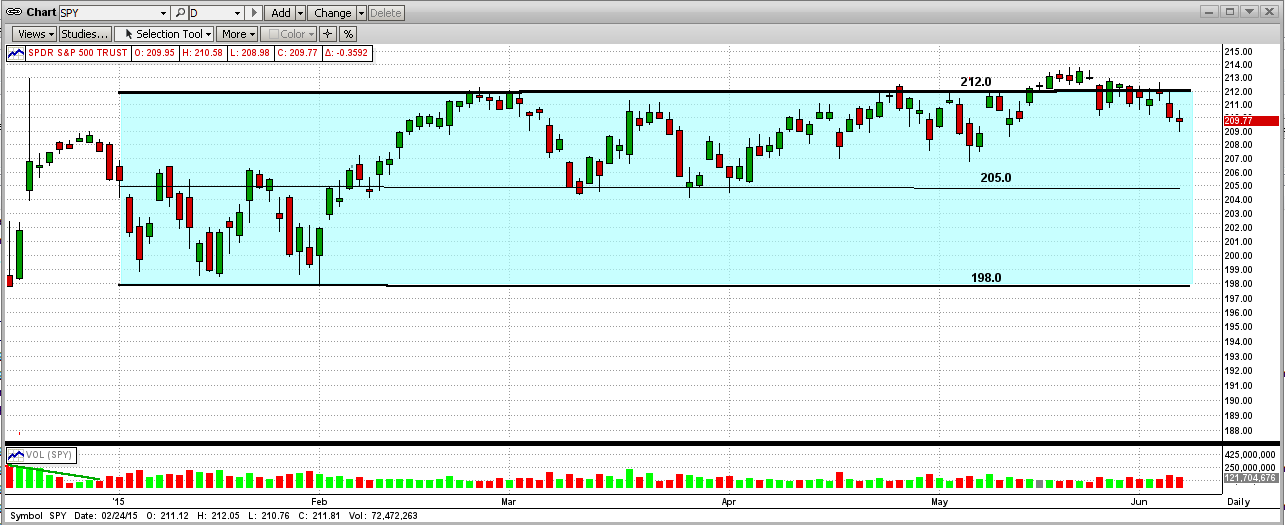
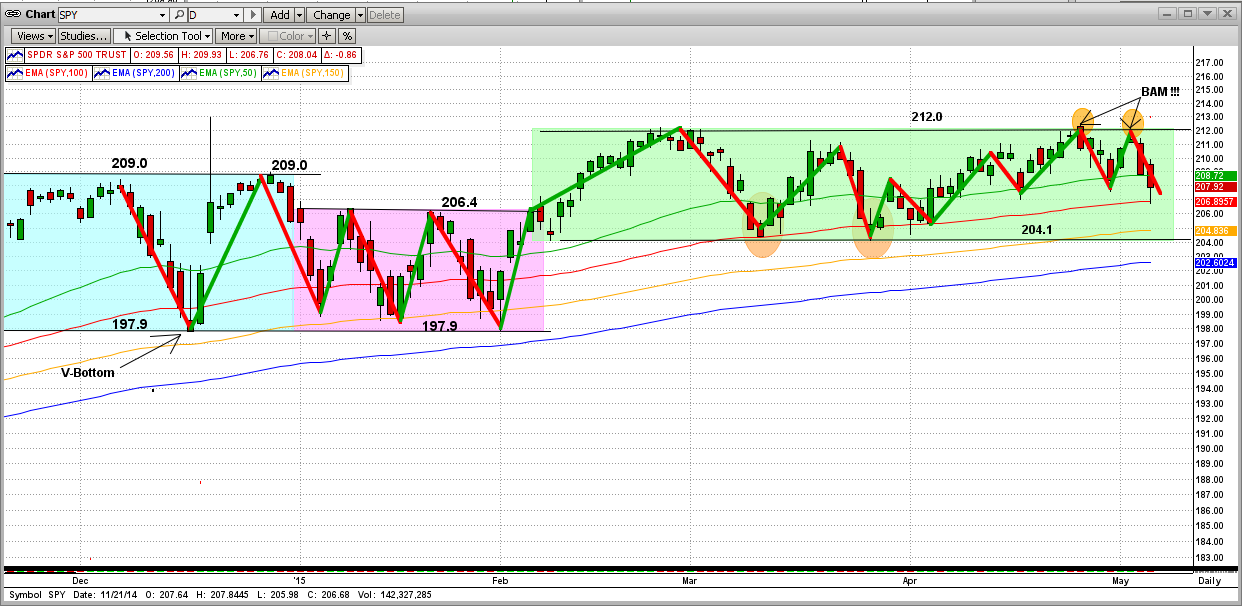
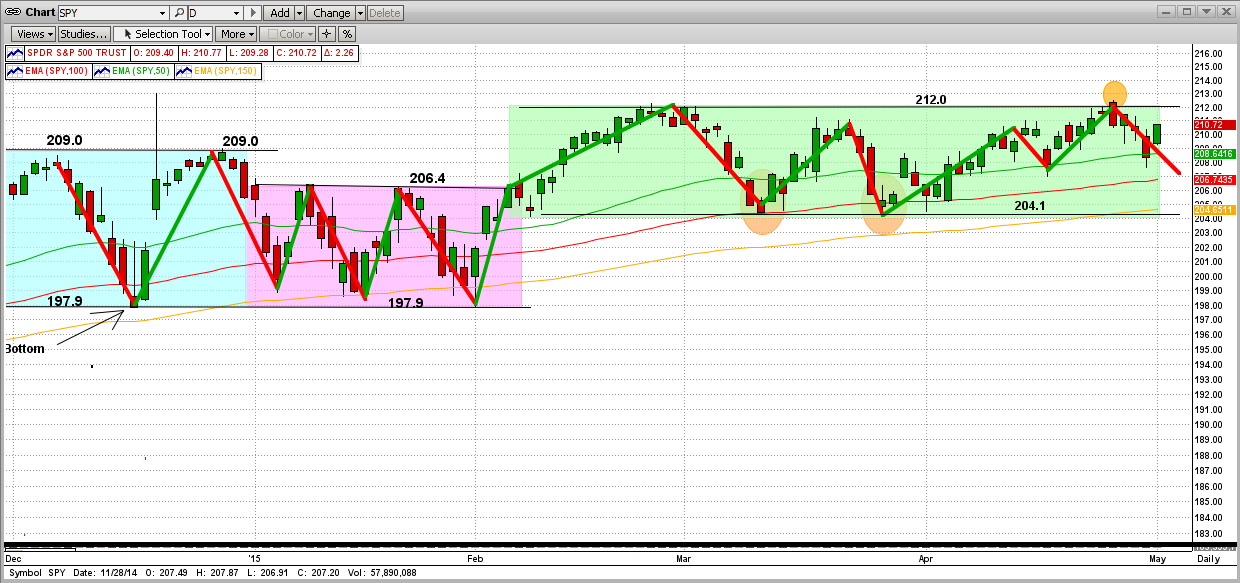
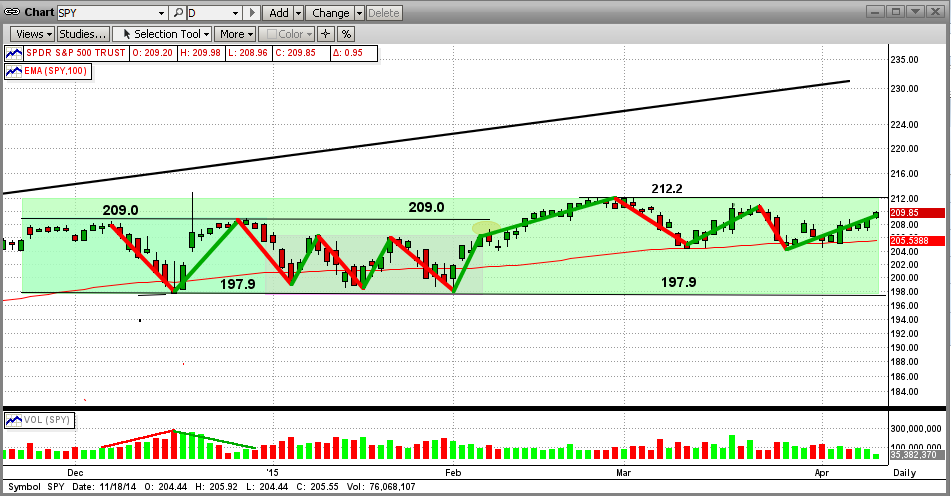
Talk about "A Market Going Nowhere, Fast" - you have just witnessed one. For the last FIVE MONTHS, the SPY has traded in a rather tight trading range of plus-and-minus 3.5% around the mid-line of a price range between 197.9 and 212.2 (see graph below). And, the SPY has experienced 12 short-term trend changes in this time period (if you can call them that). Even more remarkable is that, with all of these "wild" changes, the SPY on 3/31/15 was only 0.43% higher than it was on 12/31/14.
This has been a VERY volatile market. For example, the Dow experienced 16 days of triple-digit moves in March alone (that's 16 triple-digit days out of 22 trading days, or 73% of the days). These 16 triple-digit days accounted for 3,149 "swing" points for the Dow, and yet it closed less than 2% higher for the month.
The stock market continually experiences flat or sideways markets (aka "consolidation patterns"), but they rarely last 5 months. This one is long in the tooth. The stats show that: (a) most of the time the market breaks out of the pattern in the direction from which it came in (up in our case) and (b) the longer the time frame of the sideways pattern, the bigger the following breakout move is.
Obviously, this market has no short-term trend or direction now (other than flat-as-a-pancake), but the long-term trend is still up. The next few days are vital. In order for the bulls to keep running, the SPY must break above the strong resistance at 212.2 (its all-time high) with some degree of strength. If that does not happen in a relatively short period of time, the bears may get rejuvenated and may finally push this market down big, at least a "correction" if not the "big one".
One positive aspect of a long-term sideways pattern is that MIPS usually gets set to "trigger" faster after being "flat" for over 100 days (think of what that does to 20-50-100 day EMAs). Because of moves like this (of lack thereof), a small change can look big to MIPS after months of plus-and-minus 3%.
Until further notice, we are still bullish, mainly because the long-term trend is still up. No matter what, we will be waiting for the MIPS models to provide our future guidance (as usual). Stay tuned...
|