site map
my account
contact
our facebook page
Latest Posts
Archive

+
...

Market Timing

Saturday, December 27 2014

This blog attempts to explain why you see "wild price action" when MIPS doesn't. The explanation below is indicative of a lot of the math in MIPS, except for the algorithms we use to "speed things up" (trade faster) when required.

First off, this is because MIPS looks at "wild price action" in a slightly different way than we do. We look at daily market movements, caused mainly by NYSE floor traders who change their minds within minutes, hours, or just a few days after making huge trades. MIPS knows this from their "volume weighted data" trades. Since these floor traders create the "wild price action" on daily charts (and they can change direction on a dime), the MIPS models mimimize their short-term, wild price action in strong up or down markets (but, not so in slow-moving or flat markets). Needless to say, from a "technical analysis" standpoint, MIPS closely monitors price action and the "patterns" it they creates.

You don't need a MIPS model to show you this, you can see the "wild price action" disappear if you have the discipline and patience to look for it on weekly and monthly charts and wait until new trends develop. This is not what MIPS does, but it is a good example of looking deeper (certainly not recommended for actual trading signals).

DAILY
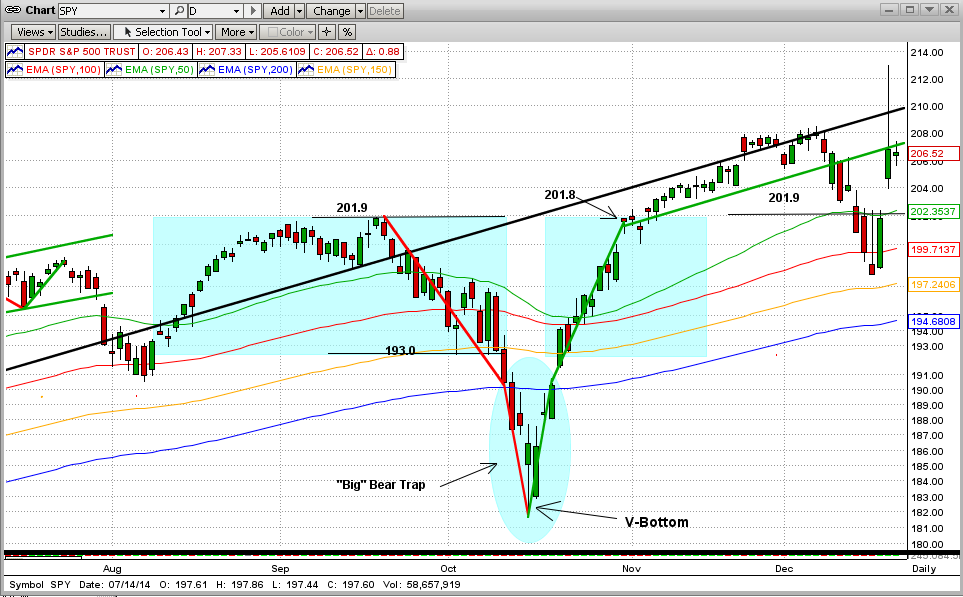
The "wild price action" below is what you see in the daily charts... looks terrible and "all over the map" (NO consistency). There is seemingly no trend at all, but you are being "fooled".
WEEKLY
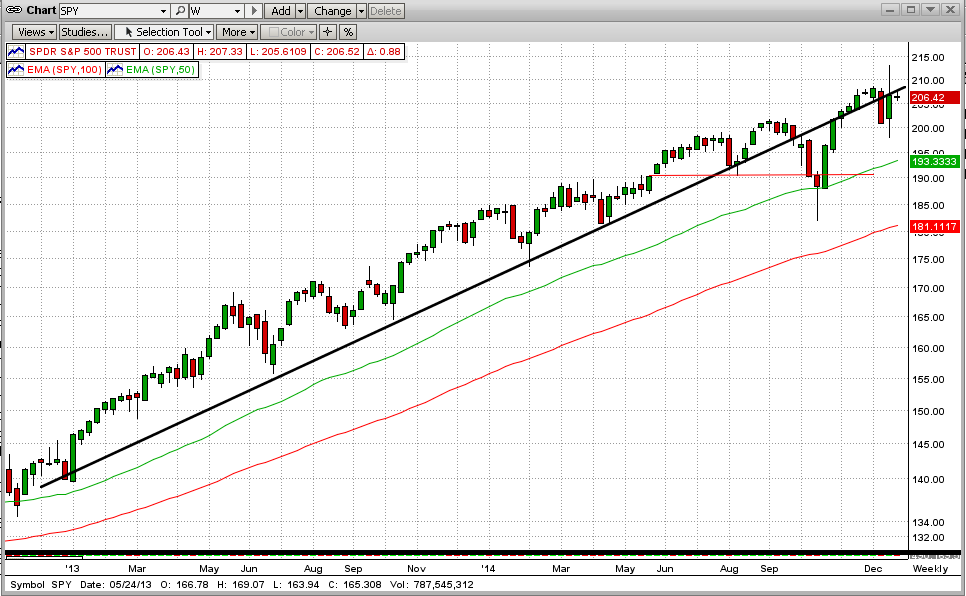
If we just step back a little and look at this price action from more of an intermediate-term view, things look completely different. In fact, we can then see actual trends, etc. without being fooled by the wild movements caused by the floor traders that have nothing to do with us or the way we invest. Some Nervous Nelly, sick from wild daily movements, who at least had checked the weekly daily price action would have seen only one period of serious deviation, and it did not last long (only one "break" in the dominant trend). And, if that trend could have quickly been identified as a "V-Bottom", anyone in their right mind would have avoided trading it (like us).

MONTHLY
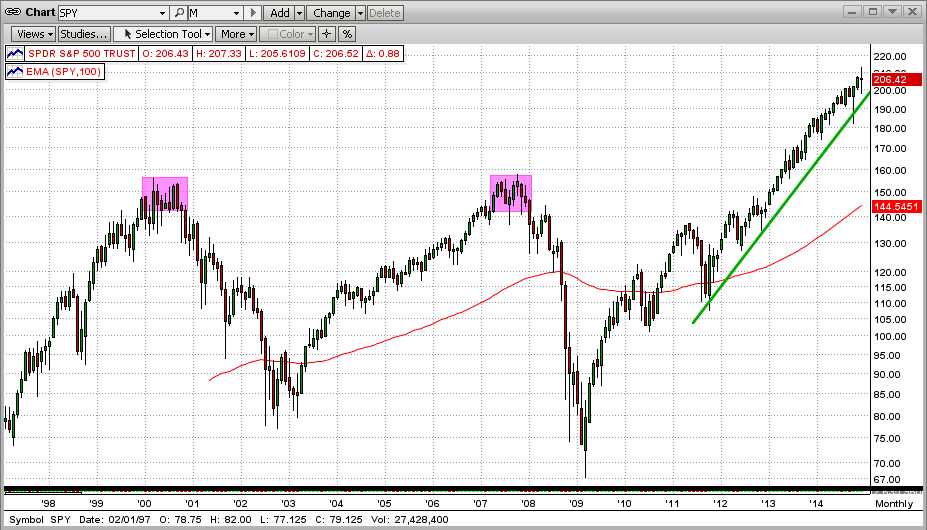
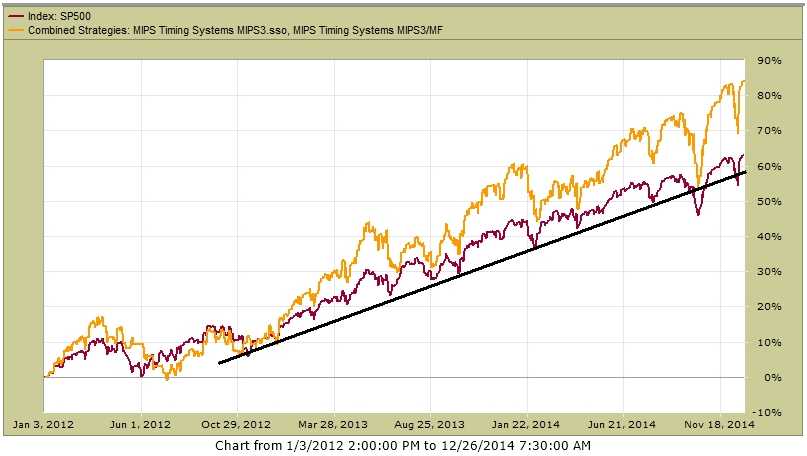
Although MIPS follows primarily intermediate-term trends with hundreds of indicators and proprietary algorithms, we get our quick "peace of mind" by checking the long-term monthly charts. At this time, we can still see a strong (yes, still a strong), almost perfect trendline going all the way back to 2012 without even a "hint" of a new downtrend coming (that is, no new "inflection point"). Of course, this can change at any time, so we WOULD NOT use monthly data to help us decide when a trend is changing (but more to decide when it is not changing).

In reality, we use much faster-moving algorithms to calculate our "Inflection Points". Any investor who cannot sleep well with a trend like the one below that we are following now (and with models like MIPS) needs to either (a) turn their trading decisions over to others (advisors, etc.), or (2) buy-and-hold, or (3) quit investing in equities.
NET BOTTOM LINE
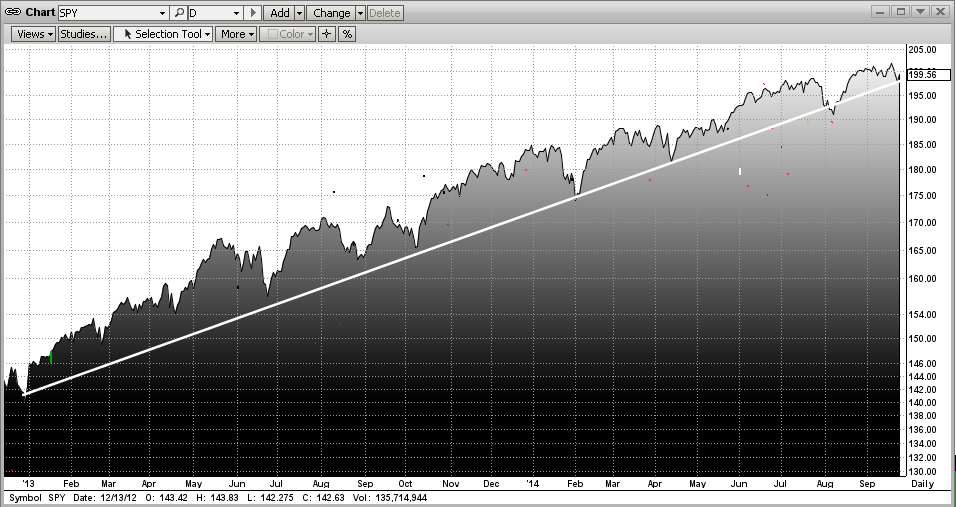
The MIPS models are more likely to simply "follow" a strong trend as in the graph below (higher highs, higher lows) than to attempt to trade the cycles above the trendline, and get whipsawed. Of course, MIPS doe not simply "follow the trend", but this example is "directionally" correct.
HOW DID MIPS DO IN THIS STRONG UPTREND ?
MIPS was able to avoid getting whipsawed in the recent turbulence due to algorithms that we have built into the models that act differently during strong trends (more tolerant) than they do in weak or flat markets (move quickly).

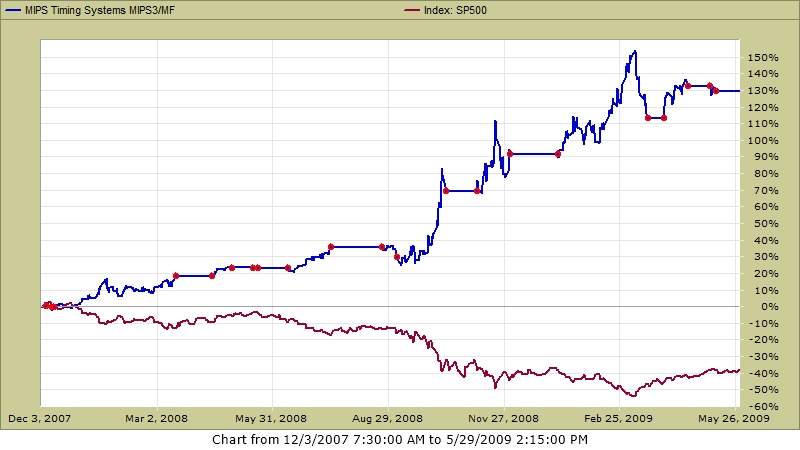
During the last three years, MIPS3 and MIPS4 were up about 85% (hard to beat that). But, one might say, there are other models that have stayed long and produced decent gains, right? True, but many of these other models almost always stay long, and trade very infrequently. So, to be sure, one MUST find out how these other models perform in down markets and in actual market crashes? See the 2nd graph below to see how MIPS did in 2008 (MIPS up 135%; SPY down 40%).
MIPS IN DOWN MARKETS (2008)

MIPS in 2008 (red dots show trades) MIPS +130% SPY -40%
HIGHER FREQUENCY TRADING

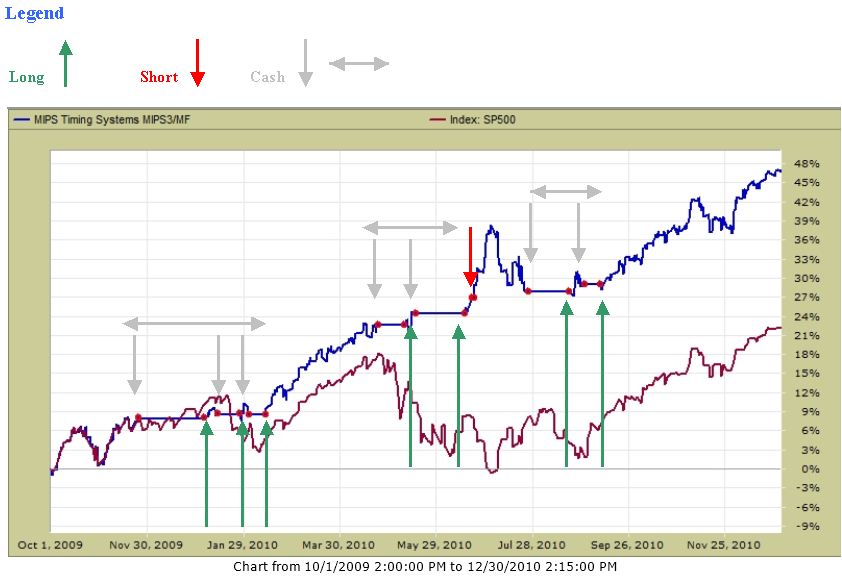
When we have a very solid trend and MIPS does not trade very often (like now), our members start to ask "Does MIPS ever trade more often (faster)? Of course, the answer is YES, as can be seen above in 2008 and below in 2010. Without a constant long-term trend, MIPS will do what it does best... namely, trade faster to successfully follow the intermediate-term trends as it did in 2010. No MIPS models has ever issued more than 25 trade signals in any year.

MIPS in 2010
- Red dots show the 17 trades in 2010
Posted by: Dr. G. Paul Distefano AT 06:00 pm   |  Permalink   |  Email
Saturday, December 13 2014

Last week the SPY broke two important support levels, one being its "first" new high of 201.9 from weeks ago and the other being its 50-day EMA (immediately below).  In and of itself, this is NOT a big deal (2nd graph below).


The "damage" above looks scary on a daily chart, but the weekly chart below shows that the action on the daily chart is just "noise" created by the traders on the floor of the NYSE (Ebola one day, Ukraine the next, Fed intentions after that, etc).  Nothing sustainable... 

Observing the chart below, one would simply ignore any fear of a big correction or bear market soon, and maybe rightly so. After all, bull markets can go on for YEARS after the market is oversold and getting worse (like in the 1990's). Maybe that is where we are today.


Bear Markets
Most bull markets that turn into bear markets need a "Catalyst" to get the fat kats to sell the shares that have made them richer (and when they do start selling, its all over).  BTW, the fat kats (or big guys) in this blog are the big institutional investors, like Goldman Sachs, Morgan Stanley, UBS, Credit Suisse, etc).  Basically the fat kats will ride the bull for years.  In fact, as long as the little guys are feeding the bull (buying), the fat kats stay invested, riding the bull until it drops dead.  But, of course, NONE of the fat kats want to be long after the bull dies and the bear moves in.  Since no one really knows that day, and since the fat kats have their finger on the sell button now, any BIG NEGATIVE ISSUE that can last for years may push the fat kats to the sidelines fast and we all know what that leads to.

Right now, we may be sitting on the edge of that type of phenomenon with oil prices dropping like a rock (see graph below). Energy is one of the biggest industries in the world.  As the price of oil goes, so goes some countries' entire gross national product.  Oil prices have taken a 40% dive in the last six months (from $100 a barrel in May to under $60 today)!!!   And, economies all over the world are weakening (Europe, China, etc.), which will result in less worldwide demand for crude oil.  Those issues may be enough to keep oil prices low for a long time, and disrupt stock markets all over the world (as it did in the early 1970's, when the Dow tumbled 50%). 

Are we there now?  It's certainly possible, but not guaranteed. However, the risk is there and real. 

We will have to wait for MIPS to tell us what to do.

Posted by: Dr. G. Paul Distefano AT 11:06 pm   |  Permalink   |  Email
Thursday, December 11 2014

The S&P500 (SPY) did something this week that it rarely does... it did what I thought it would do. That is, it has gone into the process of re-testing its all-time high that it made on 11/03/2014. This original SPY "break-out" was at 201.9 and the market started a new uptrend rally all the way up to 208.3 on 12/05/2014.

After significant breakouts, the market will usually go back to re-test the breakout point.  We believe that this reversal process began on 12/06/2014 and the SPY has headed down over the last few days, closing today at 203.5.  Don't worry (yet) folks, this is the "norm", not an exception.

In the graph below, we can see that the "new-high" resistance level at 201.9 is about to coincide with the 50-day EMA (green line).  Breaking this level to the downside could spell "double trouble". After that, the next resistance level is the 100-day EMA (red line at 199.3).  It would not be good for the SPY to drop below that, but that by itself would not necessarily mean disaster (but it could be the start). Stay tuned!

On the other hand, if the SPY holds above the 201.9 level, we can expect a new uptrend to even higher levels than 208. This is where I would but my bet, if I were betting.  But, I'm not betting or sweating; I am depending upon MIPS!!!

Posted by: Dr. G. Paul Distefano AT 09:32 pm   |  Permalink   |  Email
Saturday, December 06 2014

I know a lot of you are saying, "OK, MIPS4 has a good long-term performance record, but what about its more recent performance?"  Our previous blog (earlier today) showed the great performance of MIPS4 trading 1/2 each of SPY/SH and SSO/SH in the last 8 years (III below).  So, how did MIPS4 do with this same trading profile in the last 12 months?   See the graph below from the tracking company, TimerTrac.com.

MIPS4/MF's performance trading 1/2 SPY/SH and 1/2 SSO/SH for last 12 months from from Dec 5, 2013

 SPY  +16.3%      MIPS4  +19.3%


Posted by: Dr. G. Paul Distefano AT 10:50 pm   |  Permalink   |  Email
Saturday, December 06 2014

As most MIPS members already know, we show several possible trading profiles for our MIPS models under the "Services" tab on our main menu at www.mipstiming.com (and more under the "Trading Profiles" button on the Services page).  With the MIPS models, you can trade any ETF that "correlates" well with the SPY:
(from Investopedia  =>  http://www.investopedia.com/terms/c/correlation.asp ). 

We like trading with various "mixes" of SPY and SSO on long signals, and
SH on short signals (no leverage on shorts).

For aggressive investors, we recommend trading the following "mix" of SP500 ETFs:
    (a) 50% of your MIPS money trading SPY and the other 50% trading SSO on long signals and
    (b) 100% trading the "inverse" SPY (SH) on short signals (i.e., no double leverage on shorts).

See various trading profiles using SPY and SSO below.

Note:
(1) The scale on the Y-axis is different in each graph below.
(2) Our "Conservative" mix below performs better than most other "Growth" models on the market today.
(3) For extra '"safety", you can trade a portion of your money in each below; like 30% in (I) and 70% in (IV).
(4) We trade as described in III below.


I.)  CONSERVATIVE  =>  MIPS4/MF Trading SPY Long Only (no shorts) from 2007-6/30/2014
      CAGR since Jan'07    SPY=+6.6%  vs. MIPS=+19.5%            Max Drawdown= -6.0%

  
II.) GROWTH  =>  MIPS4/MF Trading SPY/SH long/short from 2007-6/30/2014
      CAGR since Jan'07   SPY=+6.6%  vs. MIPS=+29.4%                Max Drawdown= -10.6%


III.) AGGRESSIVE  =>  MIPS4/MF Trading 50% in each of SPY/SH and SSO/SH Lg/Sht from 2007-6/30/2014
       CAGR since Jan'07 SPY=+6.6%  vs.  MIPS=+39.4%               Max Drawdown= -12.2%


IV.) ULTRA AGGRESSIVE   =>  MIPS4/MF Trading SSO/SH long/short from 2007-6/30/2014
      CAGR since Jan'07 SPY=+6.6%   vs.  MIPS=+49.7%               Max Drawdown= -16.1%


Good "mixing" to all !!!

Posted by: Dr. G. Paul Distefano AT 09:48 pm   |  Permalink   |  Email

MIPS Timing Systems
P.O. Box 925214
Houston, TX  77292

An affordable and efficient stock market timing tool. Contact MIPS
281-251-MIPS (6477)
E-mail: support@mipstiming.com