site map
my account
contact
our facebook page
Latest Posts
Archive

+
...

Market Timing

Tuesday, March 22 2016

Many of our MIPS followers (including me) are asking if we will see new highs on the S&P 500 in the near future.  We believe there is a good chance of that happening, but we are at a very critial point now.  

As you can see in the graph below, the SPY broke through the top of an obvious double bottom at 195.0 (SP500 1950) in early March 2016, and then climbed rapidly to the bottom of the 12-month flat channel from 2015 at 204.0 (SP500 2040).  The "area" between SPY 204.0 and 214.0 is what we have been calling "No Man's Land".  The SPY broke through 204.0 with force (orange elispe), and has "stagnated" close to there for the last 3 trading days. It is very bullish that the SPY has been able to close above 204.0 every day after either opening or dropping below 204.0 intraday.  Good "bounce-backs" for the bulls !!![Looks like someone hanging on to the top of a fence for their life, and it may be so for some of their investing lives.] 

It will be very difficult for the bulls to push the SPY all of the way through "no man's land", up to strong resistance levels at 212.0 and 214.0 (SP500 2120 and 2140).  The SPY all time high is at 213.5 (SP500 2135).  And, of course, it will be even harder for the bulls to push the SPY through that level.  Even if that does happen, none of this is really good for us unless the SPY keeps going up from there or we get out before the fall back.  Read on...


Alternate:
If the bulls cannot push through SPY 213.5, we may be back to the topping process and the possibility of a big drop from near the all-time high.  See below. 


We will wait for MIPS to tell us how to trade this market...

Posted by: Dr. G. Paul Distefano AT 08:51 pm   |  Permalink   |  Email
Sunday, March 13 2016

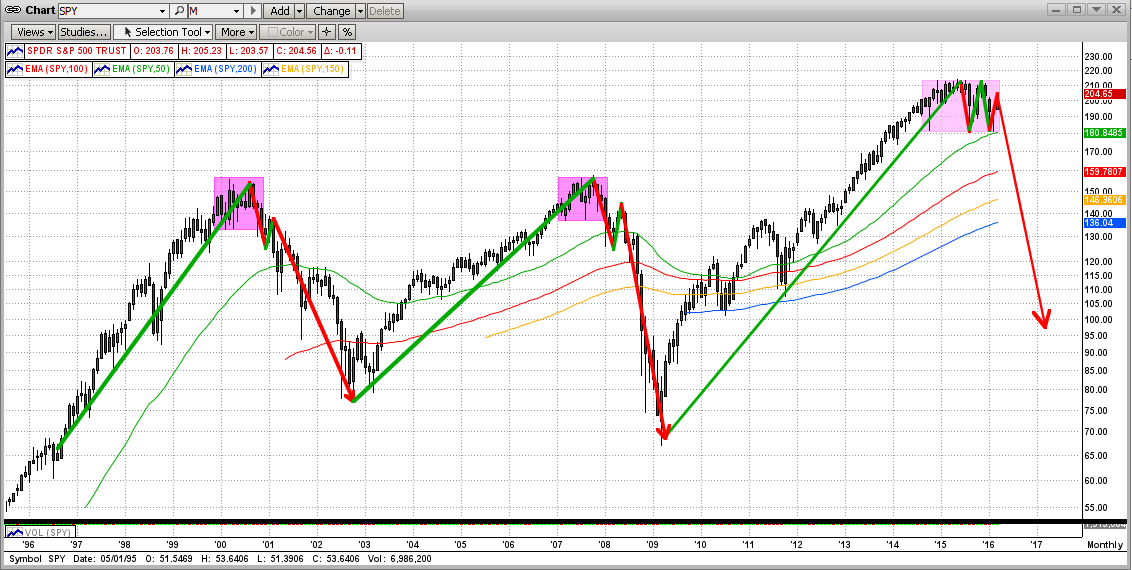
With the recent price action in the stock market, one may ask if we are in a "New Bull Run" or a "Bear Market Rally" ?

If we look at the S&P 500 Index (or the SPY) over the last 12 months, this market does not look like it is going anywhere, except maybe up and down over-and-over again. Or, maybe even down, if not for the recent rally.  The question is, "is this recent rally for real" or just a natural kick-back from a big drop (bear market rally)?

But, as active investors, we do not have the luxury to sit back and "only" analyze the market activity over the last year.  We need to know where this market is going from here, now !!! 
Read on...


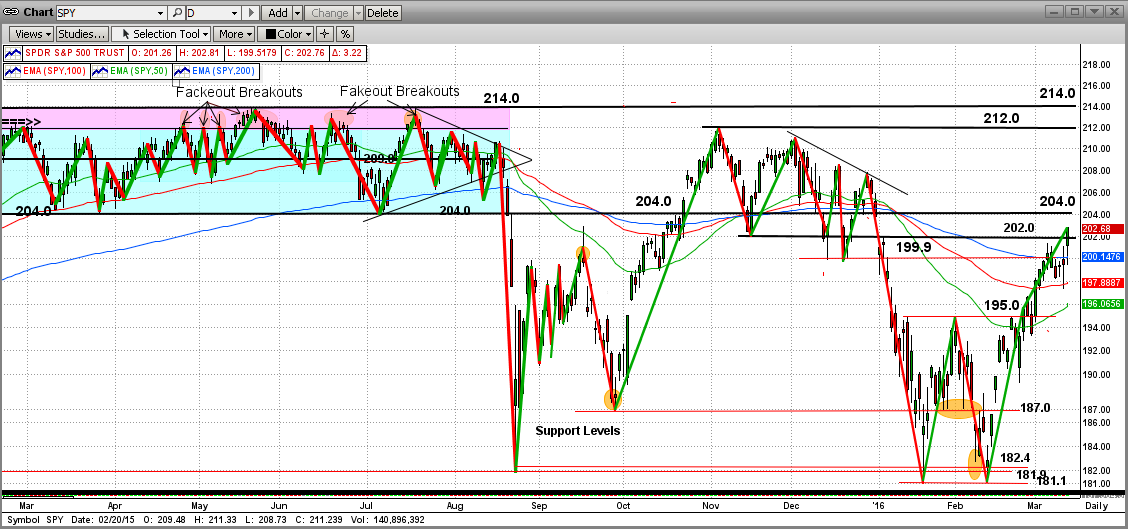
In the graph below, you can see that after several drops and kick-backs, the SPY hit and bounced off of its strong support at the SPY level of 181.0 (SP500 1810) in mid-February of 2016.

Even though there were a few other hurdles along the way up, we (and everyone else on the planet) knew that the SPY would face its toughest upside resistance at the top of the double bottom pattern at 195.0 (SP500 1950).  Needless to say now, the SPY broke through 195.0 with force at the beginning of Mar'16. That was really bullish !!!

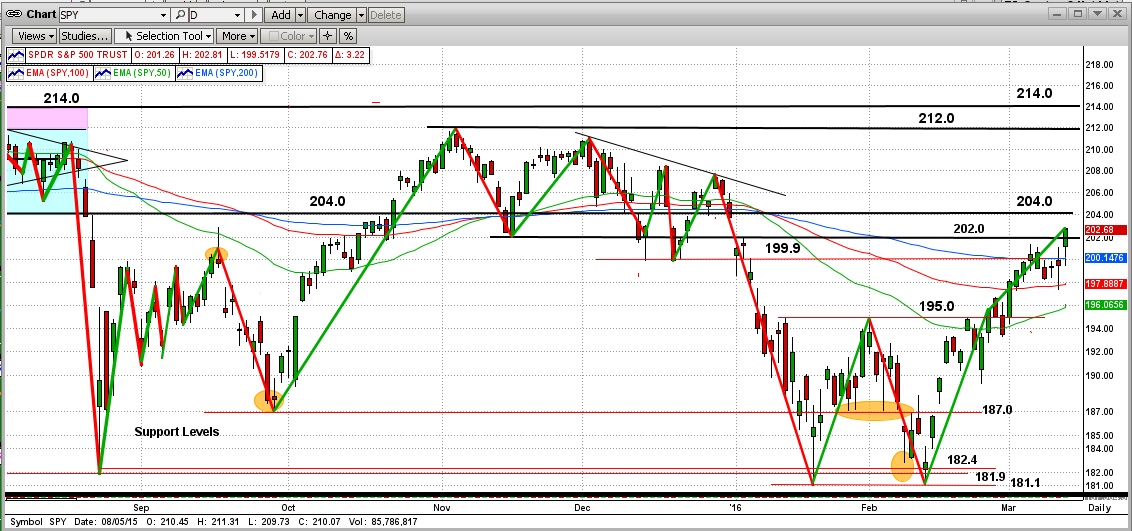
So, where does this leave us?  Since its breakout at 195.0 (SP500 1950), the SPY has managed to break through 202.0 and head for the nasty tight-trading "channel" where it "lived" for all of the first 8 months of 2015.  This "channel" is between SPY 204.0 and 214.0 (SP500 2040-2140).  If the SP500 actually hits 2140 (SPY 214.0), it will be at an all-time high, and then the sky is the limit. 

But, since there are no guarantees, this market could easily fail in its attempt to reach a new all-time high, and head back down and turn into a real "market crash".  Please understand that "this risk is not gone". We will leave that analysis up to MIPS.  Stay tuned...

Posted by: Dr. G. Paul Distefano AT 11:31 pm   |  Permalink   |  Email

MIPS Timing Systems
P.O. Box 925214
Houston, TX  77292

An affordable and efficient stock market timing tool. Contact MIPS
281-251-MIPS (6477)
E-mail: support@mipstiming.com