I am writing this for five reasons:
I.) to explain how and why a MIPS trading signal (which gets to our subscribers in a “Signal Change” email)
can last for a really long time (so-called “signal life”),
II.) to clarify how MIPS issues new signals and how we make our subscribers aware of the “Signal Status” for
each MIPS model EVERY DAY,
III) to show that more (unnecessary) trading usually yields worse results,
IV) to show the MIPS performance over the last 12 months, with and without leverage, and
V.) to show how MIPS3 performed in 2008
-------------------------------
I.) All good timing models have a foundation upon which they determine if investors should be in a Long, Short, or Cash position. Some of the underlying “foundations” of these models are trend following, reversion to the mean, momentum, relative strength, rate of change, etc. In general, the MIPS models are Trend Following models. But, believe it or not, they contain some of all of the above foundations (the MIPS models contain up to 165 standard technical indicators, artificial intelligence, pattern recognition, and applied math algorithms).
MIPS’ strength lies in its ability to determine when the market has “turned over” from up-to-down or from down-to-up (mathematically called “Inflection Points”).
We all know that the market basically moves in “cycles”; from short-term (days to weeks), to intermediate-term (weeks to months), and to long-term cycles (months to years). And, an intermediate-term cycle basically ignores short-term cycles and a long-term cycle ignores both short-term and intermediate-term cycles.
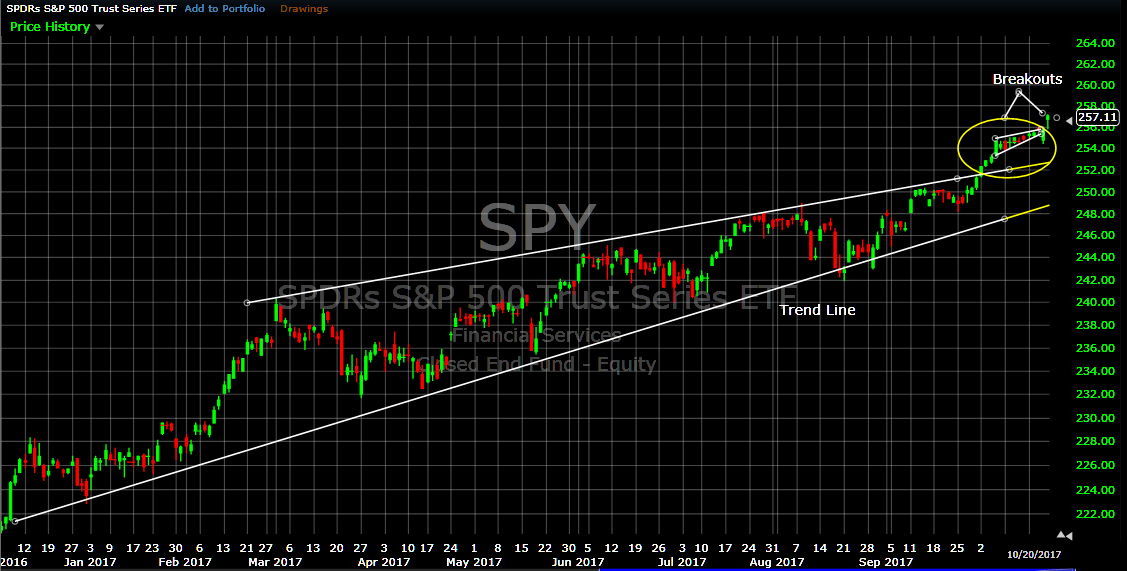
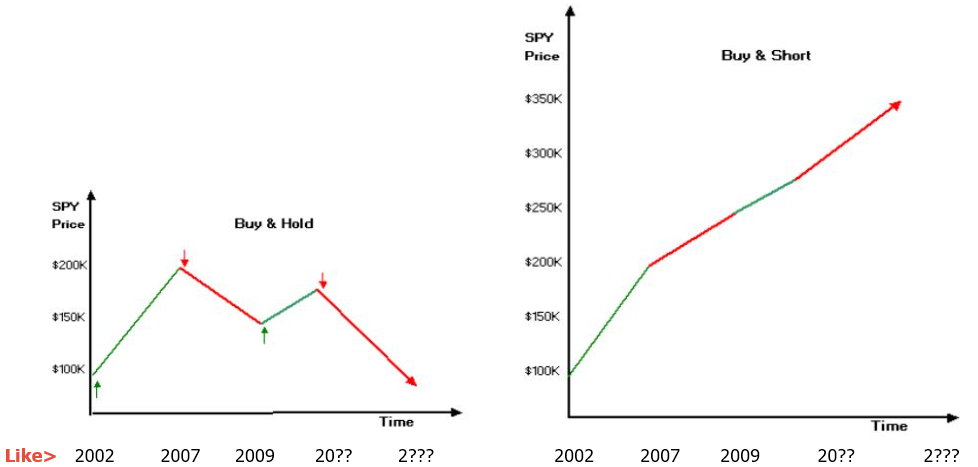
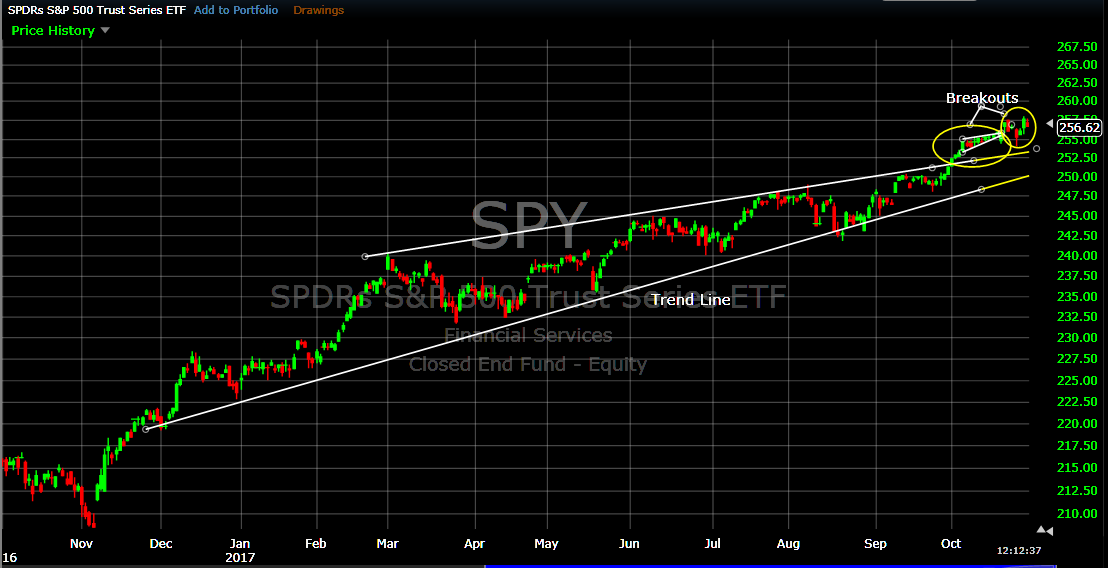
MIPS tracks intermediate-term cycles. “Cycles” in the stock market move from tops-to-bottoms, and then turn around and move from bottoms-to-tops. An up-trend is a series of higher highs and higher lows, and the up-trendline is a line along the bottoms (and the inverse for a down-trendline). See graph below.
A good trend following model will rarely change position unless the market breaks the trendline with force, and which has the support of a strong majority of the other technical algorithms confirming a market breach in the current direction.
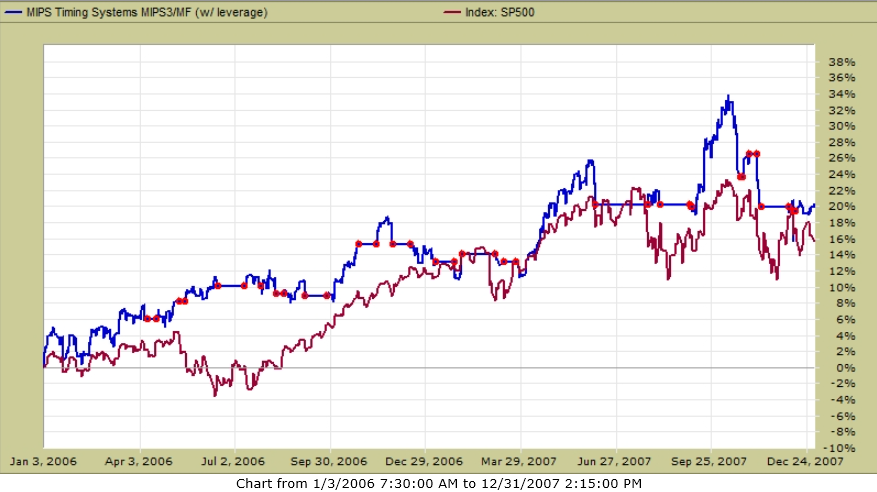
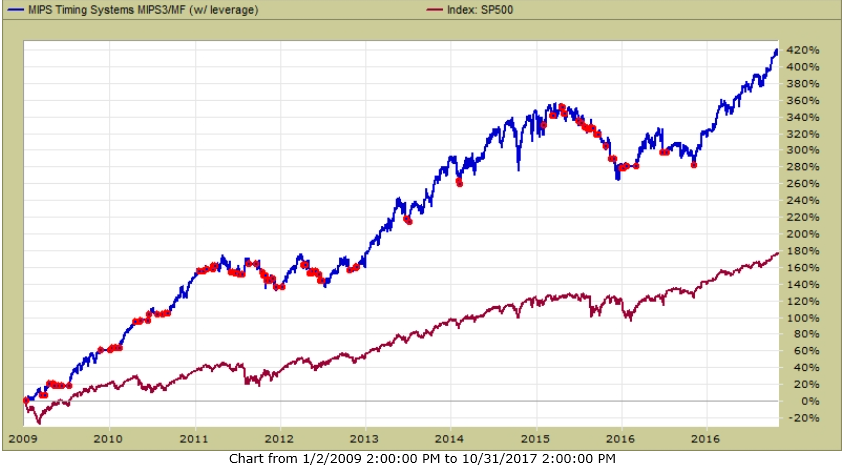
With enough strength in a strong up-market, an intermediate-term cycle can turn into a long-term cycle. As can be seen in the graph below, in the last 12 months the market has moved up on what could be called a “near-perfect” up-trend, AND all of the MIPS models have remained LONG during this entire period (a new record of time for a MIPS “signal life”).
Remember, a good timing model not only needs to know when to trade, but it also needs to know when NOT to trade.
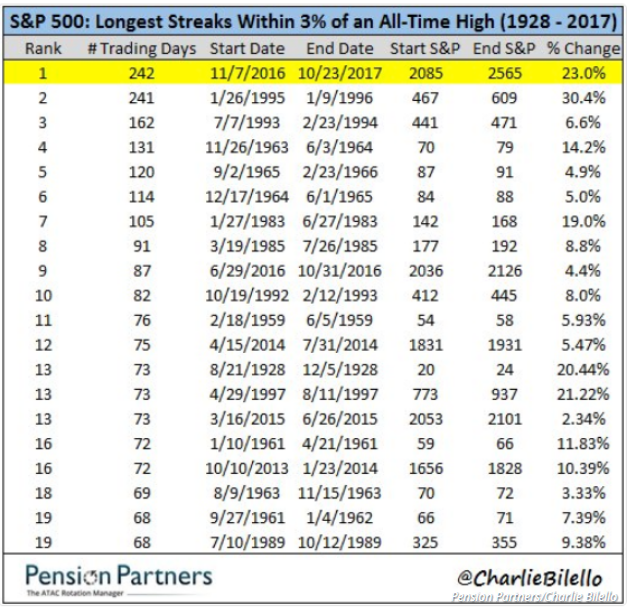
BTW:
The S&P 500 just set an all-time record for the number of consecutive days when the S&P 500 did not have a 3% loss. As of today’s date (10/30/2017) that would be very close to one year (247 trading days) !!! Of course, this usually means that it is very difficult for most timing models to “trade the dips”. It would be better to stay long with some leverage (like 1.5x leverage).
.
-------------------------------
II.) Moving on to Section II in this Blog, the MIPS models send out “Signal Change” emails every time that any one or more of the models instructs MIPS subscribers to “change” position (like from Long-to-Short, or from Short-to-Cash, etc). Of course, at MIPS we “run the models” EVERY DAY (in triplicate) to determine if any of the MIPS signals have changed. If so, we send out a "Signal Change" email after the close that day. If not, we send "Signal Status" emails to our subscribers every weekend. This way, if a subscriber missed a Signal Change email or forgot to trade it, they will be aware over the weekend that they missed a Signal Change.
A few market timers send out daily Signal Status emails. But we (along with most others), do not do so mainly because most of our subscribers and RIA customers do not want to be inundated with emails from MIPS unless there is a Signal Change (remember, there are about 240-250 trading days each year). Unfortunately, because we do not send out daily emails, some subscribers feel as if we are not paying attention to MIPS or the markets, which of course, is dead wrong.
-------------------------------
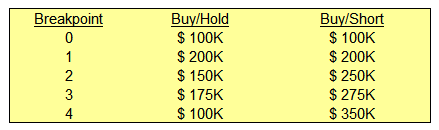
III) Regarding trading frequency, no one should change a winning position (execute another trade) unless the trend that the model is tracking has changed direction (in other works, “Don’t Fight The Trend”). And remember when you make a trade (like buy) you will ultimately need to reverse that trade (like sell or short). So, on each new trade, you must be correct on when to buy AND when to sell. A good example of this can be displayed by showing the performance of most of the timing models that were tracked by TimerTrac.com over the last 12 months (see Table below).
The table below from TimerTrac.com over the last 12 months shows (a) the performance (Gain/Loss %) with no leverage, and (b) the number of trades from over 75 of the models that it tracks. The MIPS models are at (or near the top), with only 2 trades from MIPS3 and no new trades from MIPS4 and Nitro.
Average:
Over the last 12 months
- the MIPS models averaged a gain/loss of 21.2%, with a average of 1 trade each.
- other models with over 80 trades averaged a gain/loss of -13.3%, with an average 117 trades each.
PS – Of course, this does NOT mean that models that trade less perform better…
Long-Term trading
Since Nov’05, the MIPS models have averaged 12-15 trades/year, with the lower ones being 2-4 trades/year and the high end being 16-20 trades/year. In the 18 months of the last market crash (Oct’07 – Mar’09) MIPS3 issued 18 trades.
|
|
|
|
|
|
|
|
|
|
|
|
|
|
|
|
|
|
|

|
|
|
|
|
Top Performers over the period from Monday, October 31, 2016 through Friday, October 27, 2017
|
|
The index SP500 gained 21.38% over this same time period.
|
|
|
|
|
|
|
|
|
|
Rank
|
Strategy Name
|
Gain/Loss %
|
Difference %
|
Trades
|
|
1
|
|
21.40%
|
0.01%
|
6
|
|
2
|
MIPS Timing Systems MIPS/Nitro
|
21.38%
|
0.00%
|
0
|
|
2
|
MIPS Timing Systems MIPS4.sso
|
21.38%
|
0.00%
|
0
|
|
2
|
|
21.38%
|
0.00%
|
0
|
|
2
|
|
21.38%
|
0.00%
|
0
|
|
2
|
|
21.38%
|
0.00%
|
0
|
|
2
|
|
21.38%
|
0.00%
|
0
|
|
2
|
|
21.38%
|
0.00%
|
0
|
|
2
|
|
21.38%
|
0.00%
|
0
|
|
2
|
|
21.38%
|
0.00%
|
0
|
|
2
|
|
21.38%
|
0.00%
|
0
|
|
2
|
|
21.38%
|
0.00%
|
0
|
|
2
|
|
21.38%
|
0.00%
|
0
|
|
2
|
|
21.38%
|
0.00%
|
0
|
|
2
|
|
21.38%
|
0.00%
|
0
|
|
3
|
|
21.38%
|
0.00%
|
6
|
|
4
|
MIPS Timing Systems MIPS3/MF
|
20.93%
|
-0.46%
|
2
|
|
5
|
|
20.79%
|
-0.59%
|
31
|
|
6
|
|
20.47%
|
-0.91%
|
2
|
|
7
|
|
18.99%
|
-2.39%
|
17
|
|
8
|
|
18.37%
|
-3.02%
|
94
|
|
9
|
|
18.05%
|
-3.33%
|
99
|
|
10
|
|
18.01%
|
-3.38%
|
7
|
|
11
|
|
17.77%
|
-3.61%
|
7
|
|
12
|
|
17.63%
|
-3.75%
|
6
|
|
13
|
|
17.53%
|
-3.85%
|
14
|
|
14
|
|
17.36%
|
-4.02%
|
8
|
|
15
|
|
17.08%
|
-4.30%
|
7
|
|
16
|
|
15.95%
|
-5.43%
|
3
|
|
17
|
|
15.43%
|
-5.95%
|
5
|
|
18
|
|
15.29%
|
-6.09%
|
15
|
|
19
|
|
14.76%
|
-6.62%
|
23
|
|
20
|
|
14.63%
|
-6.75%
|
3
|
|
21
|
|
14.37%
|
-7.01%
|
132
|
|
22
|
|
13.81%
|
-7.58%
|
132
|
|
22
|
|
13.81%
|
-7.58%
|
132
|
|
23
|
|
13.75%
|
-7.63%
|
24
|
|
24
|
|
13.08%
|
-8.30%
|
52
|
|
25
|
|
12.91%
|
-8.47%
|
49
|
|
26
|
|
12.71%
|
-8.67%
|
3
|
|
27
|
|
12.27%
|
-9.11%
|
42
|
|
28
|
|
12.16%
|
-9.22%
|
16
|
|
29
|
|
11.90%
|
-9.48%
|
12
|
|
30
|
|
11.64%
|
-9.74%
|
35
|
|
30
|
|
11.64%
|
-9.74%
|
35
|
|
30
|
|
11.64%
|
-9.74%
|
35
|
|
30
|
|
11.64%
|
-9.74%
|
35
|
|
30
|
|
11.64%
|
-9.74%
|
35
|
|
30
|
|
11.64%
|
-9.74%
|
35
|
|
31
|
|
11.41%
|
-9.97%
|
12
|
|
32
|
|
11.40%
|
-9.98%
|
16
|
|
33
|
|
11.32%
|
-10.07%
|
56
|
|
34
|
|
11.23%
|
-10.15%
|
50
|
|
35
|
|
11.16%
|
-10.22%
|
55
|
|
36
|
|
10.89%
|
-10.49%
|
10
|
|
37
|
|
10.71%
|
-10.67%
|
63
|
|
38
|
|
10.69%
|
-10.69%
|
81
|
|
39
|
|
10.66%
|
-10.72%
|
24
|
|
40
|
|
9.37%
|
-12.02%
|
17
|
|
41
|
|
8.83%
|
-12.55%
|
59
|
|
42
|
|
8.33%
|
-13.05%
|
90
|
|
43
|
|
8.00%
|
-13.38%
|
12
|
|
44
|
|
7.59%
|
-13.79%
|
4
|
|
45
|
|
7.32%
|
-14.07%
|
22
|
|
46
|
|
7.20%
|
-14.19%
|
10
|
|
47
|
|
7.10%
|
-14.28%
|
55
|
|
48
|
|
6.93%
|
-14.45%
|
7
|
|
49
|
|
6.88%
|
-14.50%
|
9
|
|
50
|
|
6.81%
|
-14.57%
|
21
|
|
51
|
|
6.60%
|
-14.78%
|
240
|
|
52
|
|
6.01%
|
-15.37%
|
43
|
|
53
|
|
5.75%
|
-15.63%
|
9
|
|
54
|
|
5.70%
|
-15.68%
|
152
|
|
55
|
|
5.69%
|
-15.69%
|
15
|
|
56
|
|
4.89%
|
-16.50%
|
49
|
|
57
|
|
4.88%
|
-16.50%
|
12
|
|
58
|
|
4.80%
|
-16.58%
|
10
|
|
59
|
|
4.64%
|
-16.74%
|
2
|
|
60
|
|
4.56%
|
-16.82%
|
12
|
|
61
|
|
4.31%
|
-17.07%
|
96
|
|
62
|
|
3.84%
|
-17.54%
|
234
|
|
63
|
|
3.59%
|
-17.79%
|
18
|
|
64
|
|
3.21%
|
-18.17%
|
14
|
|
65
|
|
3.17%
|
-18.22%
|
3
|
|
65
|
|
3.17%
|
-18.22%
|
3
|
|
65
|
|
3.17%
|
-18.22%
|
3
|
|
65
|
|
3.17%
|
-18.22%
|
3
|
|
66
|
|
2.35%
|
-19.03%
|
19
|
|
67
|
|
2.19%
|
-19.19%
|
23
|
|
68
|
|
0.00%
|
-21.38%
|
0
|
|
68
|
|
0.00%
|
-21.38%
|
0
|
|
68
|
|
0.00%
|
-21.38%
|
0
|
|
68
|
|
0.00%
|
-21.38%
|
0
|
|
68
|
|
0.00%
|
-21.38%
|
0
|
|
68
|
|
0.00%
|
-21.38%
|
0
|
|
68
|
|
0.00%
|
-21.38%
|
0
|
|
69
|
|
-0.53%
|
-21.91%
|
2
|
|
70
|
|
-0.81%
|
-22.20%
|
2
|
|
71
|
|
-0.85%
|
-22.24%
|
120
|
|
72
|
|
-1.65%
|
-23.04%
|
87
|
|
72
|
|
-1.65%
|
-23.04%
|
87
|
|
73
|
|
-2.78%
|
-24.16%
|
12
|
|
74
|
|
-3.60%
|
-24.98%
|
13
|
|
75
|
|
-5.60%
|
-26.98%
|
1
|
|
76
|
|
-15.28%
|
-36.66%
|
32
|
---------------------------------
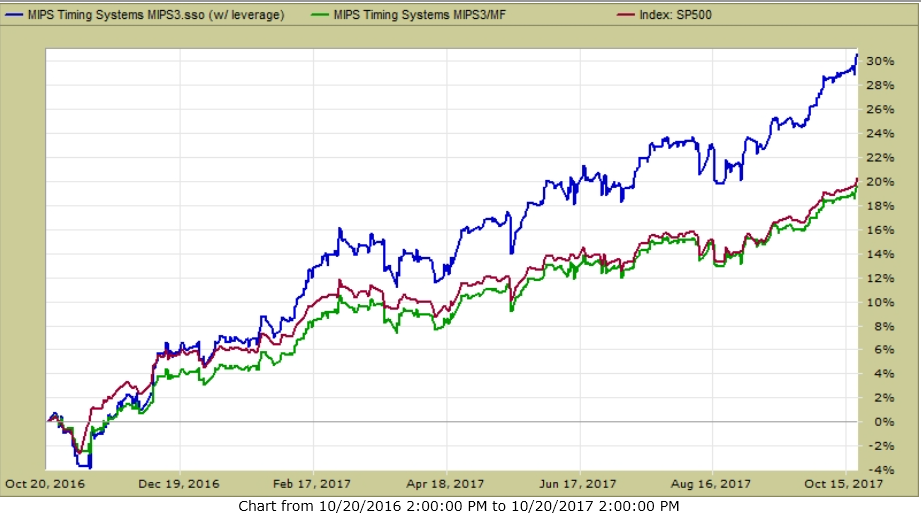
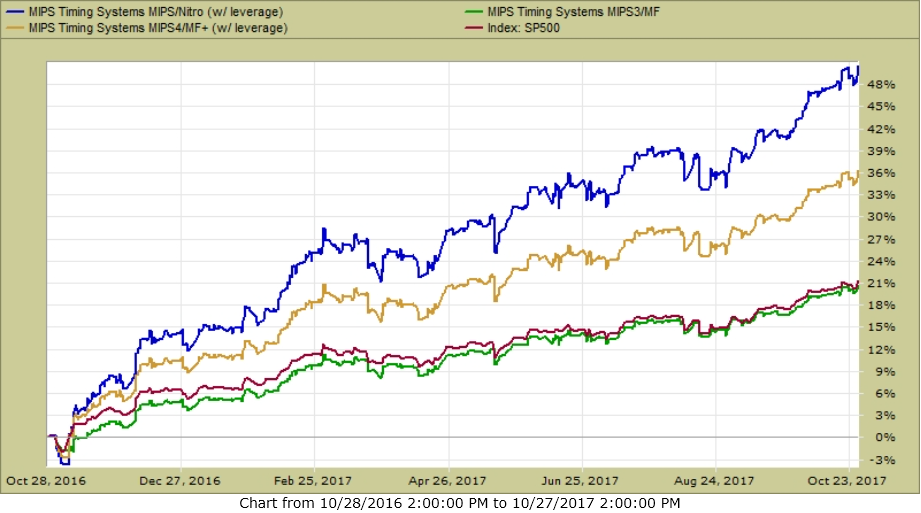
IV) MIPS performance over the last 12 months (from TimerTrac.com)
- MIPS/Nitro with 2x leverage (blue line) + 50%
- MIPS4 with 1.5x leverage (gold line) + 36%
- MIPS3 with no leverage (green line) +21%
- SPY (red line) +21%
.
-----------------------------------
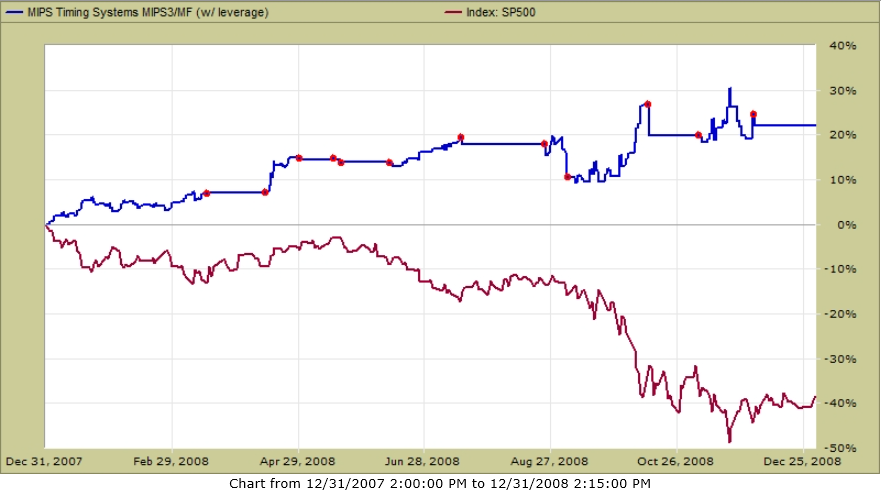
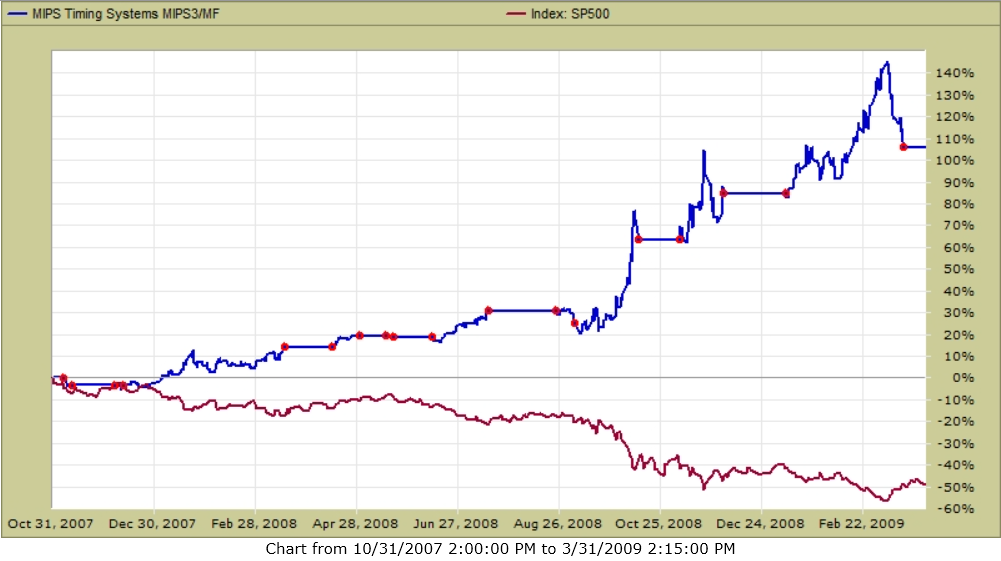
V.) How did MIPS perform in 2008
The graph below is:
(a) to prove that MIPS not only performs well in up markets, but also
(b) to show how fast MIPS3 actually responded to the market crash in 2008.
- MIPS3 issued its first short signal in 4Q’07 (verified by TimerTrac.com),
MIPS3 – 4Q’07 thru 1Q’09
- MIPS3 - blue line +106%
- SPY - red line -48%
Red dots indicate actual signals …
 .
.
In summary, it seems that many “investors” get such a big “kick” out of trading, they lose track of the objective of making money. Many will not tolerate a lower frequency trading model, but seem to love higher frequency trading models that do not perform nearly as well as MIPS. You tell me why…
.
--------------------------------
Best Wishes…
Paul Distefano, PhD
CEO / Founder
MIPS Timing Systems, LLC
Houston, TX
281-251-MIPS(6477)
Support@mipstiming.com
www.mipstiming.com


 .
.