Monday, April 23 2018
The "votes" are in from our recent "Survey", where the possibilities for the SPY from Apr 15th to the end
of May 2018 are (see graph below):
A) complete the W-Pattern and make new highs, or
B) at or near the new high level, turn around and head back down, or
C) hit the top of the Triangle line, turn around and head back down, or
D) stall before reaching the top of the Triangle pattern, and head back down.
The final results are:
A) 42%
B) 13%
C) 30%
D) 15%
From above:
o 42% of MIPS followers are VERY optimistic and see the SPY breaking above and making new highs, but
o 30% feel that the SPY will go up from Apr 15th but will fail to reach its all-time high; and then drop way
back down.
I am glad the we have MIPS and don't have to "guess" what to do next...
Paul Distefano, PhD
CEO / Founder
MIPS Timing Systems, LLC
Houston, TX
281-251-MIPS(6477)
==============================================================
April 15, 2018
MIPS Members:
We are all very much aware that the unstoppable bull run since March 2009 was punched straight in the nose at the end of January 2018 and the S&P 500 went tumbling down about -10%. Good things for the market, like corporate earnings, new jobs, and lower unemployment have been offset by new tariffs, trade wars, real wars, the Fed, rising interest rates and fears of increasing inflation.
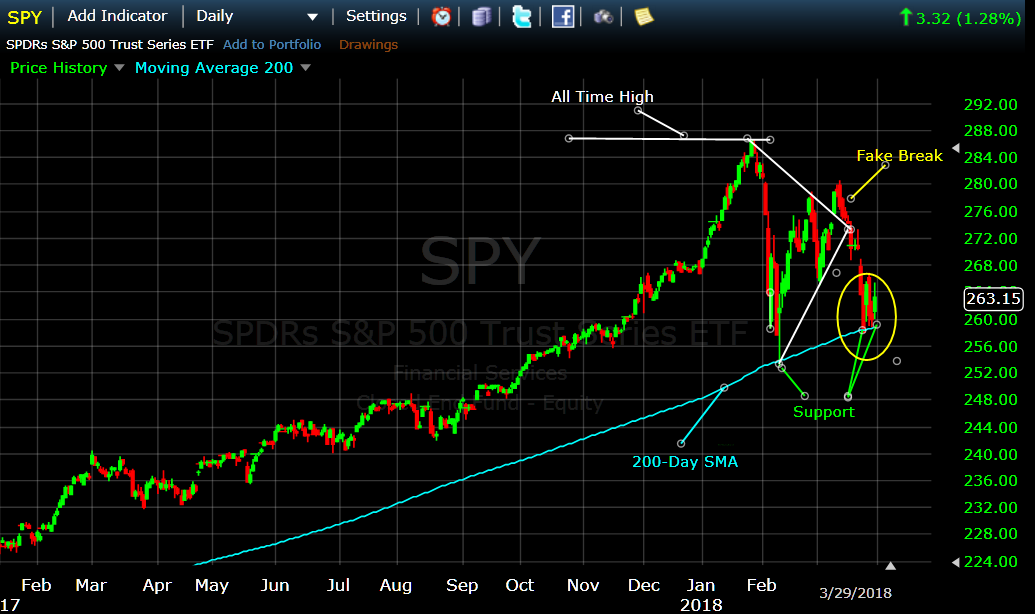
At any rate, since the end of January 2018, the SPY has waffled down and up several times forming either a "W-Pattern" as in the yellow lines below (similar to a double bottom) or a "Triangle Pattern" as in the white lines below.
The possibilities for the SPY from today to the end of May 2018 are:
A) complete the W-Pattern and make new highs, or
B) at or near the new high level, turn around and head back down, or
C) hit the top of the Triangle line, turn around and head back down, or
D) stall before reaching the top of the Triangle pattern, and head back down.
We are asking for your opinion, and will offer a one month free MIPS monthly subscription ($39 refund) to the first 10 responders that call the correct or closest outcome (A,B, C, or D) that happens by the end of May 2018.

Good trading...
Paul Distefano, PhD
CEO / Founder
MIPS Timing Systems, LLC
Houston, TX
281-251-MIPS(6477)
Sunday, April 15 2018
We are all very much aware that the unstoppable bull run since March 2009 was punched straight in the nose at the end of January 2018 and the S&P 500 went tumbling down about -10%. Good things for the market, like corporate earnings, new jobs, and lower unemployment have been offset by new tariffs, trade wars, real wars, the Fed, rising interest rates and fears of increasing inflation.
At any rate, since the end of January 2018, the SPY has waffled down and up several times forming either a "W-Pattern" as in the yellow lines below (similar to a double bottom) or a "Triangle Pattern" as in the white lines below.
The possibilities for the SPY from today to the end of May 2018 are:
A) complete the W-Pattern and make new highs, or
B) at or near the new high level, turn around and head back down, or
C) hit the top of the Triangle line, turn around and head back down, or
D) stall before reaching the top of the Triangle pattern, and head back down.
We are asking for your opinion, and will offer a one month free MIPS monthly subscription ($39 refund) to the first 10 responders that call the correct or closest outcome (A,B, C, or D) that happens by the end of May 2018.
Good trading...
Paul Distefano, PhD
CEO / Founder
MIPS Timing Systems, LLC
Houston, TX
281-251-MIPS(6477)
Wednesday, April 11 2018
The MIPS3, MIPS4, and MIPS/Nitro models issued two “signal changes” (trades) in just three days last week, after being in a Long signal position for over 15 months. Lots of MIPS members have asked us for an explanation.
The MIPS models are very complex models that use more of our own proprietary mathematical algorithms (applied math, pattern recognition, artificial intelligence, etc.) than simple tactical indicators. In total, however, “votes” from over 150+ technical indicators and market behavior algorithms decide in which direction “the market” is moving (for us, “the market” is the S&P 500 Index, or SPY).
OFFENSIVE SIGNALS
Please understand that we run the MIPS models each and every day from scratch. When a MIPS model indicates, with a strong degree of confidence, that the direction of the market has changed, it will issue a “signal change” and this goes out in an email to MIPS members (and is updated on the MIPS website immediately thereafter). Of course, if the model does not identify a new change in the market direction with high confidence that day, it will keep the same position (Long, Short, or Cash). And, this can go on as long as the market keeps growing (or declining) as in the last 15+ months. In all of the above cases, we call these signals “Offensive Signals”, and over 80-90% of our signals are Offensive (see Defensive Signals below).
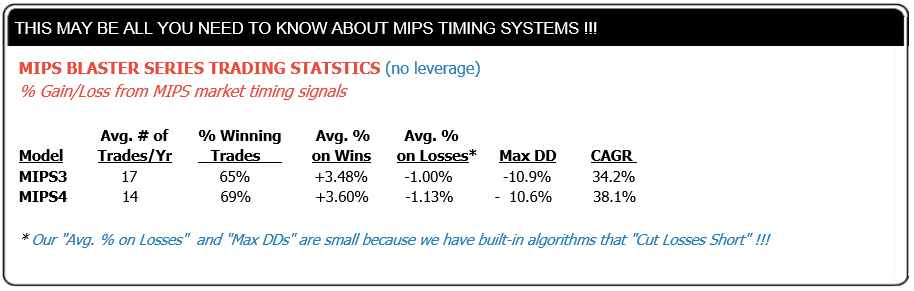
Now, things get interesting (and pseudo confidential for all recipients). To understand this Blog from here on, please take a second to “study” the table below (from the Home page on our website).
DEFENSIVE SIGNALS
MIPS3 has been tracked and its signals have been verified since Nov 2005. MIPS4 is a more recent model and is slightly better than MIPS3. So, let’s concentrate on MIPS4 for this blog. BTW, the results in the table above result from the MIPS models with the Blaster Series algorithms.
What is obvious in the above table is that, on average, the MIPS4 models traded a little over one time per month, the trades were winners almost 70% of the time, the CAGR was almost 40%, and the maximum drawdown was just a little over -10%.
The stats above are all great, but there is “one thing” that all MIPS members should be aware of and be happy about. I am sorry to say that we have been publishing this chart for years, and we have gotten very few questions about one important entity in it. If one digs a little deeper, they would realize that this “one thing” that makes such a huge improvement in performance is that the average GAIN on winning trades is +3.5%, but the average LOSS on losing trades is only -1.1%. That is pretty good proof that a timing model that is programmed to automatically “cut its losses short” is working with darn near perfection.
This is NOT a Coincidence!!!
The much lower average LOSS above does not “just happen”, but rather it results from highly effective “stops” that we designed and built into the MIPS models. The MIPS very low average LOSS is only about 1/3 of the size of its average GAIN. If we had done nothing in the MIPS models to cut LOSSES, instead of the average loss being -1.1% as it is now, it is highly likely that the average loss would be close to the opposite of the average gain (or about -3.5%). The reason that we defined our “stops” with quotation marks is that our “stops” are NOT derived simply from a designated loss from the last actual initial trade or from a trailing high. Our "stops" are designed so that, as a MIPS model “learns” about its most recent bad performance (e.g., it losses 3-4 days in a row, or it losses 4 days out of 5, and many more), other algorithms take over and either reverse the current signal or takes the model to a Cash position.
We have many of these proprietary “stops” built into all MIPS models, and they can either take a new Long or Short signal that is not working well to Cash, or they can take a Cash signal that is being left behind in performance to a new Long or Short position !!!
The MIPS models are more likely to issue both offensive and defensive signals quickly in relatively flat, horizontal market patterns than in markets with a strong up or down trend with low volatility; but it can happen at any time. The Defensive signal algorithms In our MIPS models work exceptionally well, and this is one reason why our average losses are so low.
LAST WEEK and 2018 YTD
The MIPS3, MIPS4, MIPS/Nitro models that had been long for over 15 months issued two trade signals last week (a Cash signal on 4/3/18 and a Long signal on 4/5/18). Since 4/2/18, all of the MIPS models are up approximately +1.5% as of the close on 4/10/18; but the MIPS models are down -4.6% for the year.
Good Trading !!!
Paul Distefano, PhD
CEO / Founder
MIPS Timing Systems, LLC
Houston, TX
281-251-MIPS(6477)
Sunday, April 01 2018
What a surprise !!!
After an almost straight up market since the presidential election in Nov’16, the market kind of “exploded” in 1Q’18.
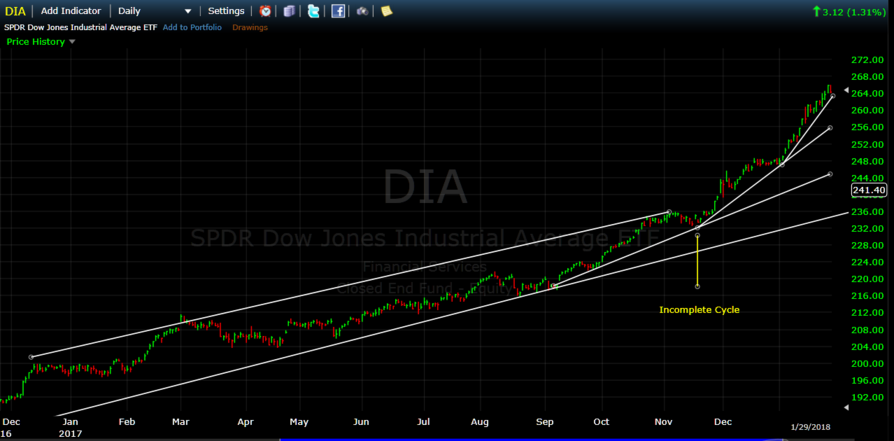
However, it should not have been such a big surprise if one had only paid attention to the market performance several months before the explosion. For example, it can be seen in the graph immediately below that, instead of the market completing its normal up-down cycle in the channel below in November 2017, it "blasted off" like a cannon ball until all indices were greatly overbought by the end of January 2018.
2nd Graph
In an overbought situation like this, it usually does not take a big catalyst to start the market spiraling down. In this case, it was things like Trump’s tariffs, talk of trade wars, uncertainty with North Korea, investigation of Russian collusion, etc. For whatever reason, it happened and the results were not pretty. Since there are no free lunches in the stock market, after the big 4th quarter 2017 run up it seems like all professional traders decided to dump their winners and “take profits” on the first bad news in 2018. Of course, this action indeed prompted the market to explode (see graph below). If this continues, things could really get ugly.
On the other hand, it is now at least some form of comfort that the market (SPY) tested its Support Level (200-Day SMA) five trading days in a row, and it bounce back up on Thursday, March 29th (see the very last 5 bars at the “Support Level” on the right-hand side in the chart below).
It seems that the SPY got high enough above its trend line that “reversion-to-the-mean” mentality took over and drove the market back down to its 200-day SMA support level. Hopefully (and most likely) the market will continue up after testing the support level and having the bulls win (i.e., the market may have drained the overbought swamp).
Graph #3
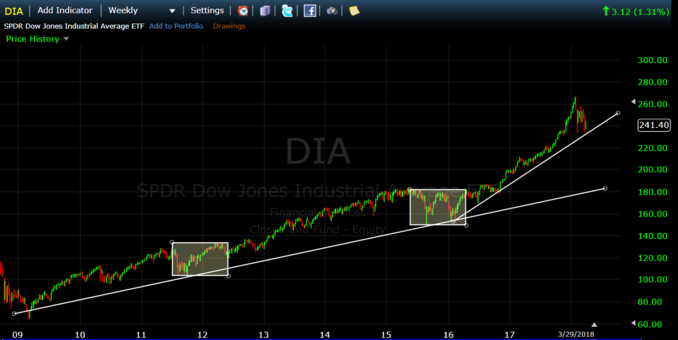
If we step back and look at the steep, steady growth in the market since 2009 (graph below), and if we compare the last 2 years’ performance to the prior 8-year uptrend, it is easy to see why the MIPS models have traded only a few times since the beginning of 2016. In most cases, models that chased every “dip” in the market over the last 10 years ended up getting whipsawed at least a few times along the way. More trades DO NOT automatically lead to better performance as many people think (and in most cases the opposite is true).
BTW, when one looks at the “explosion” in February 2018 from a long-term perspective as in the graph below, it can be seen that relative to the prior growth in the market, the drawdown in 1Q’18 does not seem so “damaging” after all. From a mathematical standpoint, the MIPS models have a form of “relativity” built in. This means that algorithms that could signal a “sell or short” with a dip of 3-4% in a flat or slow growth market, might ignore a dip of 8-9% in a very high growth market (as in the last 2 years).
First Quarter of 2018
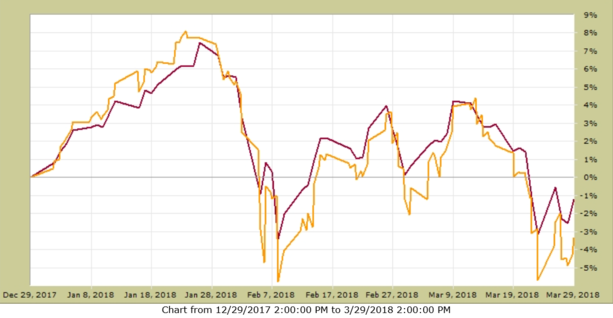
Even with the great degree of volatility in the market in 1Q’18 and the big drop in the SPY from its highs, the MIPS3 (and MIPS4) models performed exceptionally well in 2007-2017, and only lost back -3.5% in 1Q'18.
MIPS3 Model
Trading SPY with 1.5x Leverage Long and 0.5x Short
The MIPS3 model gained +45% in 2016-2017 and it only lost back -3.5% in 1Q’18
2016-2017
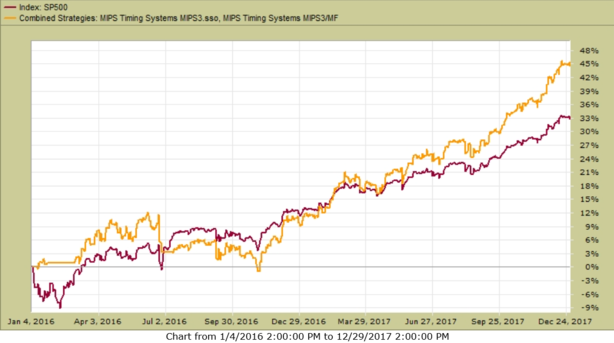
1Q'18
PS – Lots of analyzing (and guessing) going on here, and that is why we use MIPS to tell us what to do with a MUCH GREATER degree of accuracy.
Good Trading…
Paul Distefano, PhD
CEO / Founder
MIPS Timing Systems, LLC
Houston, TX
281-251-MIPS(6477)
|


