Friday, October 28 2016
There was nothing really bullish in the news or in the markets this week except:
1) in total, corporate earnings were better than expected
2) our country's GDP was up, and
3) even after the FBI broke the news today that they will be examining more Hillary emails (and this
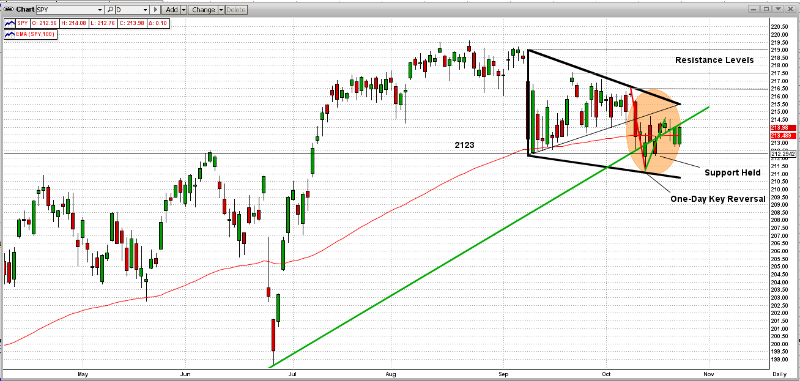
turned the markets upside-down), the SPY support gave way as it broke below 2123 but then
it bounced back up above its support to close slightly above 2125 (see graph below).

Stay tuned...
Paul Distefano
-----------------------
Contact Info
Paul Distefano, PhD
CEO / Founder
MIPS Timing Systems. LLC
Houston
281-251-MIPS(6477)
www.mipstiming.com
=============================================================
<<< Previous Blog >>>
MIPS Members:
It's times like this when we need a good timing model (like MIPS) to help provide guidance for us in determining the next "big" moves in the market. When I say "big" moves, I mean future 2-6 month's trends, and NOT the 3-8 day "wiggles". Remember, our new Blaster Series algorithms are supposed to keep us away from trading short-term "wiggles".
As you can see in the graph below, the market (namely the S&P 500 index, or its ETF the SPY) is basically in a "Standoff", where the market can easily go either way from here.
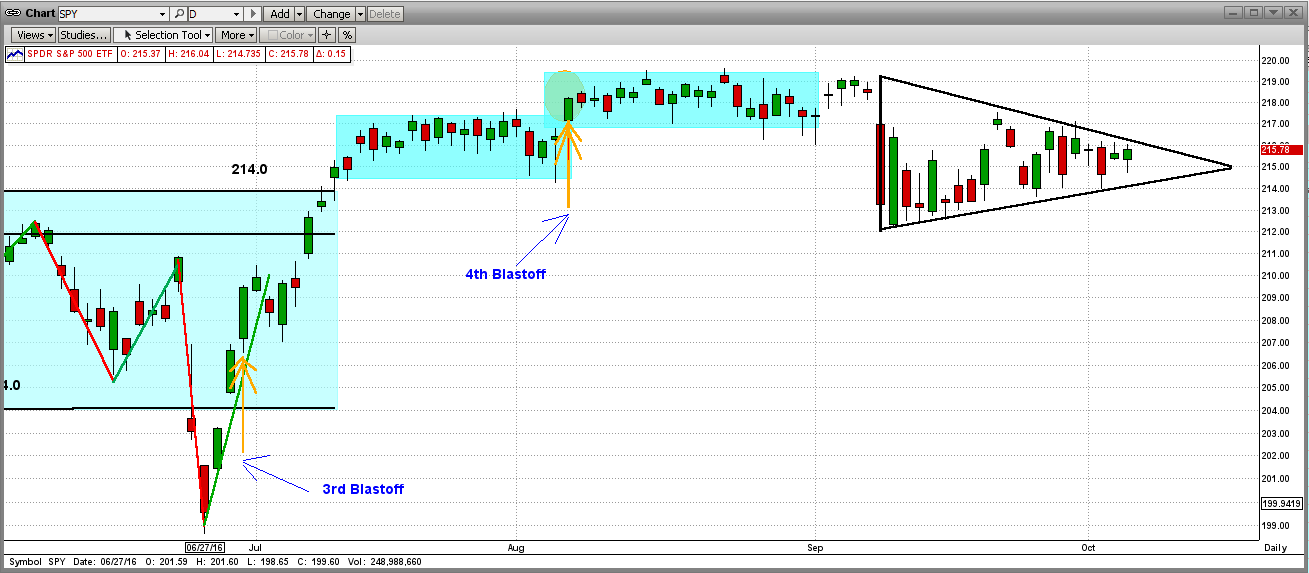
On 10/10/16, the SPY hit the top of the "Triangle" pattern, and was followed by three additional days of drops. Fortunately, on the third trading day (10/13/16), the SPY dropped substantially in early trading and crossed well below its strong support level at 2123 (horizontal black line); but then, the SPY came fighting its way back up (rebounded) and closed way over its support at 2130. This would constitute what is called a "One Day Key Reversal" to the upside, a very bullish move.
After climbing back above the long-term trend line (green line), the market tried but failed to stay well above the LT trend line. Actually, the SPY closed the week basically "ON" the trend line, which is neither bullish or bearish. Or maybe, its just a little bullish since the SPY was facing a sudden downdraft, but somehow managed to "hold the line" right on the LT trend-line (and not below it).
Bearish Bullish
The SPY broke below the triangle pattern The SPY was able to hold above its support of 2123
The SPY gave up its rebound and stopped The SPY closed on or above the LT Trend Line in all of the last 4 days
The SPY was on or above its 100-Day EMA for the last 4 days
Stay tuned...
- All MIPS models are still Long...
Thanks,
Paul Distefano
-----------------------
Contact Info
Paul Distefano, PhD
CEO / Founder
MIPS Timing Systems. LLC
Houston
281-251-MIPS(6477)
www.mipstiming.com
Sunday, October 23 2016
This market remains one that is very difficult to call. There are lots of things going on that influence the direction of the markets; like The Fed, extremely low interest rates, poor corporate earnings, wild Presidential campaigns, weak international economies, etc. It seems like when any one of these "pops" just a little, the market goes crazy. That is why the market is relatively flat, but with high volatility.
From a "technical" standpoint, we have had a really interesting standoff, with the Bulls winning most and the Bears winning a few. However, the Bears have been in charge so far this week, but the Bulls may have pulled off a "turnaround" today. Still too close to call, but let's lay out what we see.
SHORT TERM
From the graph below, we can analyze the pros and cons for each side:
Bears Bulls _ ________ __
Broke triangle pattern down 3 days ago Today the SPY closed above its support at 212.0
Continued down for the next two days Today's "candle" is in a positive "Hammer" position
The SPY broke it's 100-Day EMA today Today may have been a "One Day Key Reversal"
LONG TERM
From the graph below:
Bears Bulls _ ________ _______
Broke below triangle pattern Market re-bound performed like a "One Day Key Reversal"
Broke just below the Long-Term trend line Rebounded to closed almost on the Long-Term trend line
Broke just below its 200-Day EMA
The short-term future of the market is very difficult to call under these conditions. The current MIPS signals are "LONG", so we should hold our long positions for now.
Thanks,
Paul Distefano
----------------------------------
Paul Distefano, PhD
MIPS Timing Systems
Houston, TX
281-251_MIPS(6477)
www.mipstiming.com
Thursday, October 13 2016
This market remains one that is very difficult to call. There are lots of things going on that influence the direction of the markets; like The Fed, extremely low interest rates, poor corporate earnings, wild Presidential campaigns, weak international economies, etc. It seems like when any one of these "pops" just a little, the market goes crazy. That is why the market is relatively flat, but with high volatility.
From a "technical" standpoint, we have had a really interesting standoff, with the Bulls winning most and the Bears winning a few. However, the Bears have been in charge so far this week, but the Bulls may have pulled off a "turnaround" today. Still too close to call, but let's lay out what we see.
SHORT TERM
From the graph below, we can analyze the pros and cons for each side:
Bears Bulls _ ________ __
Broke triangle pattern down 3 days ago Today the SPY closed above its support at 212.0
Continued down for the next two days Today's "candle" is in a positive "Hammer" position
The SPY broke it's 100-Day EMA today Today may have been a "One Day Key Reversal"
LONG TERM
From the graph below:
Bears Bulls _ ________ _______
Broke below triangle pattern Market re-bound performed like a "One Day Key Reversal"
Broke just below the Long-Term trend line Rebounded to closed almost on the Long-Term trend line
Broke just below its 200-Day EMA
The short-term future of the market is very difficult to call under these conditions. The current MIPS signals are "LONG", so we should hold our long positions for now.
Thanks
Paul Distefano
----------------------------------
Paul Distefano, PhD
MIPS Timing Systems
Houston, TX
281-251_MIPS(6477)
www.mipstiming.com
Friday, October 07 2016
Over long periods of time, investors disagree with each other’s views of “what” will happen to the market and what the catalyst will be that causes the “what” to happen. Some of the downside catalysts have been weak economics, poor profits, global unrest, etc.
Now, most all of us agree that the ultimate “catalyst” has been, and for the next 3-6 months will continue to be, Freddy Yellen and her near zero interest rates. No doubt that the Fed’s QE and its interest rate policy is what has kept the market from dropping or even falling apart. Money coming into the markets at a very high rate (as in the last 2 years) moves markets up; and extremely low interest rates is one of the strongest forces of money movement into the markets (round robin).
Freddy Yellen is running out of excuses, but will not raise rates until December of this (election) year. Of course, the fact that this is after the presidential election is just a coincidence, because we all know that the Fed does not let politics affect its decisions. If you believe that, call me about the ocean view property that I have for sale in Arizona.
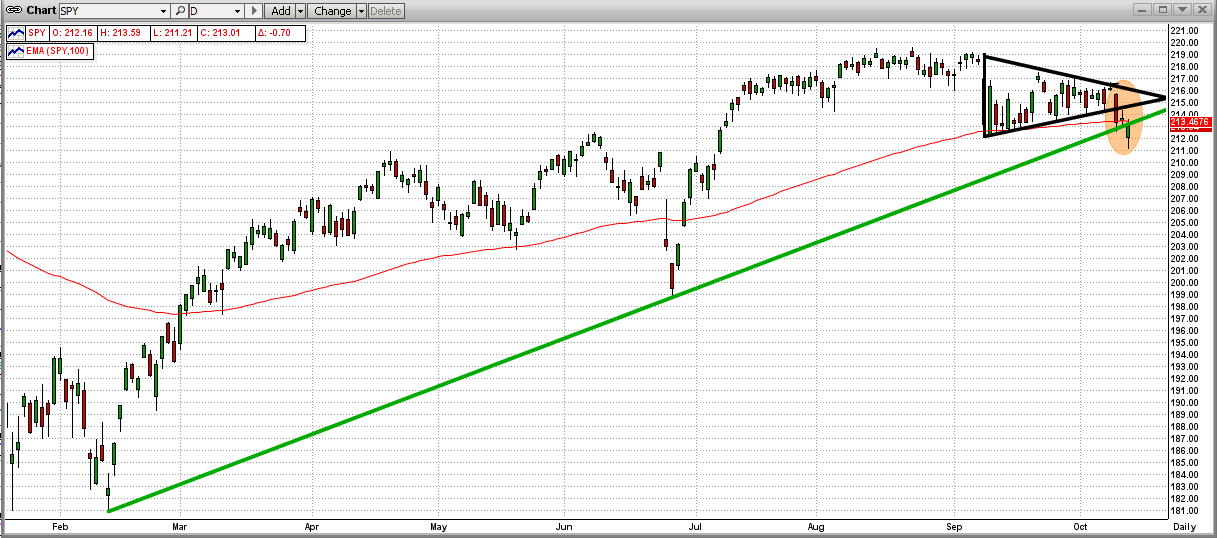
Because of the above, the market has been moving sideways for almost two years, one of the longest periods in U.S. market history. Multiple trillions have traded hands and the market has been flat for almost two years (see the graph below – weekly bars). You will notice that the “break-out” (if you want to call it that) over the last few weeks was weak and seems to be fading out.
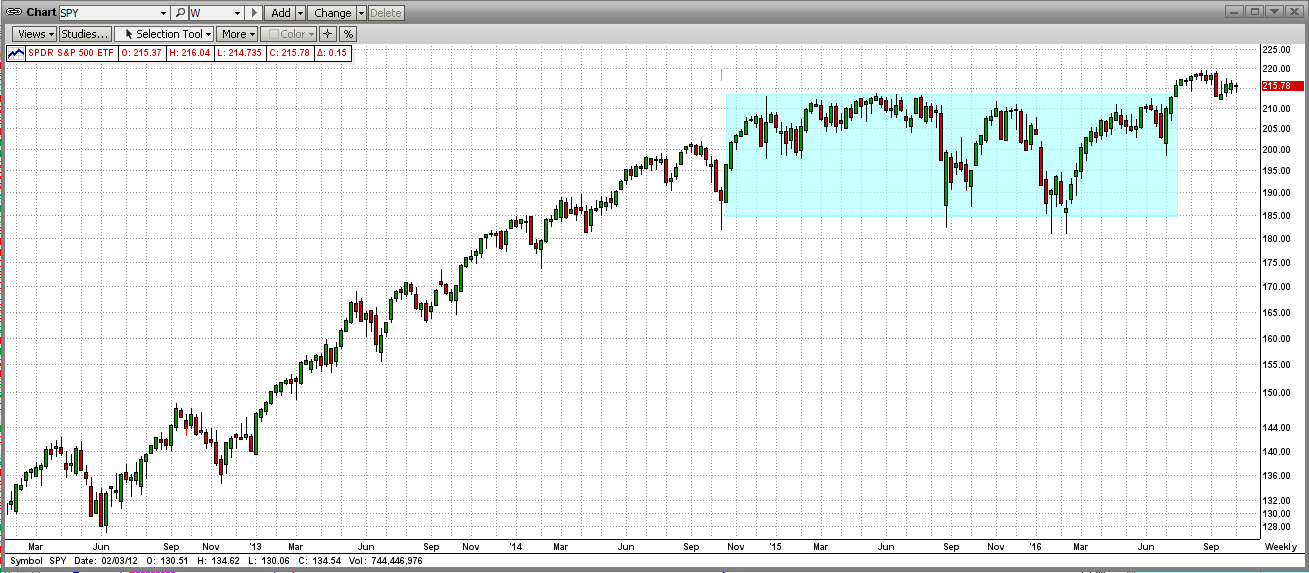
In the past, markets that have been flat at their recent highs for 1-2 years have been in a “topping” pattern, that is, forming a top. The “toppings” in 1999 and 2007 lasted 10-12 months and the topping in 2015-16 has been forming for almost 20 months (see graph below, with monthly bars). Does this mean that the market is ready for the “big drop”? Maybe, but maybe not… read on…
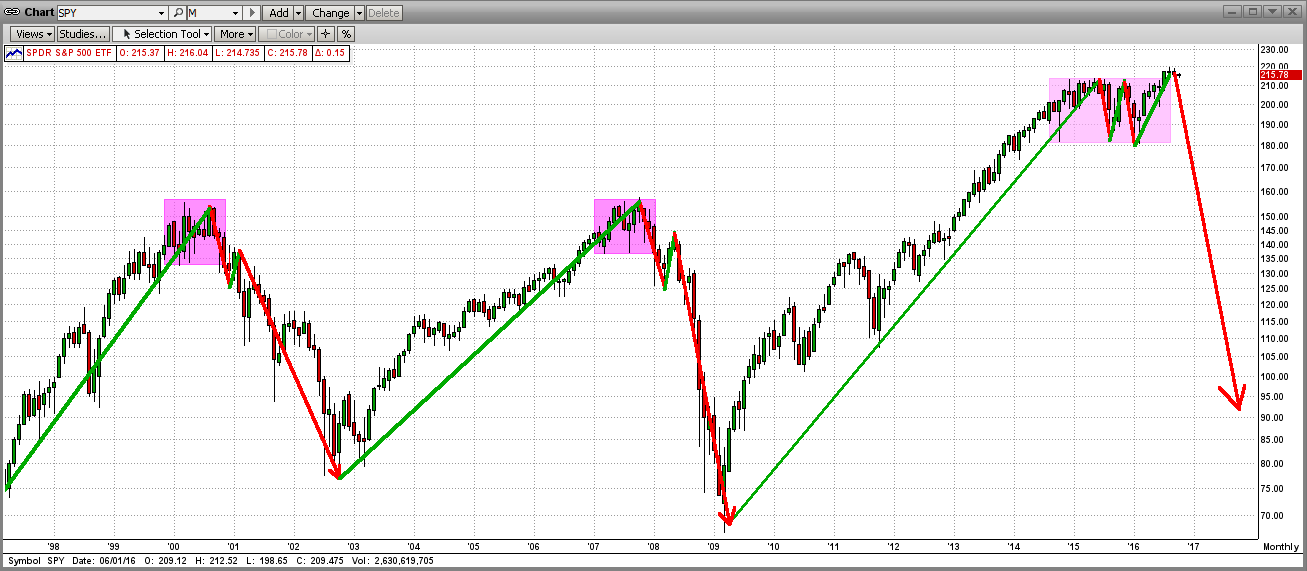
The last stand in the topping process may be happening now. See the “triangle pattern” in the graph below (daily bars). Even though it appears or feels that the market is ready for a dive, any good news for the Fed (like some bad economic or jobs data), could get this market back into the upside breakout mode.
For the last few weeks we have been in this trading triangle, and now this one is coming to an end. In the majority of times, a big market move happens in same the direction as that of the breakout from the triangle pattern itself. Time will tell, and we believe that that time is now upon us. Stay alert…
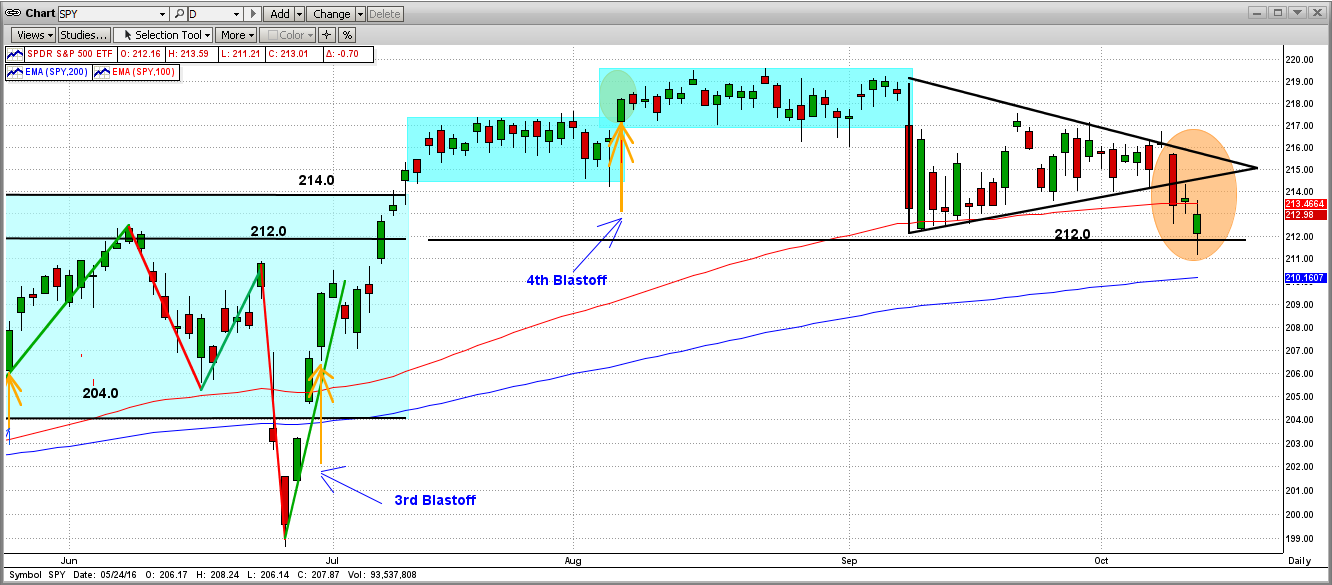
At the very beginning of this year, we released new versions of our MIPS models (Blaster series) that contain new algorithms that greatly reduce the probability of the models getting whipsawed in flat markets. Instead of trying (and failing) to find new trends in flat “trendless” markets, the models will stop trading in flat markets, and either keep the same signal or go to cash until the market starts moving in a definitive direction again.
This was a major project (9 months) that will undoubtedly provide much better results for the users of our models. The performances of the MIPS models YTD are approximate in sync with the performance of the SPY.
|


