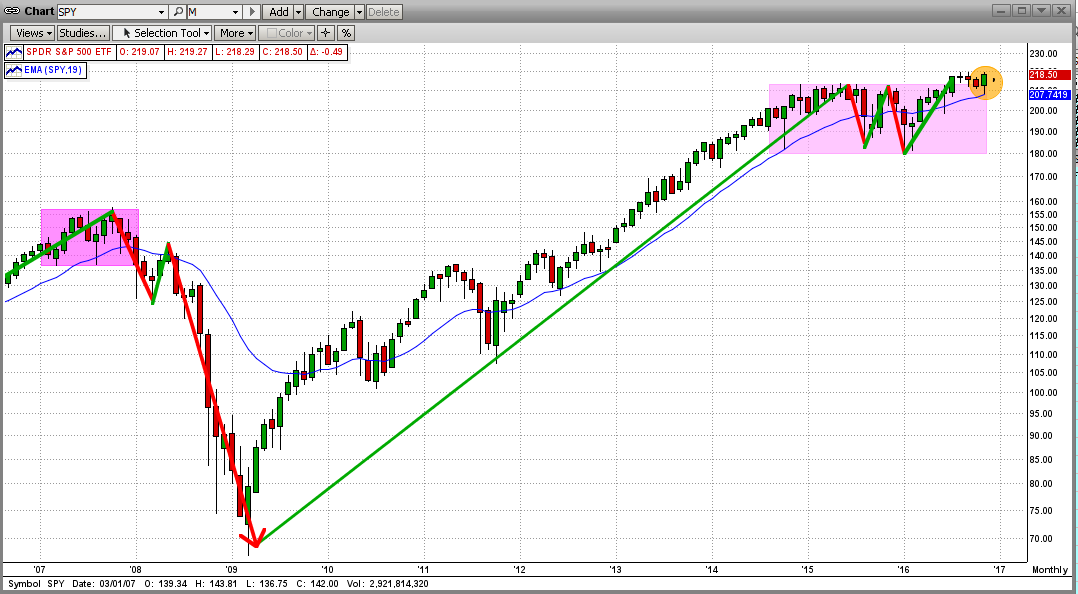
After going sideways for almost two years now, the market could be about to break out to the upside. This is somewhat obvious when we look at the long-term trend in the markets. Keep in mind that the Dow, the NASDAQ, and the Russ2K have already hit new highs. Is the mighty SPY next? Instead of looking at daily graphs now, let's first look at a monthly graph of the SPY (ETF for the S&P500).
In the graph below, you will see that our long uptrend is still in effect, but the SPY has waffled for 2 years (24 monthly bars up-and-down in a tight range), with a rather weak breakout 4 months ago. Usually when this happens, the SPY is "topping" and a crash is imminent; but not always. For example, if the market gets a catalyst that results in a strong rally at a time like this, the bull market can run higher, at least for a few months. Of course, if whatever caused the catalyst is the "real thing", we could see a strong market for a long time. Read on...
Of course, the "catalyst" this time was the surprising Trump victory in the presidential election ("Trexit"). Because of Trump's bold plans for infrastructure spending, bringing "blue collar" jobs back to the good old USA, etc., the Trump win led big investors to rotate their holdings into industrials (like Caterpillar) and financials (like Goldman Sachs) at the expense of the laggards (like utilities). And, this happened very quickly. So far, the buying has continued.
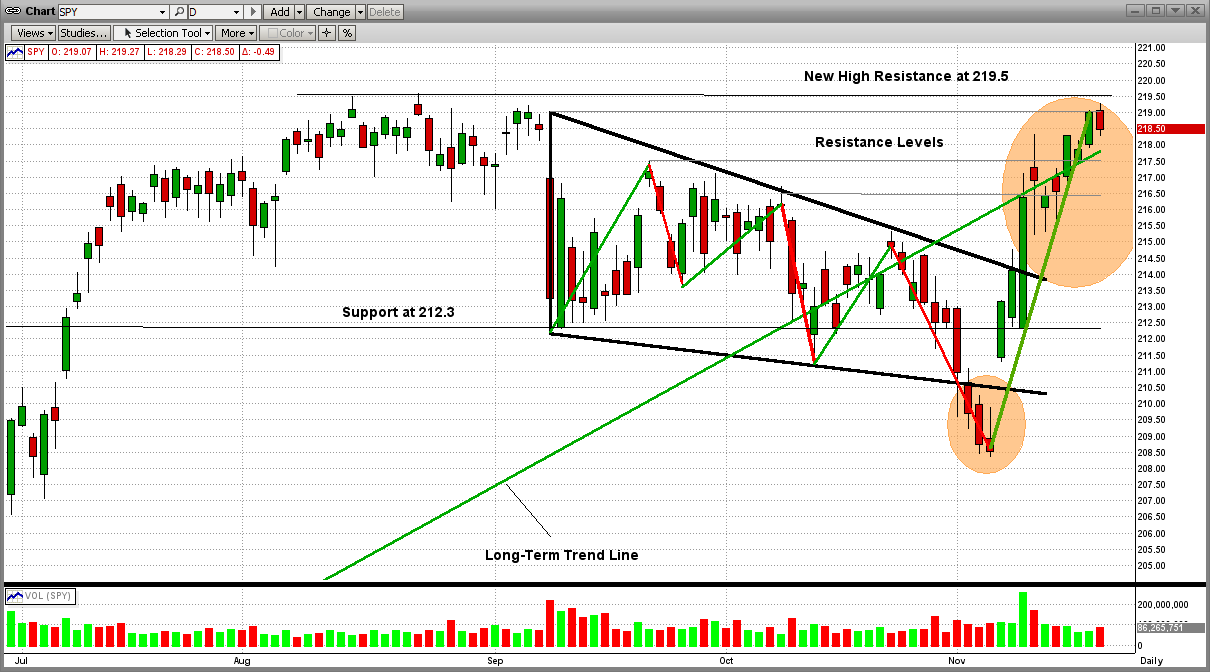
Even with (and maybe because of) the bullish sentiment of, and rally in, the markets in the last few weeks, the market could experience a setback soon. See the next graph below.
The all-time high for the S&P 500 is 2195 (approx 219.5 on the SPY). As you can see, the SPY reached a resistance strong point of 219.0 on Thursday, and got beaten back by the bears lurking there. That was not good, but not overly bearish (yet). Almost surely, the SPY will make another set of "charges" at the strong resistance levels at 219.0-219.5 in the next few days/weeks, and the winner will then be known (bulls or bears).
Keep your eyes fixed on these price levels in the next few days/weeks, while letting MIPS tell you how and when to trade, if at all ... MIPS members can see the current signals for all MIPS models here: http://www.mipstiming.com/current_signals
History has shown that breaking (and staying) in new-high territory is very difficult. On the other hand, if the bulls prevail with a strong break (say on high volume), the sky will be the limit for a while (nice sailing).
Thanks,
Paul Distefano
<<< Contact Info >>>
Paul Distefano, PhD
CEO / Founder
MIPS Timing Systems, LLC
Houston, TX
281-251-MIPS(6477)


