As you know by now, the market's "march to nowhere" continues. As said on CNBC, "The biggest story in the stock market this year has been, well, no story at all." And, according to technical analyst Jonathan Krinsky (MKM Partners), "The Dow hasn't done this in over 100 years."
What has the Dow not done in its history going back to the 1890's? The Dow has never traded in a narrow trading range of less than 6.2% for the first 6 months of any year. We are about 3 weeks short of that record time now, and the Dow's max top-to-bottom range has been about 6.2%. That's a plus-or-minus deviation of 3.1% around its mean-line in 6 months !!!
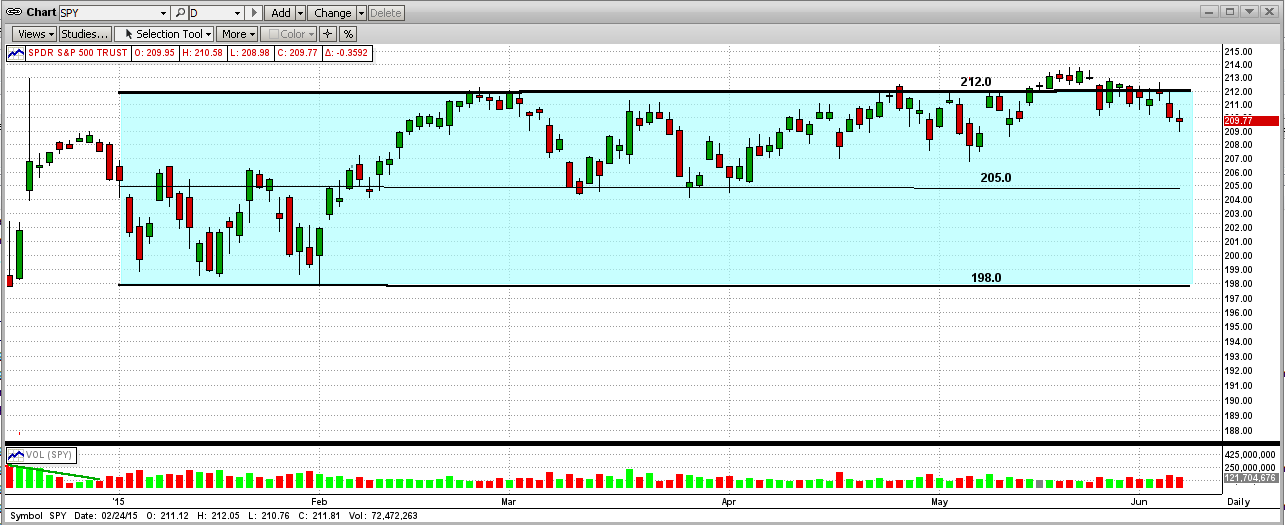
Yes, multiple trillions of dollars have been traded in this time frame with almost no real gains/losses in the indices. Needless to say, that shows a lot of uncertainty. See the graph for the SPY below (with a couple of "fakeout" breakouts).
No one has any idea where this market will go from here, and there are two good cases.
- you need to follow this market daily.
THE BULL's CASE
According to technical analyst Jonathan Krinsky, the Dow has traded in a narrow trading range of 10% (as opposed to 6% now) in the first 6 months of any given year 19 times since 1896. Of these 19 times, almost 70% or the time (13 out of 19), the market ended up higher for the remainder of the year. We have 3 weeks left to go in the 1st 6 months of this year. This market may still have steam, and the little guys could push it much higher with euphoric buying.
THE BEAR's CASE
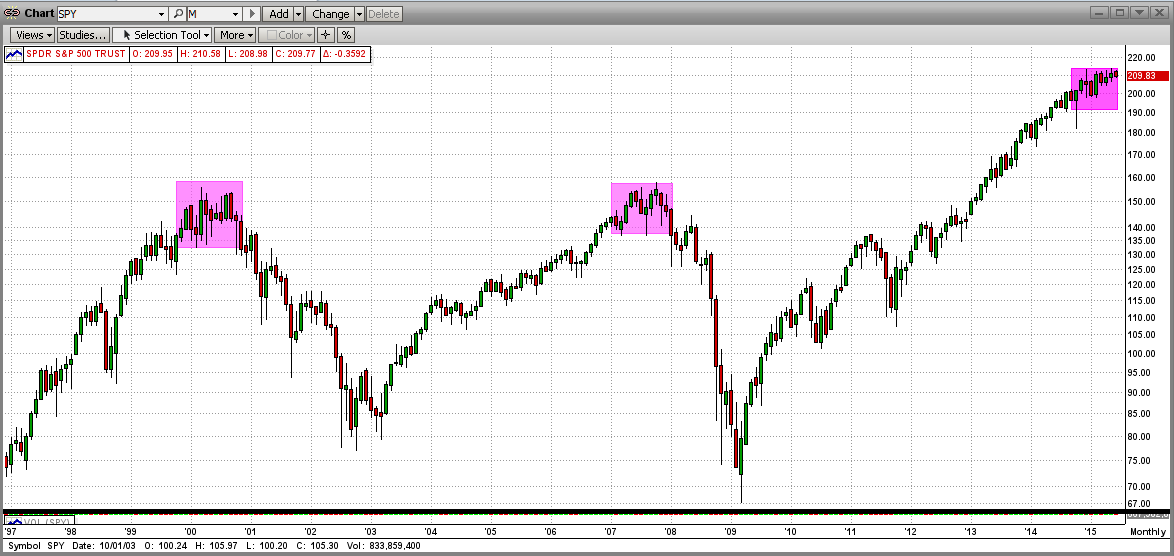
There is a good chance that all of this "flatness" is NOT all about uncertainty, but is part of a "rollover" of this 6.5 year bull market into a full-fledged bear market. Of course, all rollovers are caused by the big guys selling at the top of a bull market (like now), or buying at the bottom of a bear market (like in 2009). At a top, the big guys sell the market down, and the little guys buy the dips right back up to the tops. A "topping" market takes the form of a "rollover" (instead of an immediate "reversal") because it takes the big guys at least 12 months to dump the major part of their portfolios; and then they let the little guys ride it down all the way to the bottom for the umpteenth time. SEE THE GRAPH IMMEDIATELY BELOW. If this indeed what is going on, we only have a few months left, so watch closely.
OUR ADVANTAGE
We can't "go this alone" and try to pick the time that this market is going to crash. We are not smart enough and we do not think fast enough to even come close. We are not going to out-think the mathematics that make up good models and go through even one thousandth of the conditions that the computer can analyze in milliseconds.
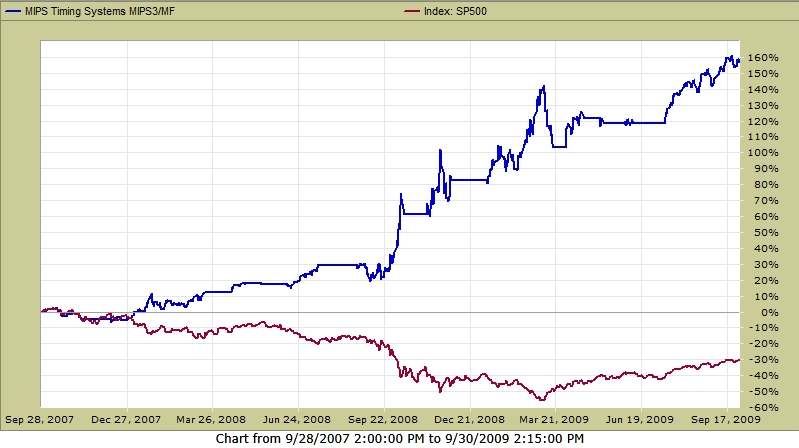
For example, study the graph below (from TimerTrac.com with verified signals) to see how MIPS3 actually traded the SPY in 2008. Who would you bet on: yourself, or MIPS, or some other model that you have not seen successfully handle a market crash? I know how I would answer that question. Stay tuned !!!