Thursday, April 16 2015
Press ? for keyboard shortcuts.
As you know, the MIPS models trade an "average" of about 12 times/year. Of course, this means that the models can trade as many as 16-20 times in some years (like 2008-2009-2010) or as few as 2-4 times in other years (like 2013-2014). This is not by design, it depends upon the number of trend changes (and the volatility) in a given year.
At any rate, we have many MIPS members now who like to trade more often with the MIPS signals. On our website, we have always offered traditional trading ideas under the "services" tab in our main menu. This includes trading ETFs like the SPY, IWM, QQQ, etc., on long signals and their shorts or inverse funds on short signals. We recommend that our traders include a large percentage of SPY in any of their trading profiles because this is what MIPS is based upon. But, a little of the others (up to 50%) is OK. And, for more aggressive investors, we also approve of using some leverage. Our favorite is being long 1.5x SPY on long signals and being short 1.0x SPY on short signals (we do this by investing 50% in SPY and 50% in SSO on long signals, and 100% SH on short signals).
MIPS models (MIPS1, MIPS2, MIPS3 and MIPS4)
Our "Services" section covers the above in detail, and it explains the pros and cons of trading with any of the MIPS trading models. Basically, we highly recommend MIPS4 because it is our newest, best model trading ETF funds on the "next day's Open". But, if you must trade on the "next day's Close" (as in many 401K accounts), we recommend that you use MIPS3. You would only use MIPS2 if you can can't trade (or do not want to trade) over about 6 times/year. Use MIPS1 only if you can trade only 1-2 times/year (not recommended, but still better than buy-and-hold).
FOR AGGRESSIVE TRADERS THAT WANT TO TRADE MORE OFTEN and do not mind some extra effort on their part, we have added a new section to our "Services" page called "AGGRESSIVE TRADING" (this has been added as a blue "button" on the top left of our "Services" page www.mipstiming.com/services ).
Or, YOU CAN READ EXCERPTS OF IT HERE...
STRATEGIC and HIGHER-FREQUENCY TRADING
Even though we DO NOT recommend the strategies below for the average investor, active investors and day traders have shared with us what they have done to produce great results, either by taking more risk or working harder to prepare for higher frequency trades. IN ALL CASES THEY ARE RELYING ON THE MIPS MODELS TO PROVIDE THEM WITH THE DIRECTION OF THE MARKET (and it has done so correctly 65--70% of the time in the last 9 years). Many times, these investors are managing only a portion of their MIPS money with the strategies below, and the rest with the recommended MIPS trading profiles in the "Services" section.
Higher Frequency Trading For Long/Short Investors:
1) Aggressive investors trade more leverage than 1.5x SPY. They may trade:
a) Double leverage (2x) long/short.
b) Triple leverage (3x) long/short (not recommended).
c) Double (2x) or triple (3x) leverage long and single leverage (1x) short.
2) Use the MIPS trends to trade options, futures, etc., "on the money", and renew them until the current trend changes
direction.
3) Follow the trend with MIPS, and rotate "high momentum" individual stocks:
a) Use a "stock screener" (Morningstar, VectorVest, Omni-Trader, etc.) to identify the best 5-10 top performing stocks,
buy them on long signals, and rotate them every day or week or month, depending on how often you want to trade.
b) Ditto the above to short the worst 5-10 performing stocks on short signals, and rotate them every day or week or
month.
4) Ditto #2 immediately above, but with "high momentum" ETFs instead of with individual stocks.
5) Trade the "hottest sectors" in the S&P 500 (instead of all sectors, which are included in the Index and the SPY):
a) On long signals, buy the top performing 3-4 S&P 500 Sectors (like maybe technology, health care, financials, etc.),
and rotate them every week or month.
b) on short signals, short the worst performing 3-4 S&P 500 Sectors (like maybe energy, industrial, materials), and
rotate them every week or month.
6) Most of us know Pareto's Principle as the 80-20% Rule. It implies that, in general, 80% of the effects come
from 20% of the causes (Google it). For the stock market, Marty Chenard from www.stocktiming.com coined
the 70-20-10% Rule. He proposed that 70% of your success in trading depends upon your trades being
"in sync" with market movements/trends (long in up markets, etc.); 20% depends upon you being in the right
sectors at the right time; and the remaining 10% depends upon the stocks that you buy in these sectors.
To implement this methodology, we propose that you follow the steps below:
i.) MIPS - the first part of your success should come from MIPS correctly identifying up/down trends
(you want to be long on uptrends; short on downtrends; and in cash on flat/sideways trends).
ii.) Hot Sectors in #5 above - The second part should come from your picks of the top 2-3 Hot Sectors as described, and
iii) High Momentum Stocks/ETFs in #3 or #4 above - The last part should come from trading the top 2-3 "High Momentum"
stocks or ETFs in each sector from ii.) above.
Of course, in down markets, you would do the inverse (look for the worst sectors, stocks, ETFs).
--------------------
Many of the above strategies can greatly increase the number of trades with MIPS signals without violating the trend. If MIPS identifies the trends correctly (which it has done very well in the last 9 years), and if MIPS members are willing to put in the extra effort, they could possibly make more $'s with the above trading strategies than by simply holding 1-3 positions (long or short) the entire signal life of every trade.
We do not track or report the performance of any of the above strategies.
Sunday, April 12 2015
Press ? for keyboard shortcuts.
Talk about "A Market Going Nowhere, Fast" - you have just witnessed one. For the last FIVE MONTHS, the SPY has traded in a rather tight trading range of plus-and-minus 3.5% around the mid-line of a price range between 197.9 and 212.2 (see graph below). And, the SPY has experienced 12 short-term trend changes in this time period (if you can call them that). Even more remarkable is that, with all of these "wild" changes, the SPY on 3/31/15 was only 0.43% higher than it was on 12/31/14.
This has been a VERY volatile market. For example, the Dow experienced 16 days of triple-digit moves in March alone (that's 16 triple-digit days out of 22 trading days, or 73% of the days). These 16 triple-digit days accounted for 3,149 "swing" points for the Dow, and yet it closed less than 2% higher for the month.
The stock market continually experiences flat or sideways markets (aka "consolidation patterns"), but they rarely last 5 months. This one is long in the tooth. The stats show that: (a) most of the time the market breaks out of the pattern in the direction from which it came in (up in our case) and (b) the longer the time frame of the sideways pattern, the bigger the following breakout move is.
Obviously, this market has no short-term trend or direction now (other than flat-as-a-pancake), but the long-term trend is still up. The next few days are vital. In order for the bulls to keep running, the SPY must break above the strong resistance at 212.2 (its all-time high) with some degree of strength. If that does not happen in a relatively short period of time, the bears may get rejuvenated and may finally push this market down big, at least a "correction" if not the "big one".
One positive aspect of a long-term sideways pattern is that MIPS usually gets set to "trigger" faster after being "flat" for over 100 days (think of what that does to 20-50-100 day EMAs). Because of moves like this (or lack thereof), a small change can look big to MIPS after months of plus-and-minus 3%.
Until further notice, we are still bullish, mainly because the long-term trend is still up. No matter what, we will be waiting for the MIPS models to provide our future guidance (as usual). Stay tuned...
Tuesday, April 07 2015
Press ? for keyboard shortcuts.
Here we go again... "Bad Economic News = Good Market News"
Getting kind of old, isn't it? But, at least, it is very predictable.
Again, with the terrible new jobs report, the market reacted to what it thought Aunt Janet would think, instead of the ramifications of the bad news on our economy. This can't go on forever, but it can as long as the Fed supports it. Remember, the Fat Kats like the Fed's free money (actually our money); and they will do whatever they can to keep it rolling, like supporting the up market up to make Yellen look good and to keep her in line.
The good news for us is that the SPY bounced off of its 100-day EMA to the upside again today. See the orange ellipses in the graph below. This is the 3rd time this has happened in the last 3 weeks, but this will not continue to go on much longer.
If the SPY is going to break out of its very long "No-Man's-Land" pattern at 209, and challenge its all time high at 212.2 again, it needs to keeps going up from here. A fail here would not be good. I think that it will, but I trust MIPS' guidance much more than my own. So, we wait again. Stay tuned...
Press ? for keyboard shortcuts.
<<< Previous Blog >>>
The only good news that I could muster up out of the last 2-3 weeks of "market noise" was that:
1) the Fed is still "dovish" with regard to raising interest rates,
2) the Fed still "rules",
3) relatively low volume says that it was not the Fat Kats causing last week's minor sell-off,
4) the SPY closed up above its 100-day EMA in the last two "attacks", and
5) this sideways trading pattern is getting "long in the tooth".
From this, one could expect a market bounce-back going forward, if not an SPY run-up to above $209. But, of course, it's anybody's guess from here, so let's simply follow MIPS' advice. Stay tuned !!!
BTW, these "sideways trading patterns" do not last forever. Many times, they break out in the same direction that they went in (up, in this case). And, the longer the time in a sideways pattern, the bigger the market move after the breakout.
Monday, March 30 2015
Press ? for keyboard shortcuts.
The only good news that I could muster out of the last 2-3 weeks of "market noise" was that:
1) the Fed is still "dovish" with regard to raising interest rates,
2) the Fed still "rules",
3) relatively low volume says that it was not the Fat Kats causing last week's minor sell-off,
4) the SPY closed up above its 100-day EMA in the last two "attacks", and
5) this sideways trading pattern is getting "long in the tooth".
From this, one could expect a market bounce-back going forward, if not an SPY run-up to above $209. But, of course, it's anybody's guess from here, so let's simply follow MIPS' advice. Stay tuned !!!
BTW, these "sideways trading patterns" do not last forever. Many times, they break out in the same direction that they went in (up, in this case). And, the longer the time in a sideways pattern, the bigger the market move after the breakout.
ress ? for keyboard shortcuts.
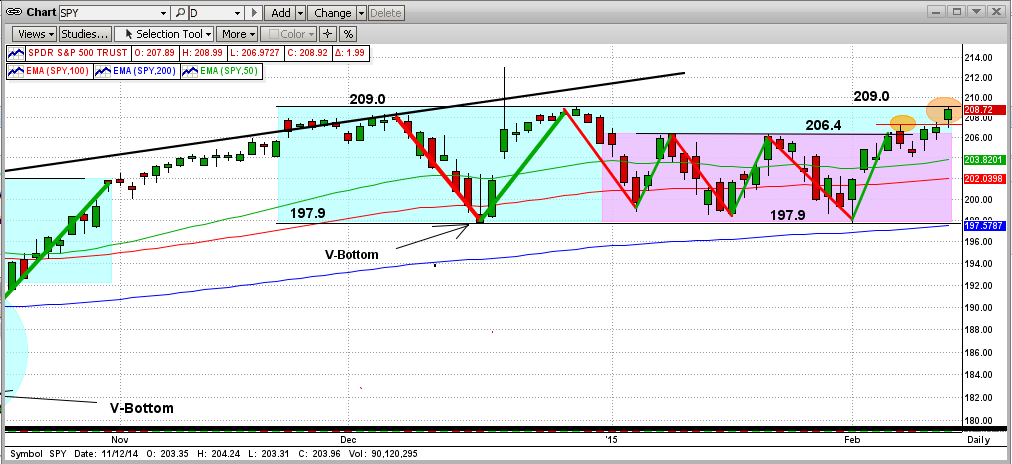
In mid-February, the market (the SPY) broke out of its sideways trading pattern ("No-Man's-Land") and headed to what one might have thought was a new uptrend. As always, however, the market had its own view on what it was going to do, and it does as it wants. As we all know, starting on March 1st, the market stalled and waffled for a few days.
Then, the SPY got slapped back into No-Man's-Land, with a big drop on 3/06/2015. Ironically, the catalyst for this big drop was "too good" economic news, after a surprisingly good new jobs report and shrinking unemployment. Of course, good economic news should be good for the market, and it ultimately will be. But, this was mitigated away by "fear" of the Fed raising interest rates in June or September, which "overcame" the good economic news because it "MIGHT" affect the Fed's actions months from now. From my experience, these "knee-jerk" reactions to what might happen bad in the future that could trump positive results that have already happened, usually fizzles out within a few days. And this is exactly what happened today (3/12/15). I must add that today's positive move was also aided by the "cooling off" of recent gains in the value in the dollar.
In the graph below (right-most orange circle), you will see that the SPY "held its ground" and bounced off of its 200-day EMA at $204.4 on 3/11/15; and then it climbed all the way back above its 50-day EMA to close at $207.1 today (3/12/15). I personally believe the market will go up from here, at least to again test the upside resistance at $209 on the SPY. What happens after that is anybody's guess, but MIPS will be watching closely for us. Stay tuned...
Sunday, March 15 2015
C O N F ID E N T I A L
From Paul D.
- this is simply my opinion/observation and it has nothing to do with our MIPS models...
Expect a market crash before August 2015 !!!
In the graph below, you will see that it took 10-12 months of sideways trading for the market (the SPY) to "top out" in both 1999-2000 and in 2007-2008.
My opinion is that this is roughly how long it takes for the big guys (Goldman Sachs, Morgan Stanley, UBS, etc.) to liquidate the holdings that they want to dump at the top (call me and I will explain this). For example, it would take months for a big guy to sell 100 million shares each of GE and Walmart and Merck, etc., without driving their prices through the floor. And, at the top, they hold 1,000's of positions just like that.
In the graph below, you can see that in 2014-2015 the market has basically traded sideways for 6 full months through February 2015, or 7 months counting March 2015. So, after 7 months in this sideways trading pattern, if the market stays in this relatively flat range for a few more months (highly likely), I believe that a Big Crash will come in July or August 2015 (most likely July 2015). If not, we could see the S&P 500 at $2500 or higher before the big crash finally comes.
This definitely does not mean that the MIPS models see the market the same way that I do (thankfully), so let's be patient while the market makes up its mind and MIPS follows it. Stay tuned ...
Thursday, March 12 2015
In mid-February, the market (the SPY) broke out of its sideways trading pattern ("No-Man's-Land") and headed to what one might have thought was a new uptrend. As always, however, the market had its own view on what it was going to do, and it does as it wants. As we all know, starting on March 1st, the market stalled and waffled for a few days.
Then, the SPY got slapped back into No-Man's-Land, with a big drop on 3/06/2015. Ironically, the catalyst for this big drop was "too good" economic news, after a surprisingly good new jobs report and shrinking unemployment. Of course, good economic news should be good for the market, and it ultimately will be. But, this was mitigated away by "fear" of the Fed raising interest rates in June or September, which "overcame" the good economic news because it "MIGHT" affect the Fed's actions months from now. From my experience, these "knee-jerk" reactions to what might happen bad in the future that could trump positive results that have already happened, usually fizzles out within a few days. And this is exactly what happened today (3/12/15). I must add that today's positive move was also aided by the "cooling off" of recent gains in the value in the dollar.
In the graph below (right-most orange circle), you will see that the SPY "held its ground" and bounced off of its 200-day EMA at $204.4 on 3/11/15; and then it climbed all the way back above its 50-day EMA to close at $207.1 today (3/12/15). I personally believe the market will go up from here, at least to again test the upside resistance at $209 on the SPY. What happens after that is anybody's guess, but MIPS will be watching closely for us. Stay tuned...
Hope this helps !!!
<<< Previous Blog >>>
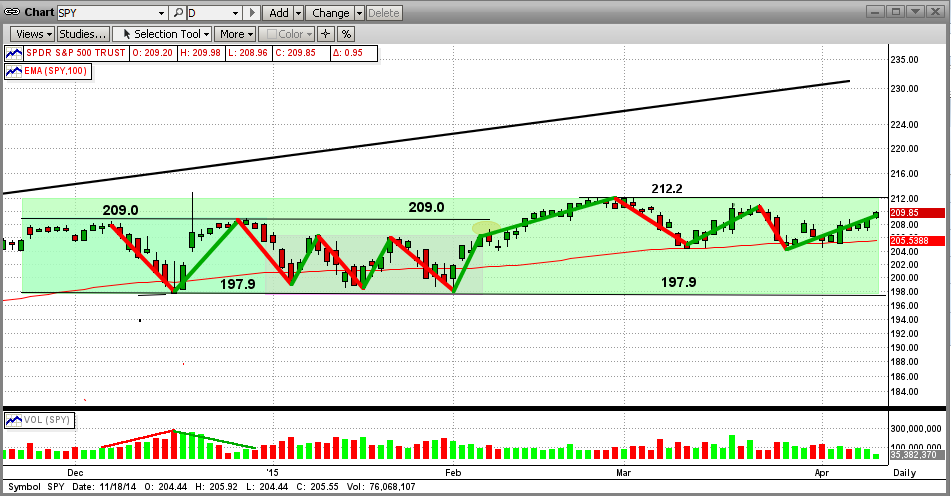
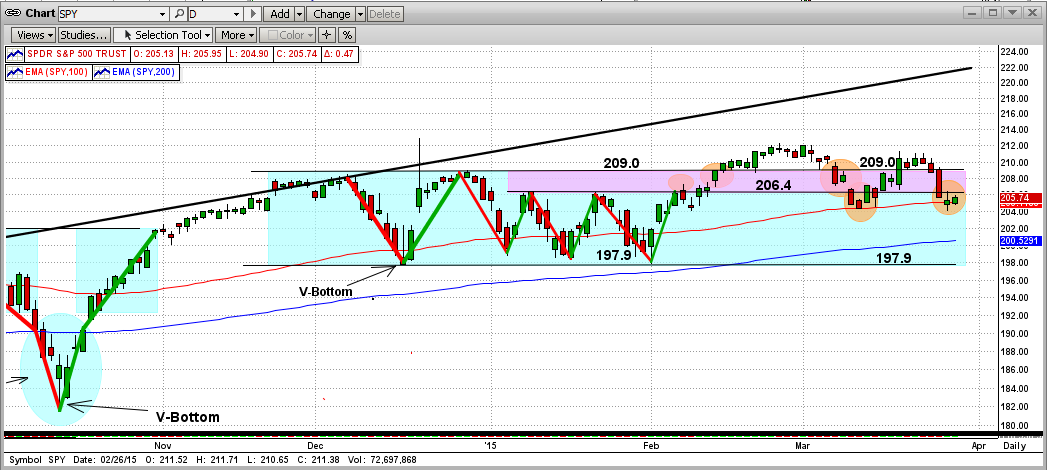
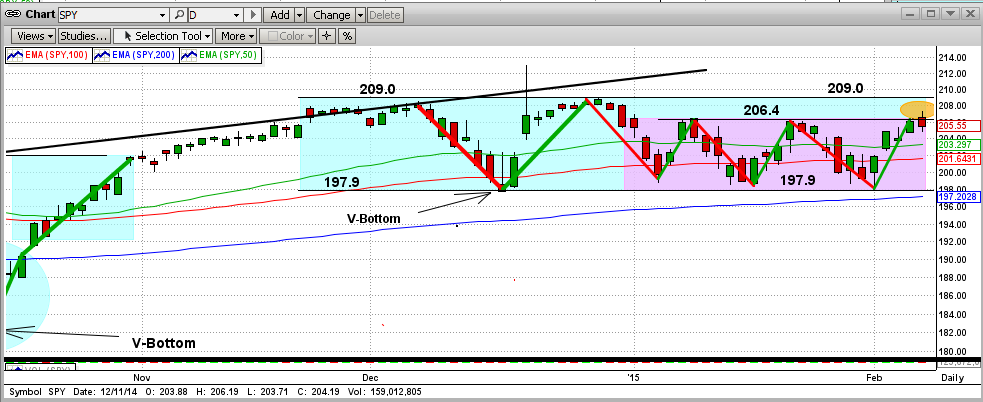
From the graph immediately below at today's close, you will see that the advancing forces (the Bulls) made their way up across the battlefield (pink space) from 197.9 to the beginning of No-Man's-Land at 206.4, with little or no resistance.
Then, they carried on through the "moat" around the castle (blue space) in No-Man's-Land in short order, with few set-backs. But, the Bears "stalled" them at the castle wall today, right at the 209.0 level (see the right-most orange circle in the graph). BTW, the 209.0 resistance level is the SPY's all-time-high, and hence, could provide ultra-resistance.
The last time the market charged the castle's wall, the upside resistance was at 189.0 (2nd graph below). it took nine charges to break out of No-Man's-Land, and it did so to the upside.
In order for the Bulls to feel comfortable now, any break to the upside from here needs to be dramatic. Otherwise, we may experience a Bear provided trip back down to 197.9, or lower (no free ride).
Let's keep watching, but let's wait for MIPS to tell us what to do next !!!
- Stay tuned...
Friday, February 20 2015
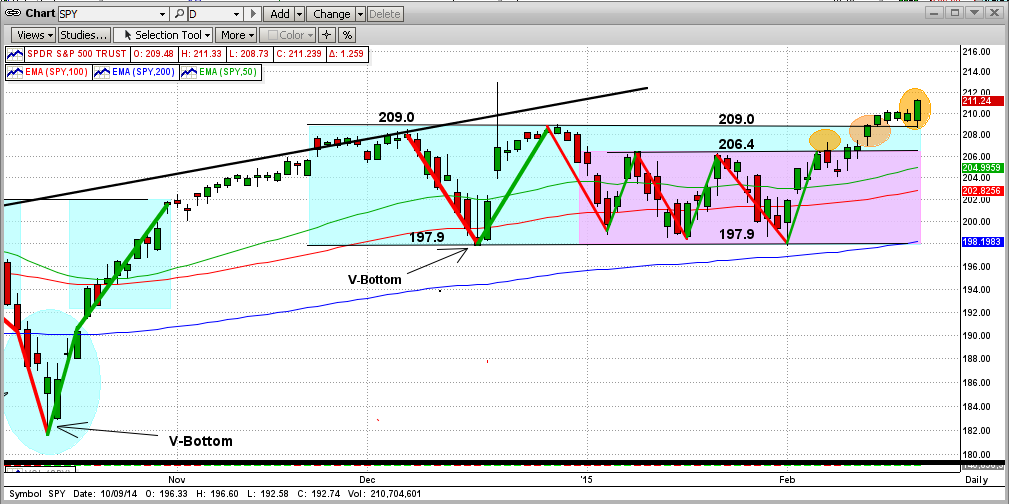
In our previous blog, we talked about a stalemate at the wall of the Bear's castle (SPY resistance at $209), just over the "moat" in No Man's Land (see 2nd graph below from previous blog). This was the 5th time that the Bulls had advanced up toward the Bears' front line, after having been beaten back in the previous 4 attempts.
But, four days ago (2/13/15), the Bulls prevailed and the SPY broke $209 to the upside. At that time, we said the Bulls needed to show some strength and "staying power" by: (1) trading above $209 for at least a few days, and then (2) making a dramatic "power move" up soon thereafter. Well, today the Bulls did both (see the graph immediately below). [Look how similar the breakout immediately below is to the breakout from the last sideways trading pattern in May'14, as shown in the 3rd graph below.]
This seems to indicate a move higher from here. All of the MIPS models are (and have been) long, and we expect them to remain that way. OOOppppsss, here I go again... predicting what MIPS will do. Much better to wait for MIPS to tell us what to do. Stay tuned !!!
<<< Previous Blogs >>>
MIPS Members:
From the graph immediately below at today's close, you will see that the advancing forces (the Bulls) made their way up across the battlefield (pink space) from 197.9 to the beginning of No-man's-Land at 206.4, with little or no resistance.
Then, they carried on through the "moat" around the castle (blue space) in No-Man's-Land in short order, with few set-backs. But, the Bears "stalled" them at the castle wall today, right at the 209.0 level (see the right-most orange circle in the graph). BTW, the 209.0 resistance level is the SPY's all-time-high, and hence, could provide ultra-resistance.
The last time the market charged the castle's wall, the upside resistance was at 189.0 (2nd graph below). It took nine charges to break out of No Man's Land, and it did so to the upside.
In order for the Bulls to feel comfortable now, any break to the upside from here needs to be dramatic. Otherwise, we may experience a Bear provided trip back down to 197.9, or lower (no free ride).
Let's keep watching, but let's wait for MIPS to tell us what to do next !!!
- Stay tuned...
================================
<<< Previous Blog >>>
MIPS Members:
Re: Please glance at the two links below
1) http://mipstiming.com/blog/view/7781/the_market_battle_in__no_man_s_land___2014
2) http://mipstiming.com/blog/view/7848/_the_market_battle_in__no_man_s_land___2014____bulls_win_
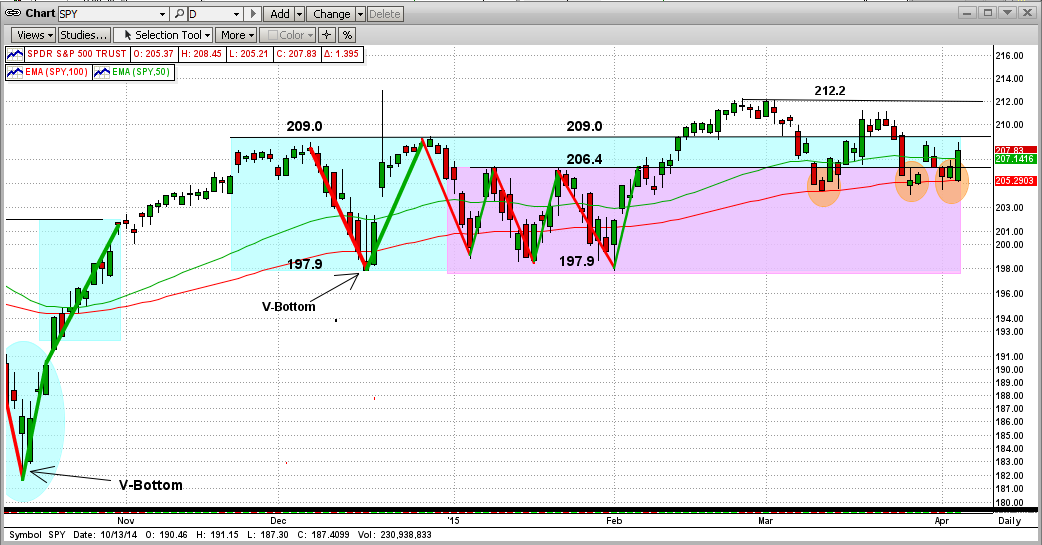
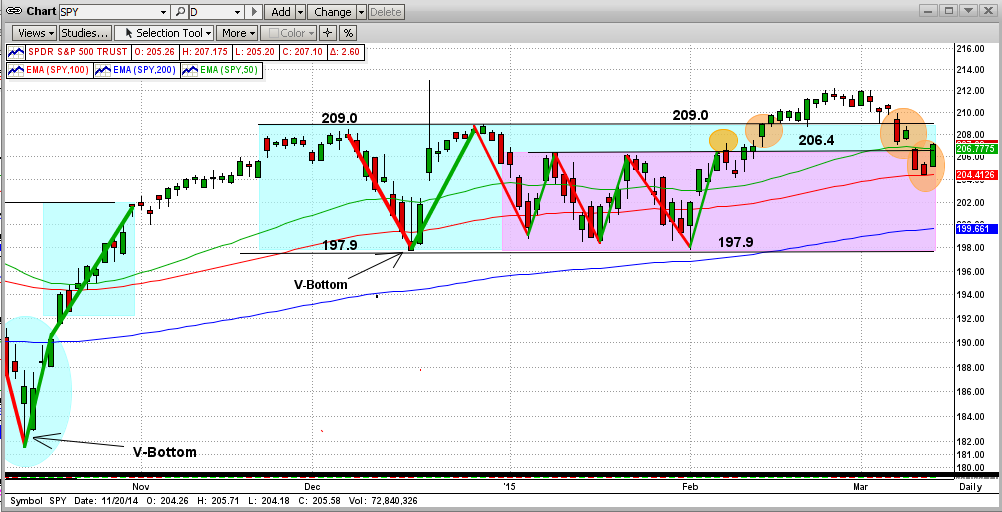
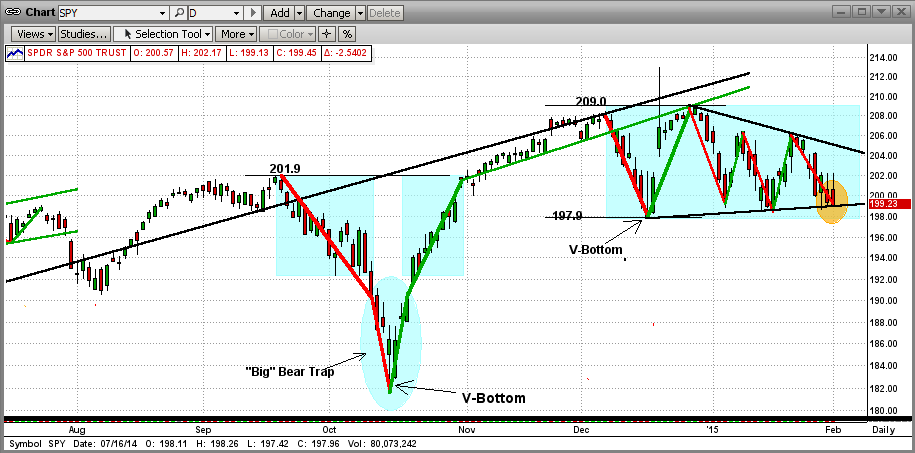
Most of you are familiar with flat/sideways patterns that develop into what I call "No Man's Land". No Man's Land is a piece of the graph where the price (say of the SPY) gets very close to a resistance level (to the upside from below) or support level (to the downside from above) and repeatedly fails to break above resistance levels or below support levels. The market can "play" in No Man's Land for months.
Ultimately, the market (SPY) breaks out of No Man's Land above or below, and makes a significant move in the direction in which it broke out of the sideways pattern. The last time this happened is shown in the graph below. It shows the cyclic price action of the SPY between Mar-May 2014 and the breakout in late May'14. You will see that "the breakout" did not happen until the 7th attempt by the SPY to break to the upside. (Lots of dead bodies and broke traders that trade in these sideways trading patterns.)

Hope this helps !!!
Thursday, February 12 2015
From the graph immediately below at today's close, you will see that the advancing forces (the Bulls) made their way up across the battlefield (pink space) from 197.9 to the beginning of No Man's Land at 206.4, with little or no resistance.
Then, they carried on through the "moat" around the castle (blue space) in No-Man's-Land in short order, with few setbacks. But, the Bears "stalled" them at the castle wall today, right at the 209.0 level (see the right-most orange circle in the graph). BTW, the 209.0 resistance level is the SPY's all-time-high, and hence, could provide ultra-resistance.
The last time the market charged the castle's wall, the upside resistance was at 189.0 (2nd graph below). It took nine charges to break out of No Man's Land, and it did so to the upside.
In order for the Bulls to feel comfortable now, any break to the upside from here needs to be dramatic. Otherwise, we may experience a Bear provided trip back down to 197.9, or lower (no free ride).
Let's keep watching, but let's wait for MIPS to tell us what to do next !!!
- Stay tuned...
================================
<<< Previous Blog >>>
Re: Please glance at the two links below
1) http://mipstiming.com/blog/view/7781/the_market_battle_in__no_man_s_land___2014
2) http://mipstiming.com/blog/view/7848/_the_market_battle_in__no_man_s_land___2014____bulls_win_
Most of you are familiar with flat/sideways patterns that develop into what I call "No Man's Land". No Man's Land is a piece of the graph where the price (say of the SPY) gets very close to a resistance level (to the upside from below) or support level (to the downside from above) and repeatedly fails to break above resistance levels or below support levels. The market can "play" in No Man's Land for months.
Ultimately, the market (SPY) breaks out of No Man's land above or below, and makes a significant move in the direction in which it broke out of the sideways pattern. The last time this happened is shown in the graph below. It shows the cyclic price action of the SPY between Mar-May 2014 and the breakout in late May'14. You will see that "the breakout" did not happen until the 7th attempt by the SPY to break to the upside. (Lots of dead bodies and broke traders that trade in these sideways trading patterns.)
What does the above have to do with today?
The market (SPY) now seems to be in a "repeat" of the above (see graph below). This most recent sideways trading pattern is the SPY price between $197.9 and $209.0 (about 5.6%), with a "No Man's Land" space between 206.4 and 209.0 (blue space above pink space in graph). Friday was SPY's 5th run on the 209.0 resistance level, and its 3rd attempt to move back into No Man's Land. On Friday, the SPY stuck its nose into No Man's Land, only to be slapped back to close below it (this may indicate another drop back to the 197.9 support level, but the SPY could reverse itself and make another charge on the high point (209.0). Obviously, the next few days/weeks will be vital to the future direction in the market.
It's a good thing that we do not have to decide what to do now, as that is MIPS' job. So, stay tuned.
- New subscribers may want to wait a few days to see what the SPY does relative to the graph below before taking
a long position right away.
Hope this helps !!!
Monday, February 09 2015
Re: Please glance at the two links below
1) http://mipstiming.com/blog/view/7781/the_market_battle_in__no_man_s_land___2014
2) http://mipstiming.com/blog/view/7848/_the_market_battle_in__no_man_s_land___2014____bulls_win_
Most of you are familiar with flat/sideways patterns that develop into what I call "No Man's Land". No Man's Land is a piece of the graph where the price (say of the SPY) gets very close to a resistance level (to the upside from below) or support level (to the downside from above) and repeatedly fails to break above resistance levels or below support levels. The market can "play" in No Man's Land for months.
Ultimately, the market (SPY) breaks out of No Man's Land above or below, and makes a significant move in the direction in which it broke out of the sideways pattern. The last time this happened is shown in the graph below. It shows the cyclic price action of the SPY between Mar-May 2014 and the breakout in late May'14. You will see that "the breakout" did not happen until the 7th attempt by the SPY to break to the upside. (Lots of dead bodies and broke traders that trade in these sideways trading patterns.)
What does the above have to do with today?
The market (SPY) now seems to be in a "repeat" of the above (see graph below). This most recent sideways trading pattern is the SPY price between $197.9 and $209.0 (about 5.6%), with a "No Man's Land" space between 206.4 and 209.0 (blue space above pink space in graph). Friday was SPY's 5th run on the 209.0 resistance level, and its 3rd attempt to move back into No Man's Land. On Friday, the SPY stuck its nose into No Man's Land, only to be slapped back to close below it (this may indicate another drop back to the 197.9 support level, but the SPY could reverse itself and make another charge on the high point (209.0). Obviously, the next few days/weeks will be vital to the future direction in the market.
It's a good thing that we do not have to decide what to do now, as that is MIPS' job. So, stay tuned.
- New subscribers may want to wait a few days to see what the SPY does relative to the graph below before taking
a long position right away.
Hope this helps !!!
Sunday, February 01 2015
The market is at a critical point...
The daily charts and the monthly charts are both telling us this. Where the market goes from this "Critical Point" is very important and its anybody's guess. But, let's not "guess"... let's depend upon MIPS to tell us what to do !!!
DAILY VIEW
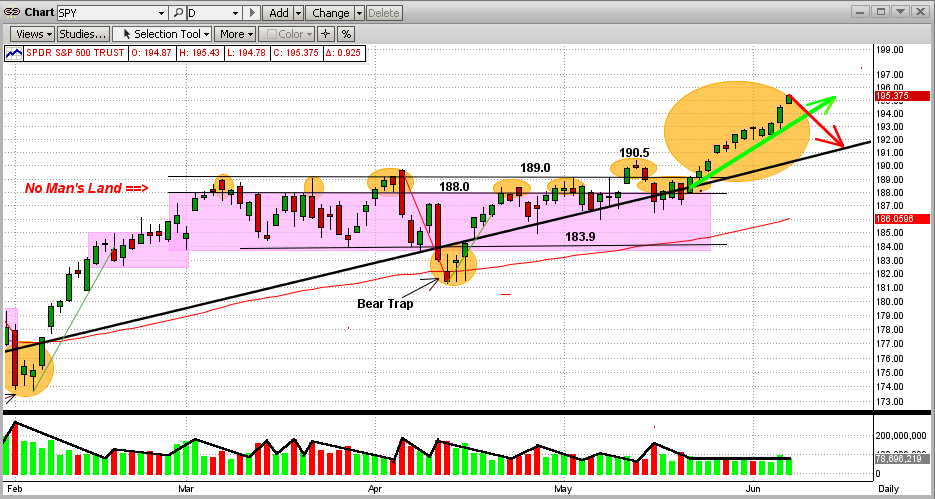
In our last blog, we showed what could be the market "topping". However, we also pointed out that it can take 10 months of "topping" before we experience a big Crash. What happens in the interim is also very important because a market crash is not obligated to "wait" 10 months to happen. The graph immediately below shows the trading of this crazy, volatile market in the last 2 months. It can be looked upon simply as erratic, but we see a "pennant" formation with the SPY at a Critical Point on the bottom edge of the formation (orange ellipse on the top right). A drop from here could be significant, but it would not necessarily mean that the drop would have to be the real "biggie".
MONTHLY VIEW
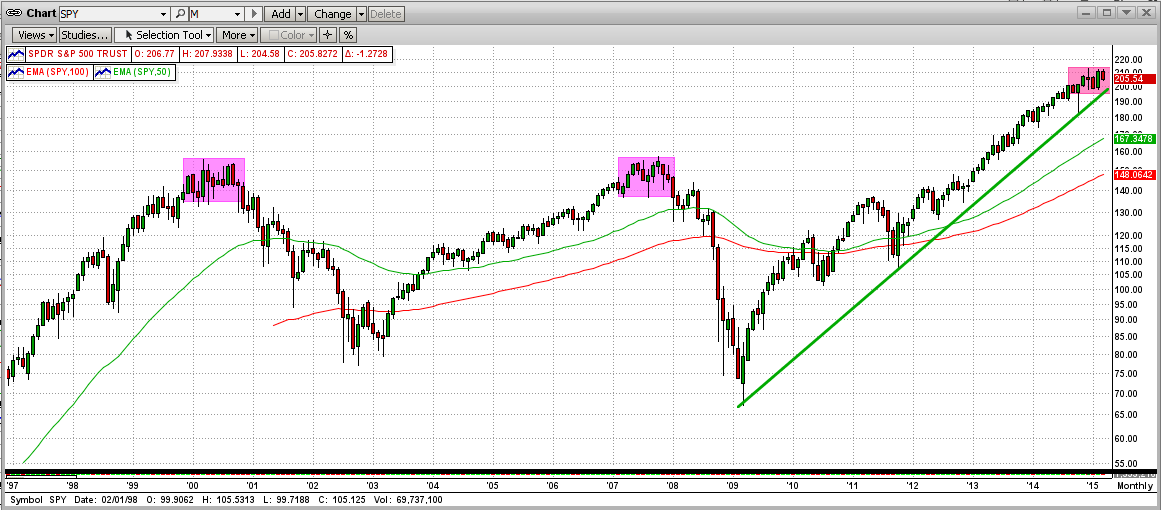
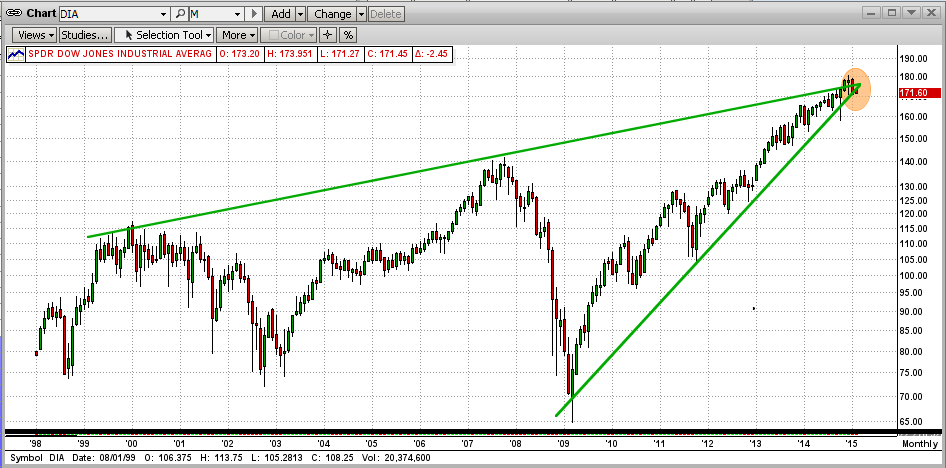
Now let's look at the price action of the DOW from a monthly viewpoint from 2000-2014 (graph below). This shows another reliable formation that basically says "Whichever way the market (in this case, the Dow) breaks out from here will most likely define its direction (up or down) for some time to come. And, as you can see, the market is almost 100% at that Critical Point. The next few days/weeks will be CRITICAL !!!
Stay tuned, and keep watching the MIPS signals. Remember, the market could break up from here and resume its powerful, six-year bull trend. But, if (or when, to be more accurate) the big drop comes, MIPS should call it in ample time for us to make sizeable gains in the crash.
|