Over the last few weeks/months, we have been asked many times,
1) Why is the recent MIPS trading frequency so low, and
2) Will the MIPS models react fast enough to catch real "market crashes" ??
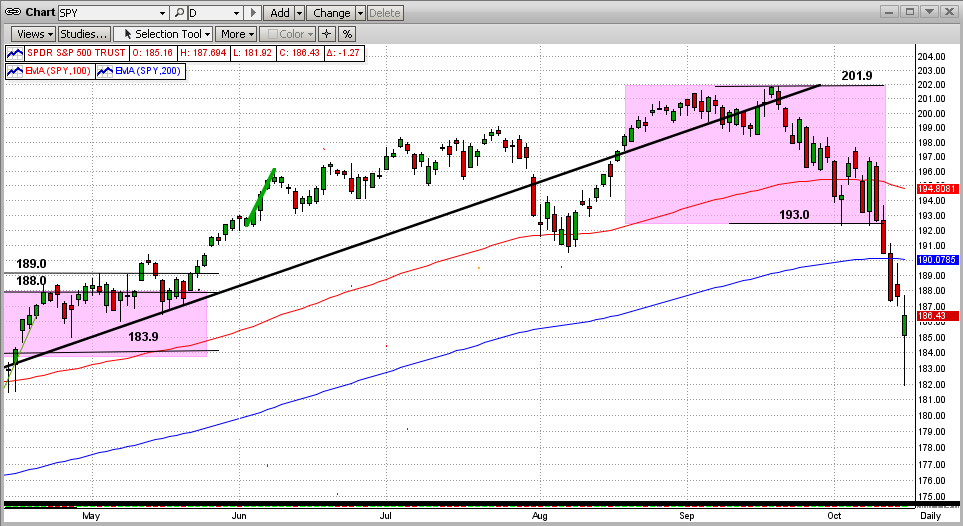
First, the past trading history for the MIPS3 and MIPS4 models has been about 10-18 trades/year. But, the trading frequency of the MIPS models in the last two years has been the very lowest in the nine-year history of any of the MIPS models. This is basically because the market has been so strong recently (very strong up-trend) that it will take a lot of negative market action to get the MIPS models to change their direction. For example, when the market is lackadaisical, MIPS3 or MIPS4 may change direction with a 2-4% market dive, but at other times (like now) when the market has been super strong, even a 9% dive was not enough to get the MIPS models to change direction. In other words, the resistance of the MIPS models to a market change is somewhat "relative". Its kind of like comparing the condition of a really strong, healthy young man that falls off of a high cliff while hiking to the condition of his grandfather who fell of the same cliff at the same time. Most likely, the strong young man would be in a better condition a few days after the accident. [Of course, there are hundreds of other factors that determine a MIPS change, so don't just bank on "relative" changes.]
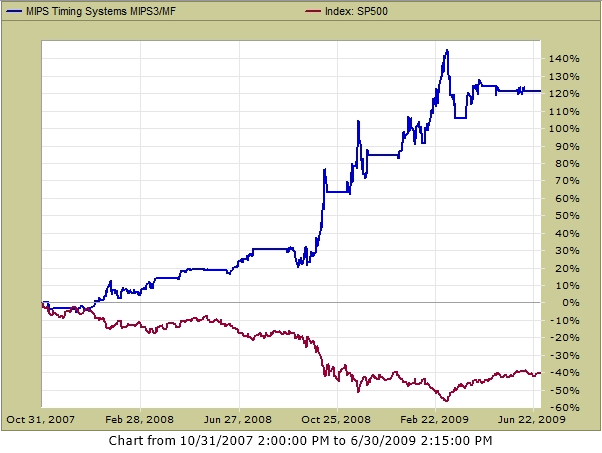
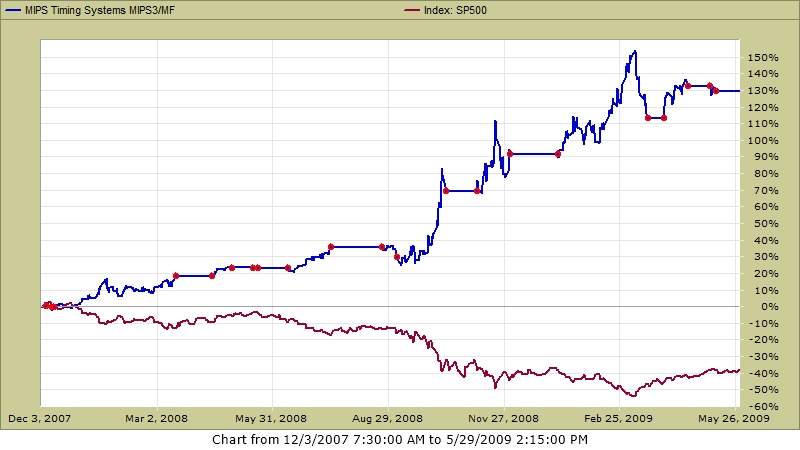
Second, the only real "live" experience we have with market crashes in the U.S. markets was during 2008-09 (actually, the eighteen months from 12/01/2007 - 05/30/2009). See the graph immediately below, with MIPS "trades" shown as red dots on the graph (during this time, MIPS3 traded 21 times or approx 14 trades/year). You will see that MIPS3 went short well before much downside damage had been done, and the model performed brilliantly during this entire period. Believe it or not, backtest results show that MIPS4 would have done even better !!!
MIPS3 +130% SPY -38%
For the record, the actual, live trades from TimerTrac.com for this period are shown below.
TimerTrac.com
Trades for the strategy MIPS Timing Systems MIPS3/MF between
Saturday, December 1, 2007 and Saturday, May 30, 2009.
Times are mountain time, MST (GMT -7) / MDT (GMT -6).
* Note: For this strategy, any trades within the last 30 days are not shown.
| Date |
Distribution |
Percentage |
Comment |
| 12/6/2007 5:10:00 PM |
Mips Long |
100 % |
|
|
Mips Short |
0 % |
|
|
MMF |
0 % |
|
| 12/11/2007 5:10:00 PM |
Mips Long |
0 % |
|
|
Mips Short |
0 % |
|
|
MMF |
100 % |
|
| 12/12/2007 5:10:00 PM |
Mips Long |
0 % |
|
|
Mips Short |
100 % |
|
|
MMF |
0 % |
|
| 3/14/2008 5:10:00 PM |
Mips Long |
0 % |
|
|
Mips Short |
0 % |
|
|
MMF |
100 % |
|
| 4/11/2008 5:10:00 PM |
Mips Long |
100 % |
|
|
Mips Short |
0 % |
|
|
MMF |
0 % |
|
| 4/29/2008 5:10:00 PM |
Mips Long |
0 % |
|
|
Mips Short |
0 % |
|
|
MMF |
100 % |
|
| 5/15/2008 5:10:00 PM |
Mips Long |
100 % |
|
|
Mips Short |
0 % |
|
|
MMF |
0 % |
|
| 5/19/2008 5:10:00 PM |
Mips Long |
0 % |
|
|
Mips Short |
0 % |
|
|
MMF |
100 % |
|
| 6/11/2008 5:10:00 PM |
Mips Long |
0 % |
|
|
Mips Short |
100 % |
|
|
MMF |
0 % |
|
| 7/15/2008 5:10:00 PM |
Mips Long |
0 % |
|
|
Mips Short |
0 % |
|
|
MMF |
100 % |
|
| 8/22/2008 5:10:00 PM |
Mips Long |
100 % |
|
|
Mips Short |
0 % |
|
|
MMF |
0 % |
|
| 9/4/2008 5:10:00 PM |
Mips Long |
0 % |
|
|
Mips Short |
100 % |
|
|
MMF |
0 % |
|
| 10/10/2008 5:10:00 PM |
Mips Long |
0 % |
|
|
Mips Short |
0 % |
|
|
MMF |
100 % |
|
| 11/5/2008 5:10:00 PM |
Mips Long |
0 % |
|
|
Mips Short |
100 % |
|
|
MMF |
0 % |
|
| 12/1/2008 5:10:00 PM |
Mips Long |
0 % |
|
|
Mips Short |
0 % |
|
|
MMF |
100 % |
|
| 1/7/2009 5:10:00 PM |
Mips Long |
0 % |
|
|
Mips Short |
100 % |
|
|
MMF |
0 % |
|
| 3/18/2009 5:10:00 PM |
Mips Long |
0 % |
|
|
Mips Short |
0 % |
|
|
MMF |
100 % |
|
| 3/31/2009 5:10:00 PM |
Mips Long |
100 % |
|
|
Mips Short |
0 % |
|
|
MMF |
0 % |
|
| 4/17/2009 5:10:00 PM |
Mips Long |
0 % |
|
|
Mips Short |
0 % |
|
|
MMF |
100 % |
|
| 5/6/2009 5:10:00 PM |
Mips Long |
100 % |
|
|
Mips Short |
0 % |
|
|
MMF |
0 % |
|
| 5/8/2009 5:10:00 PM |
Mips Long |
0 % |
|
|
Mips Short |
0 % |
|
|
MMF |
100 % |
|
Copyright © 1999-2014 TimerTrac.com. All Rights Reserved.