site map
my account
contact
our facebook page
Latest Posts
Archive

+
...

Market Timing

Monday, July 14 2014

As most MIPS members already know, we show several possible trading profiles for our MIPS models under the "Services" tab on our main menu at www.mipstiming.com.

CONSERVATIVE TRADING
Trading the SPY long only is the most conservative trading profile for our MIPS models, and trading SPY/SH is the most conservative for long/short trading

AGGRESSIVE TRADING
Shown below are several trading profiles that are more aggressive than simply trading SPY/SH long/short.  Of course, these trading profiles are for more aggressive investors.  And, since we are NOT overly aggressive , we recommend trading a "mix" of ETFs, like 1/3 each of SPY, IWM, SSO on long signals and the inverse ETFs, SH, RWM, SH* on short signals (* where SH is the single leverage inverse fund for SPY because we do not like trading double leverage on shorts). This is the trading profile #4 below (CAGR=40.3%,  Max DD=-12.1%).


See Perfromnace Results for the various trading profiles below:
Note: The scale on the Y-axis is different in each graph below.


1.)  MIPS4/MF+ Trading SPY/SH from 2007-2013
      CAGR since Jan'07    SPY=+6.1%  vs. MIPS=+31.3%      Max Drawdown= -10.6%

  
2.) MIPS4/MF+ Trading IWM/RWM from 2007-2013
      CAGR since Jan'07    SPY=+6.1% vs. MIPS=+36.9%        Max Drawdown= -15.1%


3.) MIPS4/MF+ Trading SSO/SH from 2007-2013
       CAGR since Jan'07    SPY=+6.1% vs. MIPS=+52.7%      Max Drawdown= -16.1%


4.) MIPS4/MF+ Trading 1/3 each of SPY/SH, IWM/RWM, SSO/SH from 2007-2013
       CAGR since Jan'07    SPY=+6.1% vs. MIPS=+40.3%         Max Drawdown= -12.1%


Posted by: Dr. G. Paul Distefano AT 11:07 am   |  Permalink   |  Email
Sunday, July 13 2014

In our previous Blog from 6/07/2014 below, we showed the "breakout" of the SPY after months of sideways trading.  The market (the SPY) broke decisively to the upside.  In the graph in that Blog, we pointed out that the new uptrend could continue for a while (green arrow), or go back down (red arrow) to "test" the long-term trendline (black line).  Of course, we did not expect a downside "breach" at that time.

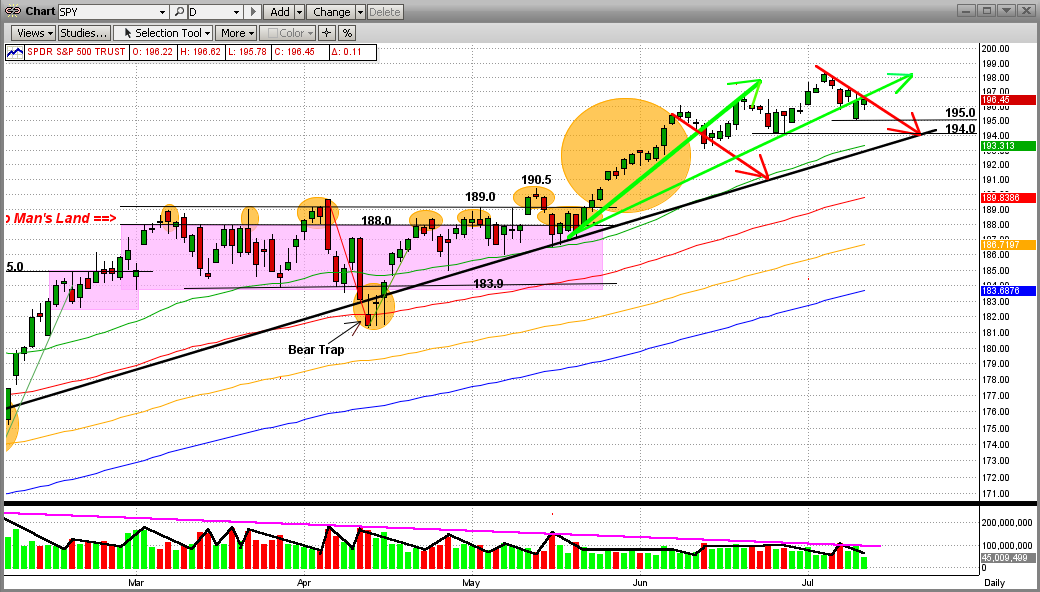
So, what has happened since then.  As can be seen in the new graph immediately below, the SPY has made a few minor dips, but it is still fighting its way up.  And, it has only experienced 3 tiny downdrafts since the breakout.  One problem with the uptrend since last February is that it has "climbed the wall" on ever decreasing (but not really low) volume. We can live with that for now. The new support level for the SPY is at $194, the point at which both the long-term trendline (black line) and the 50-day EMA (green line) converge.  So, if the SPY should break below $194, we will have grave concerns about a major dip (if not the "biggie" itself).  Keep your eyes open because this is where the 3rd "dip" (2nd red arrow) could be heading.

Let's stay alert and wait for MIPS to tell us what to do next.


<<< Previous Blog >>>


Saturday, 07 June 2014

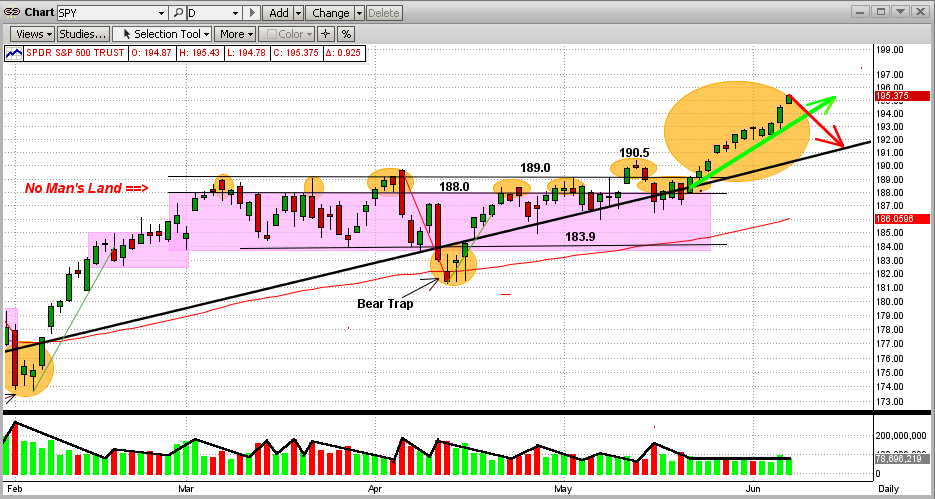
After six failed attempts in a three-month sideways trading pattern, the market (the SPY) finally broke out to the upside from inside a "No Man's Land".  And, what a breakout it has been!  In the graph below, you can now see a new, powerful up-trend (green line).

It seems that this breakout has, so far, followed the tradition for sideways/flat patterns, that is:
1) markets usually breakout of a sideways pattern in the same way that they entered (i.e., if the market was moving up prior to the sideways pattern, it will usually break out to the upside and vice versa), and

2) the length of time that the market will follow the resulting move and the size of the resulting gains/losses is closely correlated to the amount of time that the market traded in the tight pattern.

My opinion on the reason for #2 above is that after a long battle, the losers (in this case, the bears) quit trading and go away for a long time.  I also believe that this is how the market (like now) can make sizeable, sustainable gains on relatively low volume (little or no competition).

It seems that the most likely direction of the market from here is up.  But, even though it could, this does NOT mean that the market will follow the green-line trendline in the graph below going forward.  It's just as likely that the SPY could drop back some or go sideways until it hits the long-term trendline (black line in graph below), and then follow that trend up going forward.  That would be like a "reversion to the trendline".  Either way, we make money.

Also, do not rule out a correction after these healthy gains.  It is not what I expect, but MIPS does not pay one bit of attention to my expectations.  If the market does somehow unexpectedly drop from here, MIPS will get us out.


===================================================================================

Posted by: Dr. G. Paul Distefano AT 10:40 pm   |  Permalink   |  Email
Tuesday, July 01 2014

Many investors think that the bull market that resulted from the massive market crash of 2008 is over, or very near its end. That is highly possible, of course, but NOT a certainty. Many individual investors are basing their opinions on the bull market "recovery" between the two market crashes in 2000 and 2008.

See the 1st graph below:
The bull market between the bottom of the 2000 crash (in 2003) and the top of the resulting bull market in 2007 lasted 5 years.  And, the bull market since 2008 is already older than 5 years.

Also, in the 20-year-period between 1960-1980, the stock market experienced 5 crashes of 35% or more
(4 year averages). => http://www.mipstiming.com/behavior

So, is it not time for another market crash?

SPY Between 1998-2014


Maybe so, and maybe not.  If you follow the market "logic" in the 2000's, a market crash is definitely due.  But, let's look back at the most recent crash before 2000.   This would be the notorious crash of 1987.

See the first 5 years after the crash of 1987 in the graph below. Using the "2000" logic above, this market recovery would have run out of steam at or near the end of 1992. But, did it ?

SPY Between 1987-1993


As can be seen below, this 1988 bull did not quit running until the end of 1999 or beginning of 2000
(12 years after the crash of 1987) !!!

SPY Between 1987-2000


So, history shows that bull markets (like our current 2009 bull market) do NOT necessarily have to stop running up because they are "old" after just 5 years.

The moral of this story is that:
1) it is very difficult to arbitrarily call the end of either a bull or bear run,
2) the MIPS models are very good at finding "Market Inflection Points" (when markets change direction), and
3) since the MIPS models work as well (or actually better) in down markets as they do in up markets, we need to quit worrying about "market crashes" (and, in fact, welcome them).

Our belief is that this 5-year bull run will continue for some time (but probably not 7 more years).  And, we will see "corrections" on the way up. Of course, this is only my personal opinion, and we will follow (as you should) the much "smarter" MIPS models.

Posted by: Dr. G. Paul Distefano AT 01:24 pm   |  Permalink   |  Email

MIPS Timing Systems
P.O. Box 925214
Houston, TX  77292

An affordable and efficient stock market timing tool. Contact MIPS
281-251-MIPS (6477)
E-mail: support@mipstiming.com