Trading frequency is a very important part of the performance of timing models. If you look on TimerTrac.com, you will find long/short timing models that trade between 10-80 times/year. If you use a long/short model, these "trades" are basically "round trip trades", which require two actual trades on every "signal change". For example, a new long signal would require that you: (1) cover your existing short position, and then (2) buy your new long position. At $10/trade, a model that trades 50 times a year (50 round trips) requires 100 actual trades (lots of work) and costs $1,000/year in trading fees. Whereas, a model that trades 12 times/year requires 24 trades/year and would cost $240/year at $10/trade.
As most of you know, the MIPS2 model trades about 8 times/year and the MIPS3 and MIPS4 models trade between 12-14 times/year. Since MIPS3 and MIPS4 are better models, we recommend that you use them even though they trade a little more often. Please remember that the trades/year are "averages" and could mean that in some years the MIPS3/4 models could trade 4-6 times/year and in other years they may trade 16-18 times/year.
What determines how many times/year a model trades is 90-100% dependent upon how long the market trends in that year last (other trades may come about from reversion-to-the-mean in overbought/oversold markets, etc.). The MIPS models were developed to follow "Intermediate-Term" trends (weeks/months); and not "Short-Term" trends (days) nor "Long-Term" trends (months/years).
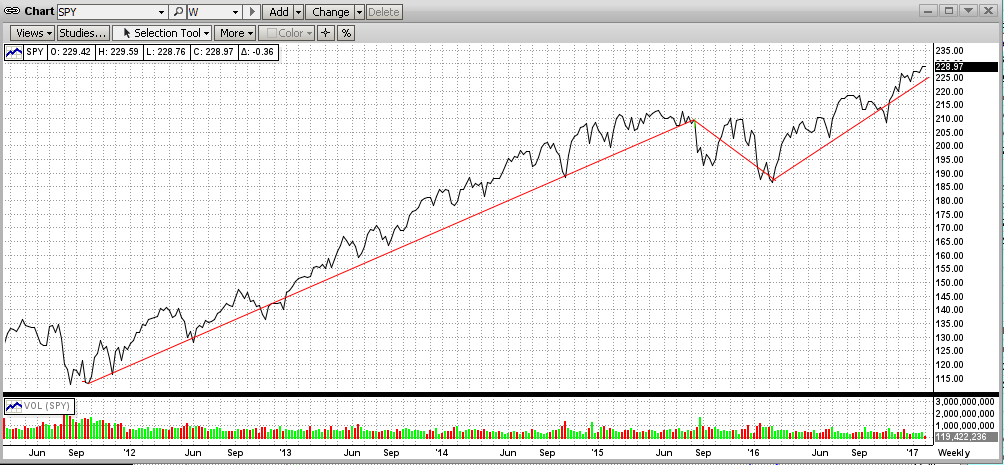
In the last 5-6 years, the market has trended up somewhat consistently. However, in the graph below, you will see that the market in 4Q'15 trended down. But, before and after 4Q'15, the SPY trended up in a relatively tight pattern. So, after 4Q'15, models that were "long" more often than "short" should have matched or beat SPY (especially with like 1.5x leverage on long signals).
Getting closer to home, we all know that MIPS4 has been Long since 07/12/2016 (135 days)!
- [MIPS3 did basically the same, but with a one-day cash position on 11/04/2016].
Incidentally, in the 14 years since 2003, MIPS3 has had 11 signals that lasted longer than 3 months (90 days), with the longest signal lasting one year (361 days). All 11 of these signals were winning signals (even a short signal in 2008). The average gain from these 11 signals was 9.90% each. [This would have been higher with 1.5x leverage, see the last graph.]
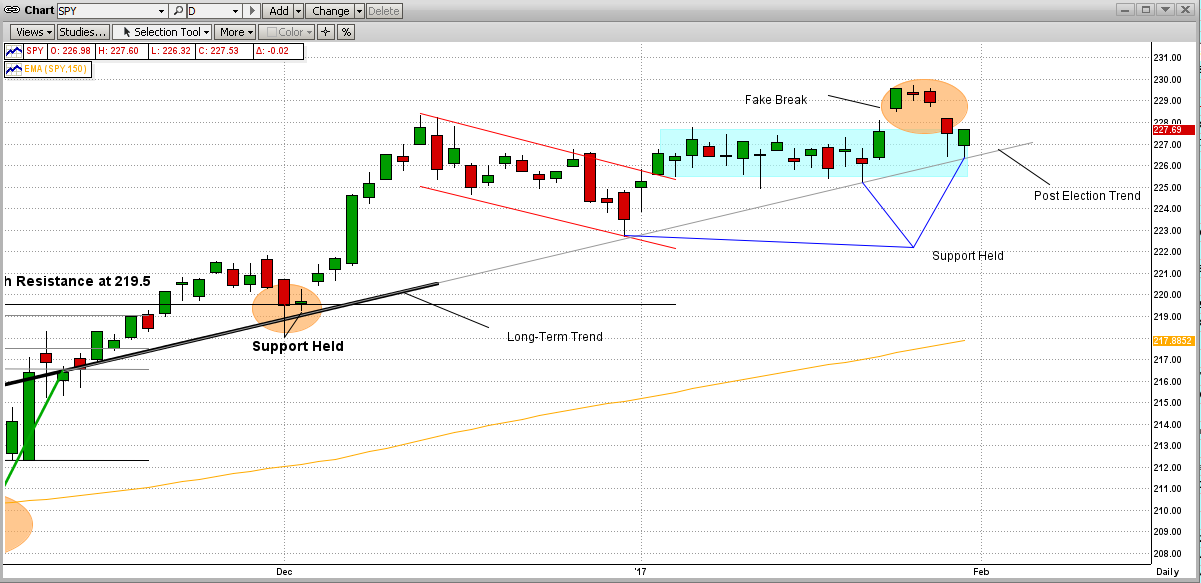
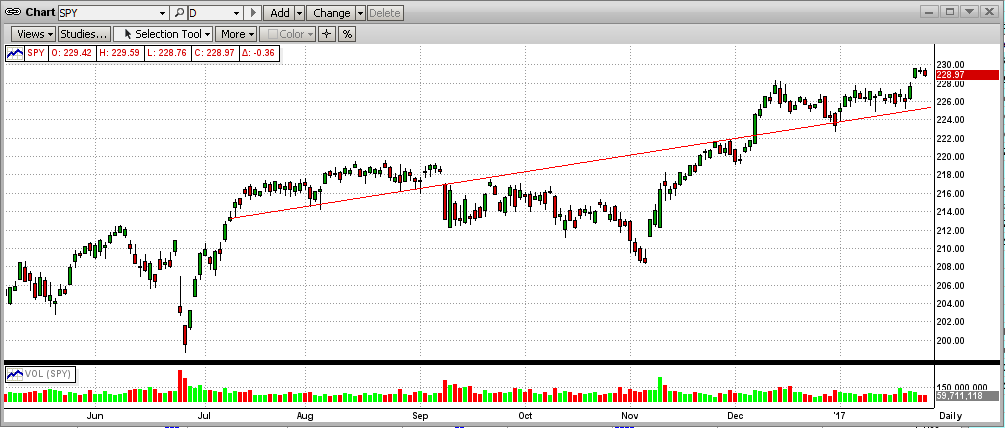
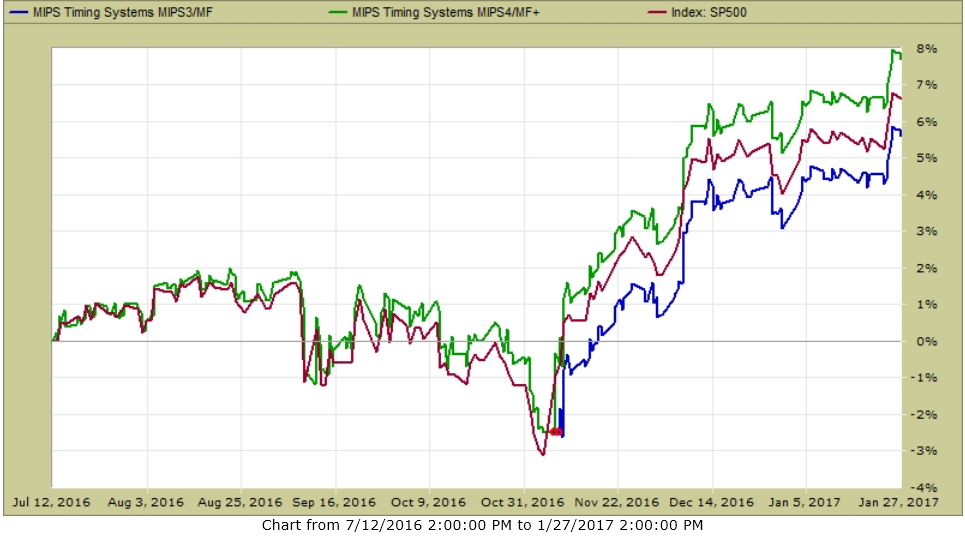
See the graph below to follow the trend of the SPY since 07/12/2016. As you can see, the SPY trend was up most of the time, except for a dip in early November. BTW, in a strong up market like this, it takes a bigger dip than that for MIPS to change direction. And, chasing ralatively small dips can lead to getting whipsawed. Remember, our Blaster Series algos in 1Q'16 greatly lessen the chance of the MIPS models from getting whipsawed !!!
So, how did this 135-day long signal since 07/12/2016 perform. The graph below shows MIPS4 with a 7.9% gain and MIPS3 with a 5.8% gain, both trading SPY with no leverage.
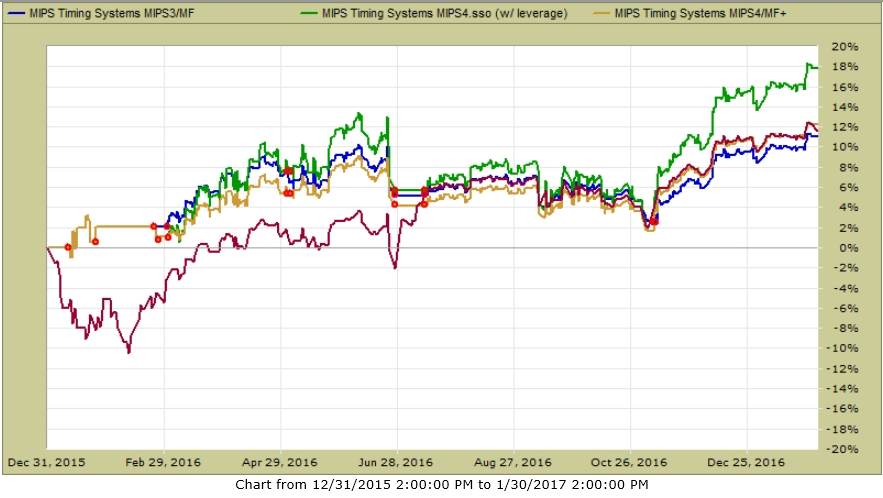
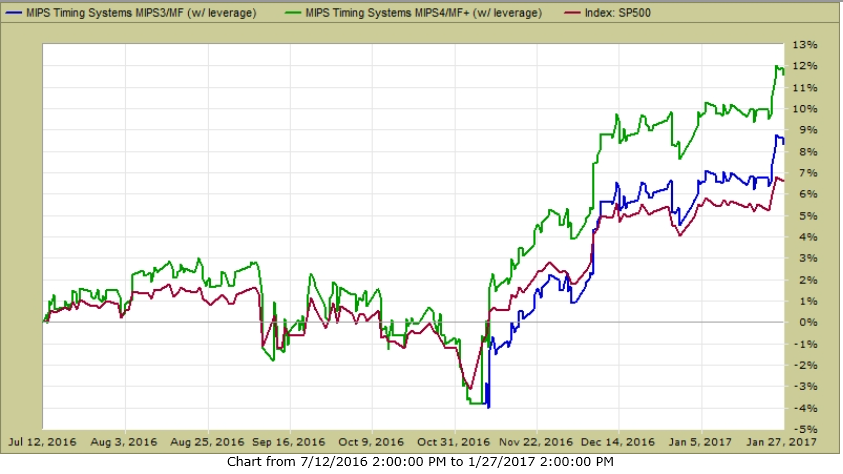
With 1.5x Leverage
The graph below from TimerTrac.com shows how MIPS3/4 would have performed trading SPY with 1.5x leverage on long signals and 1.0x leverage on short signals (MIPS4 +11.8%; MIPS3 +8.6%).
Paul Distefano, PhD
MIPS Timing Systems, LLC
Houston, TX
281-251-MIPS(6477)
www.mipstiming.com