Sunday, May 28 2017
MIPS Members:
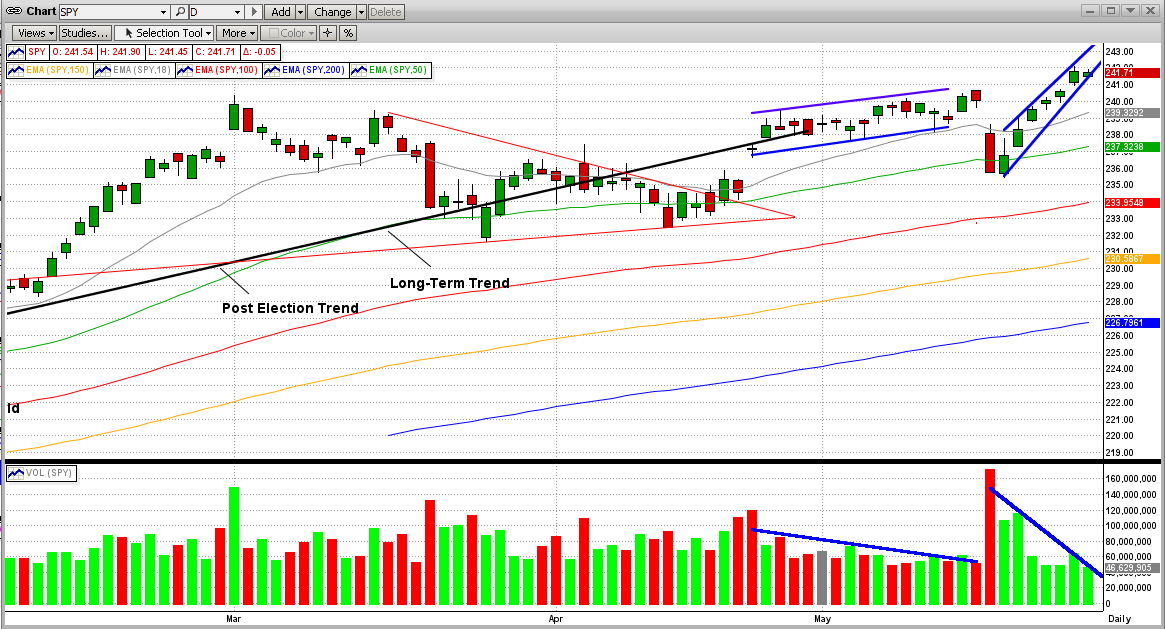
This week we had another market run-up on decreasing volume That is scary !!!
- stay tuned...

Paul Distefano, PhD
MIPS Timing Systems, LLC
Houston, TX
281-251-MIPS(6477)
==============================================================
<<< Previous email >>>
MIPS - Where and Why are the "Big Guys" Hiding? - May 20th
MIPS Members:
MIPS members who have been with us for a while know that I call large "Institutional Investors" the "Fat Kats" and/or the "Big Guys". Institutional investors include giant financial companies like Goldman Sachs, Morgan Stanley, BlackRock, State Street Global, PIMCO, etc.
How big are the Big Guys? Well there are less than 2000 Fat Kats in the US markets, but they "control" over 65% of the shares on the New York stock exchange (and most of this is controlled by the top 100). "Little Guys", like you and me and other "multi-millionaires" (haha) from all over the world that own stocks in the US markets (200 million of us), only control 35%. So, when the Fat Kats decide to get in or out of the market many of them often do so at the same time; and hence, their high volumes "move the markets". Us 200 million Little Guys, on the other hand, are not trading all day, every day like the Big Guys. This is because us Little Guys have other things to do than to "trade" - lawyers are in court, surgeons are removing someone's gizzards, engineers are launching missiles, etc. And even if a large number of us Little Guys would trade on the same day, we do not own enough shares to significantly "move the entire market".
Therefore, the Fat Kats leave a "footprint" (their daily volume). When the market goes up on high volume, we know who bought; and when the market tanks on high volume, we know who sold. They may as well send out emails saying "The Big Guys are buying" and/or "The Big Guys are selling".
For this reason, we at MIPS "adjust" the market data depending on volume. We call this Volume Adjusted Data (or VAD). Therefore, on high volume a 1% gain in the market (like in the S&P 500) may be looked upon within MIPS as a 1.5-2.0% gain; and vice versa on low volume. BTW, for the above reason, the Fat Kats wish that the total daily market volume was not published (they can't hide).
This brings us to the purpose of this Blog.
The Title is... Where and Why are the "Big Guys" Hiding?
Before we answer that, we need to explain how we know that the Big Guys are hiding and then explain why that is important.
The market has had a remarkable run to the upside since the Presidential election on Nov 11, 2017. That run was on relatively high volume. Then, the market took a break and meandered down a little until Friday, April 21st.
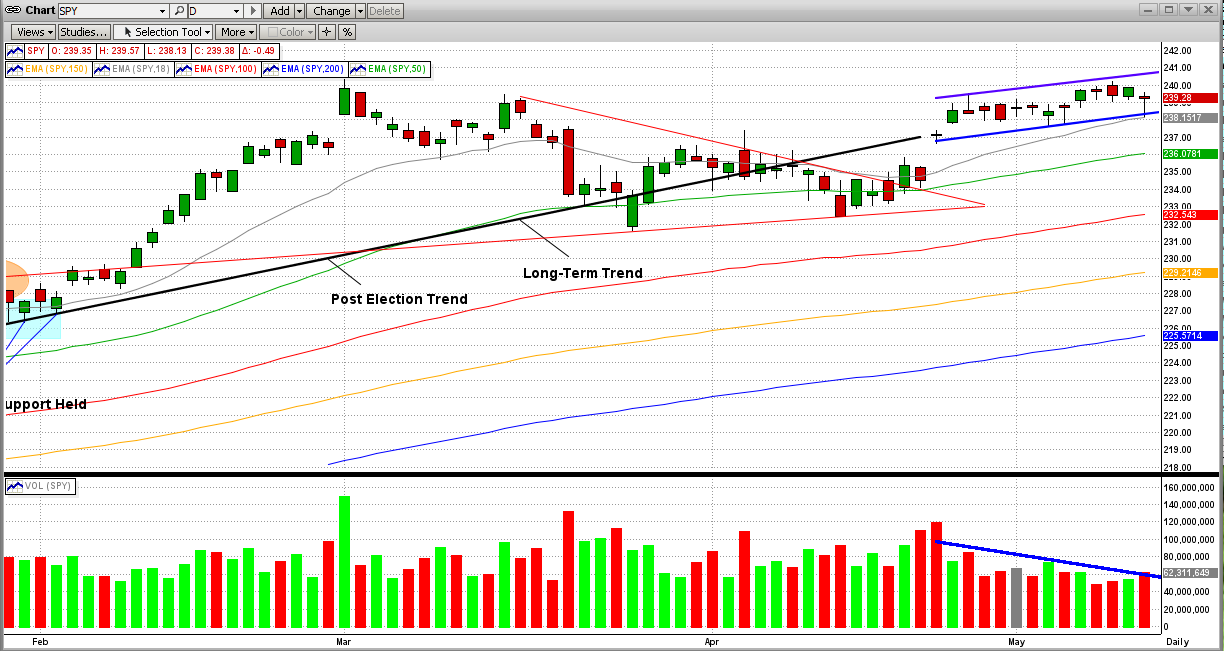
Now, see the relatively weak up-trend since Monday, April 24th in the graph below (blue lines).
This is NOT a good sign, because:
(a) the new up-trend is weak,
(b) the trading range is very narrow,
(c) the volatility is almost non-existent (meaning very little involvement from Fat Kats, and
(d) worst of all, the volume has tapered off to about 1/2 of its prior level, as of today (May 11th).
Read on...

The conclusion from above is that, since the volume has basically collapsed, the Big Guys are "Hiding" on the sidelines. When markets experience very tight trading patterns on basically dried-up volume, the next move usually happens fast and moves even faster. Believe me, the Fat Kats have not packed up and gone away. The Bulls are sitting around ready to buy-in big-time at the first sign of good news; and the Bears have their fingers on the sell button, ready to sell on the first sign of bad news. In other words, the Fats Kats are playing it safe.
As you might expect, MIPS is still Long and all signs see it staying that way as long as the trend stays to the upside ("Don't fight the trend"). But, of course, that can change in a few days.
Stay tuned...
Paul Distefano, PhD
MIPS Timing Systems, LLC
Houston, TX
281-251-MIPS(6477)
Wednesday, May 24 2017
On our website at http://www.mipstiming.com/services we talk about and explain leverage and how to trade it, but we do not encourage it. On the other hand, we also do not discourage using "moderate" leverage trading for "some" investors. Of course, using leverage or not using leverage depends upon the risk tolerance of the investor. Many investors trade leverage with a just small part of their portfolio, and trade the bulk without leverage.
At any rate, we don't advise MIPS members to trade with over 1.5x leverage. BTW, you can trade 1.5x leverage for the SPY by trading 50% of your money in SPY (1.0x) and the other 50% in SSO (2.0x).
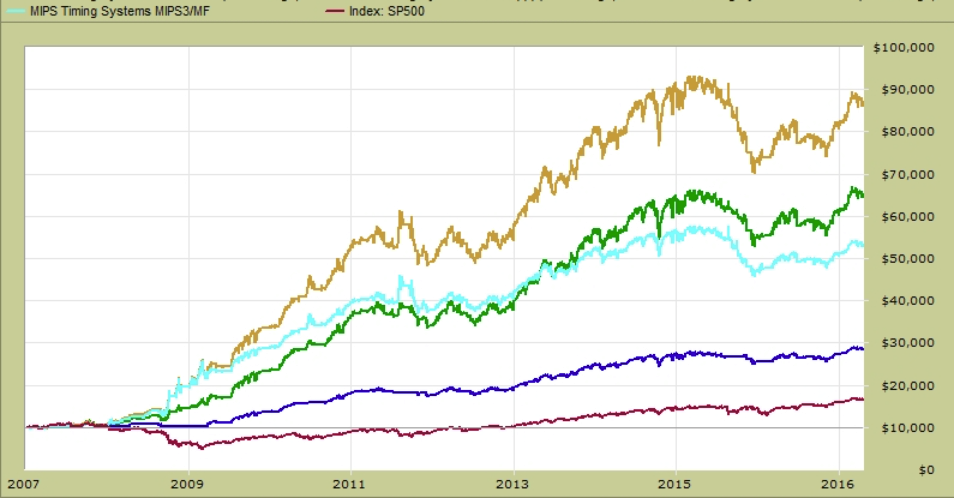
Below is a graph of MIPS3 trading various levels of leverage
- For myself, I mainly trade "Moderate Aggressive" below
- Of course, your choice is up to you
- MIPS3 is our original model with verified results all the way back to 11/04/2005
- And remember, the newest release of MIPS3 and MIPS4 (Blaster Series) are much better models
Trading SPY with various levels of leverage:
SPY with 1.5x / 1.0x (long/short) - Gold line --- Aggressive
SPY wtih 1.5x / 0.5x (long/short) - Green line --- Moderate Aggressive
SPY with 1.0x / 1.0x (long/short) - Light Blue --- *** Standard ***
SPY with 1.0x / 0.0x (long/cash) - Dark Blue line - Conservative (long-only)
SPY with Buy-and-Hold - Red Line --- Benchmark
< From TimerTrac.com >

From the above, it can be seen that the Standard strategy (light blue line) grew from $10,000 => $54,000; while the SPY with buy/hold grew to $18,000.
During that same time frame, the Aggressive strategy (gold line) has the highest growth rate of all ($10,000 => $88,000), but comes with higher volatility.
A happy medium for those who want to trade with some leverage would be to trade the Moderate Aggressive strategy ($10,000 => $67,000), which out-grows the Standard strategy with lower volatility (green line).
Stay tuned...
Paul Distefano, PhD
MIPS Timing Systems, LLC
Houston, TX
281-251-MIPS(6477)
www.mipstiming.com
Thursday, May 11 2017
MIPS members who have been with us for a while know that I call large "Institutional Investors" the "Fat Kats" and/or the "Big Guys". Institutional investors include giant financial companies like Goldman Sachs, Morgan Stanley, BlackRock, State Street Global, PIMCO, etc.
How big are the Big Guys? Well there are less than 2000 Fat Kats in the US markets, but they "control" over 65% of the shares on the New York stock exchange (and most of this is controlled by the top 100). "Little Guys", like you and me and other "multi-millionaires" (haha) from all over the world that own stocks in the US markets (200 million of us), only control 35%. So, when the Fat Kats decide to get in or out of the market many of them often do so at the same time; and hence, their high volumes "move the markets". Us 200 million Little Guys, on the other hand, are not trading all day, every day like the Big Guys. This is because us Little Guys have other things to do than to "trade" - lawyers are in court, surgeons are removing someone's gizzards, engineers are launching missiles, etc. And even if a large number of us Little Guys would trade on the same day, we do not own enough shares to significantly "move the entire market".
Therefore, the Fat Kats leave a "footprint" (their daily volume). When the market goes up on high volume, we know who bought; and when the market tanks on high volume, we know who sold. They may as well send out emails saying "The Big Guys are buying" and/or "The Big Guys are selling".
For this reason, we at MIPS "adjust" the market data depending on volume. We call this Volume Adjusted Data (or VAD). Therefore, on high volume a 1% gain in the market (like in the S&P 500) may be looked upon within MIPS as a 1.5-2.0% gain; and vice versa on low volume. BTW, for the above reason, the Fat Kats wish that the total daily market volume was not published (they can't hide).
This brings us to the purpose of this Blog.
The Title is... Where and Why are the "Big Guys" Hiding?
Before we answer that, we need to explain how we know that the Big Guys are hiding and then explain why that is important.
The market has had a remarkable run to the upside since the Presidential election on Nov 11, 2017. That run was on relatively high volume. Then, the market took a break and meandered down a little until Friday, April 21st.
Now, see the relatively weak up-trend since Monday, April 24th in the graph below (blue lines).
This is NOT a good sign, because:
(a) the new up-trend is weak,
(b) the trading range is very narrow,
(c) the volatility is almost non-existent (meaning very little involvement from Fat Kats, and
(d) worst of all, the volume has tapered off to about 1/2 of its prior level, as of today (May 11th).
Read on...

The conclusion from above is that, since the volume has basically collapsed, the Big Guys are "Hiding" on the sidelines. When markets experience very tight trading patterns on basically dried-up volume, the next move usually happens fast and moves even faster. Believe me, the Fat Kats have not packed up and gone away. The Bulls are sitting around ready to buy-in big-time at the first sign of good news; and the Bears have their fingers on the sell button, ready to sell on the first sign of bad news. In other words, the Fats Kats are playing it safe.
As you might expect, MIPS is still Long and all signs see it staying that way as long as the trend stays to the upside ("Don't fight the trend"). But, of course, that can change in a few days. Stay tuned...
Paul Distefano, PhD
MIPS Timing Systems, LLC
Houston, TX
281-251-MIPS(6477)
|