Wednesday, June 06 2012
Well, can we now answer the question from our previous email, "Is This a Correction or a Bear Trap" ?
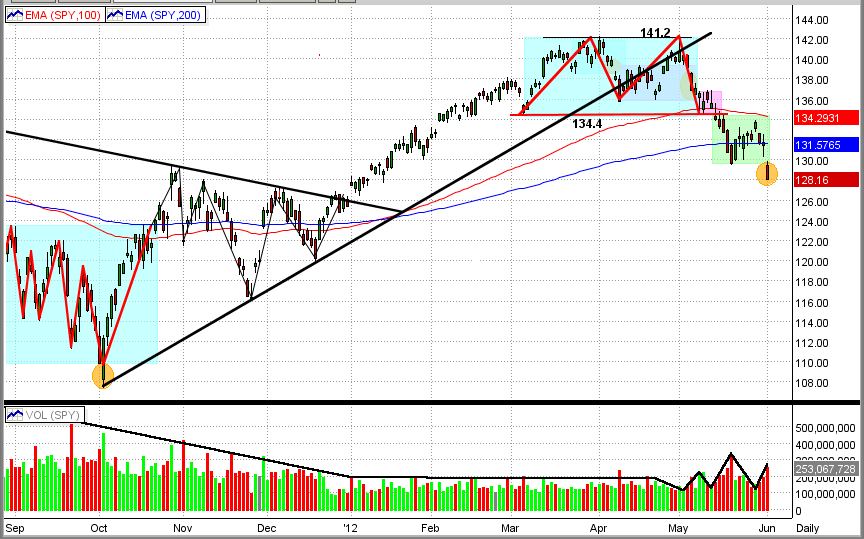
- When we look at the last few days on the graph immediately below, it sure looks like the SPY will run up from here,
officially making the downside break on 6/1/12 a "Bear Trap".
- Not only did the SPY turn back to the upside, it kind of peeked its head above its 200-day EMA (blue line) and its
short-term trendline (black line).
- On the negative side, the volume during this very short-term "rally" has been weak and is declining as the market
moves up.
- The next strong resistance is the SPY 100-day EMA at $134 (red line)
However, none of the problems that sent the market down recently are even close to being "fixed". And, none of the MIPS models (except the very long-term MIPS1/VLF model) are convinced that the market action over the last few days constitutes a "new intermediate up-trend" yet, and they stand by their "Short" signals (at least for now).
And, of course, only time will tell which direction the market will move from here, but it should only take a short amount of time to do so. Needless to say, the next few days are critical.
Monday, June 04 2012
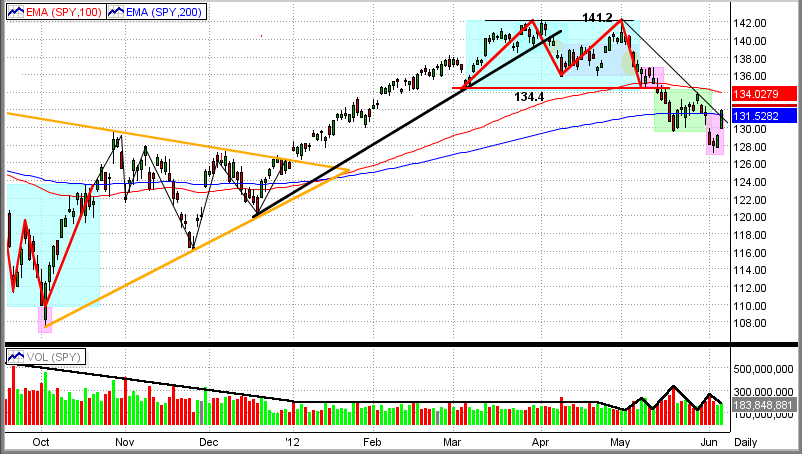
By all measures of technical analysis, the recent market action and volume (or lack thereof when the market moved up) would indicate a correction (or worse).
See the graph immediately below and scan the previous emails.
From the 1st graph, you will see that the SPY has:
- broken its most recent intermediate-term trendle,
- fallen below the neckline of a double-top pattern (blue box)
- fallen below both its 100-day EMA and 200-day EMA (red line and blue line)
- broken thru the bottom of its most recent trading pattern (green box)
And, the trading volume of the SPY has been decreasing in up moves and increasing in down moves.
That in itself is usually strong evidence of a market downdraft (correction or worse). Taken together with the terrible unemployment rate and very slow job creation in the US, the slowdown in the Chinese economy, and a possible meltdown in Europe, and it could become a recipe for disaster. That is what the graph below is trying to tell us.
But, it could also be displaying a Bear Trap signal. Look at the two drops in the SPY shown in the orange circles, one in early Oct'11 and the other on Friday of last week. On 10/04/12, the SPY's drop thru the bottom of a sideways trading pattern turned out to be a one-day key reversal, and this Bear Trap was followed by a 30% gain in the SPY.
So, could the SPY's drop on 6/01/12 possibly be a similar Bear Trap and be followed by another strong intermediate-term uptrend ? The market action in the next 2-3 days should be indicative of what the next major move in the market will be. [Keep in mind, however, that it would not be abnormal for the SPY to move up on Monday following its 2.5% drop on Friday (this has kind of been the norm in the last few years of high volatility).]
Whew, enough guessing. Let's follow MIPS and let it guide the way for us.
|


