Saturday, December 26 2015
This blog is to show the improvements in performance that we have made in the MIPS models as a result of adding our new algorithms for markets with high-frequency directional changes (like every few days). Without algorithms like these, most timing models would get whipsawed in these fast changing environments (as MIPS did in 2015).
See the improvements:
(a) in 2015 in our previous email (excerpts below), and (b) for 2007-Dev'2015 in this new blog.
Because we have verified signals on TimerTrac.com for MIPS3, we compare MIPS3 below before and after the change in algorithms.
You will want to compare the Gold Line (after) against the Brown Line (before).
- other models are included to round out our offerings.
MIPS models updated with our new algos:
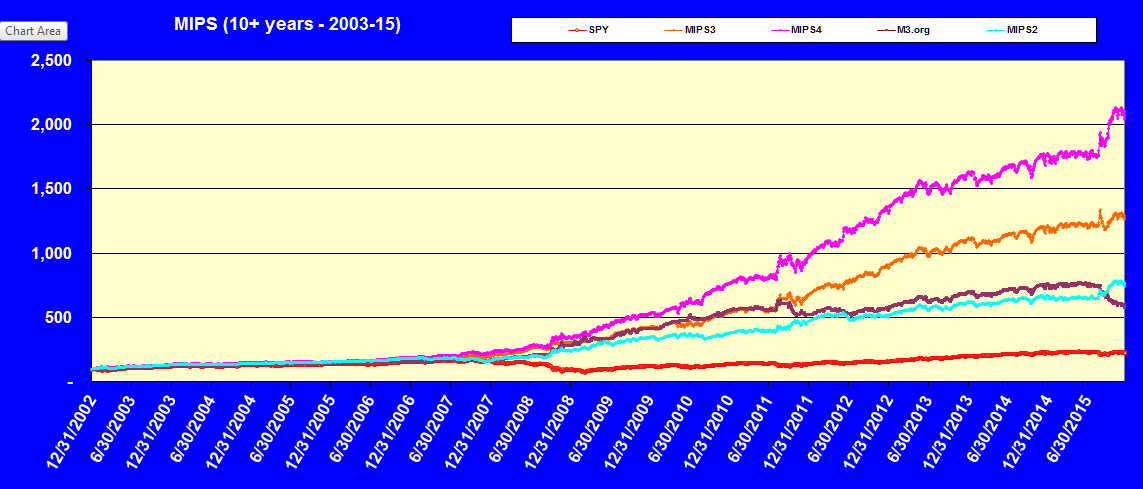
1) Brown Line = MIPS3 performance as it actually happened over the years
- Signals verified by TimerTrac.com
- Performance is from whichever version of MIPS3 that was in effect at the time of each signal
- Note the flat market in 2011 and the drawdown in 2015
The below is what the performance would have been if all revisions to the MIPS models were available
since 2003:
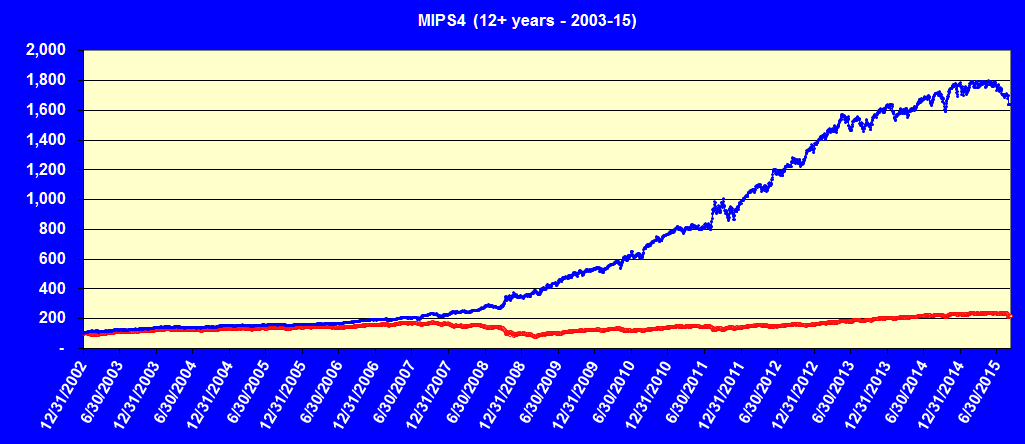
2) Gold Line = The latest version of MIPS3 including all new algos, backtested to 2003
3) Purple Line = The latest version of MIPS4 including all new algos, backtested to 2003
4) Blue Line = The latest version of MIPS2 including all new algos, backtested to 2003
5) Red Line = SPY performance
Remember, the new algos are for:
(a) high-frequency direction changes (b) in a flat market (c) over a relatively long period of time
- this is rare, so the new algos did not result in big differences in performance compared to the old algos,
except in 2011 and 2015
- see a comparable chart from the old models on our website at http://mipstiming.com/performance1
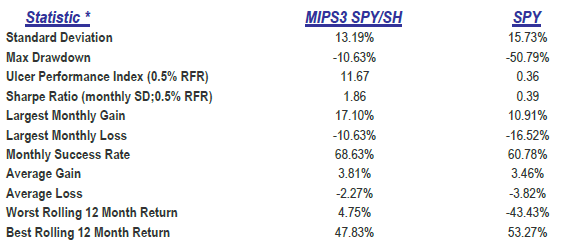
Statistics below are for MIPS3 trading SPY long/short from 2007-6/30/2015
- does not include results after 2Q'15
MIPS3 CAGR = 25%
Paul Distefano, PhD
CEO / Founder
MIPS Timing Systems
Houston, TX
 281-251-MIPS(6477) 281-251-MIPS(6477)
=============================================================
<<< Excerpts from Blog on 12/20/2015 >>>
MIPS Members:
This blog is an attempt to explain what went wrong with the MIPS models in 2015, and how we have "fixed" the problems. Section I explains the perils of buying SH instead of shorting SPY on short signals in high volatility markets, and Section II attempts to explain the risk of trading in markets that are changing direction continuously in only a few days over long periods of time. Section III explains "drawdowns" and timing models in general.
SECTION I.
This first section shows MIPS4 drawdowns in 2015 that resulted from trading SPY/SH instead of trading SPY long/short. You will see that trading SPY/SH would have increased the drawdown in 2015 by 50% (from about -12% to -18%) !!!
The "standard" MIPS models trade the S&P500 Index SPY long and short
- some people believe that buying the inverse SPY500 Index (SH) will yield the same results as shorting the SPY,
but it can be much different (as in 2015).
- with high volatility, buying SH can be much different than shorting SPY (in normal times, we buy SH on short
signals; but, in highly volatile markets, we short SPY).
- in 2015, buying SH on short signals instead of shorting SPY would have lead to a 50% bigger drop
year-to-date (-18% vs -12%)
Note:
The high performance difference between buying SH on shorts instead of shorting SPY in 2015 was rare, as most of the deviation came on 8/24/2015. On that day, the overnight percent change in the SH was almost twice that of the change in the SPY. Since MIPS4 bought SH on the open of 8/24/15 and because the market recovered a large % of the overnight drop, MIPS got clobbered that day (shorting SPY would have been much less painful).
=============================================================
SECTION II.
The rest of the bad performance from the MIPS models in 2015, of course, was the result of getting whipsawed.
This "whipsawing" was a rare phenomenon that resulted from very high-frequency direction changes (every 4-7 days) over a long period of time
For example:
For the first time in its history, the SPY experienced 29 direction changes in the first 8 months of 2015 !!!
And, the Dow had a one-day 1000 point drop on 8/24/2012, one of the largest in its history (this "killed" the SH).
The things I want to point out are:
The MIPS models now have new algorithms that identify: (a) flat markets, and (2) directional changes that
are too short-term to trade.
- after our fixes for high-frequency directional changes, the MIPS models produced gains rather than nasty
drawdowns
- instead of being down between 12-18% as before, the new algorithms would have produced gains between
1% to16% for the year
- and, instead of trading an average of 17 times as with the old models, the new models traded an average of
only 10 times for the year
- this is because some of the new algorithms "stay the course" (rather than trade) under certain
identifiable conditions
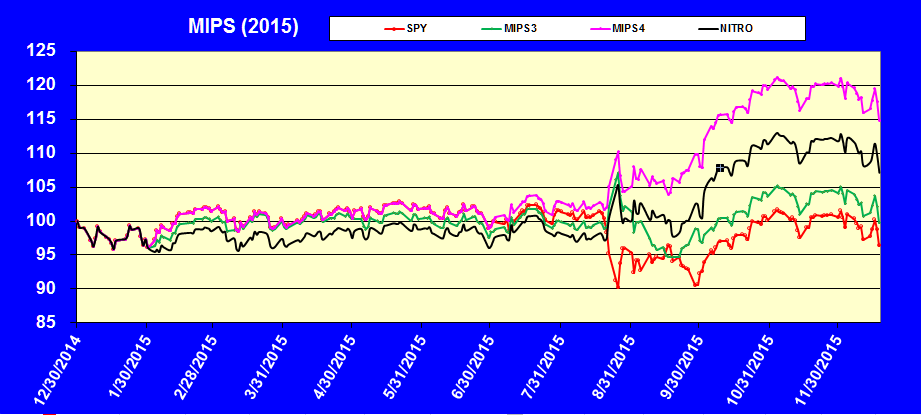
2015 with the New MIPS Models
Red line = SPY Green Line = MIPS3 Black Line = MIPS/Nitro Purple Line = MIPS4
======================================================================
SECTION III
Please remember that, although 2015 was a bad year for MIPS, it DOES NOT mean that the MIPS models are not still some of the best timing models on the market today. No mathematical model is perfect and they all have "bad periods". For example, many nuclear power plants have been shut down because the control systems could not keep the plant temperature from rising; NASA has had to "intervene" hundreds of times to keep a space ship to the moon on its trajectory because the control system cannot do it correctly for 250,000 miles; etc.
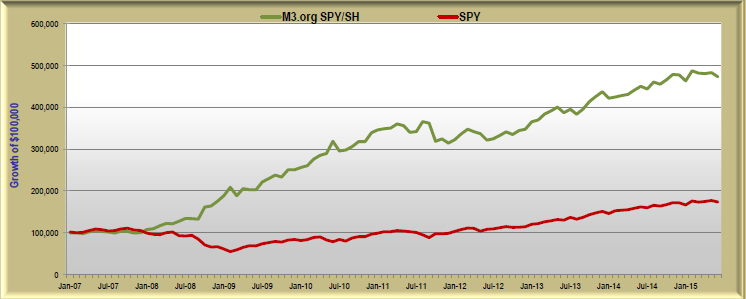
MIPS3 had a comparable bad period in 2011 and recovered nicely in 2009-2014 (see graph immediately below).
We are extremely confident that the same will happen with the MIPS models after 2015. And remember, the
current MIPS3 model is much better than the "original" M3.org model below, and MIPS4 is a much better model
than MIPS3.
MIPS3 2007-6/30/2015 CAGR = 20% Max DD = -10.6%
In our world, the Buy-and-Hold strategy has had two 50% crashes ("very large drawdowns") in the last 15 years and another one is due and coming in the next few years (or months). Both of these took rouglly 5 years to recover.
Virtually ALL of the best Timing Models on the market today that I know of, that have produced compounded annual growth rates (CAGRs) of 20% or better, have all had Max DD's of 20-25% over the last 10 years. However, most fully recovered from their drawdowns in 1-2 years.
So, what will it be ???
- Buy-and-Hold that drops 40-50% and takes 5 years to recover or
- Market Timing that drops 20-25% and takes 6-18 months to recover ???
If someone somehow could produce a model with a CAGR of 25% per year with no setbacks, this model would basically double their money every 3 years! Of course, this means if an investor started with $10,000 at age 30 (and did NOT invest any more for the rest of his/her life), with a timing model like that above, their $10,000 would have a value of about $18.5 million at age 65. And, of course, if one started with $50,000 at age 30 (with no additional investment money), they would have over $93 million at age 65. BTW, if there ever was a model this good, the developers would be able to sell it on Wall Street for at least $50-75 million. You would never see it on the retail market for $500 per year.
Because of "setbacks" as in the MIPS models in 2015, very few people will experience the above; but, they should expect to do VERY much better than buy-and-hold if they use good timing models (like the MIPS models)
Stay tuned...
Sunday, December 20 2015
This blog is an attempt to explain what went wrong with the MIPS models in 2015, and how we have "fixed" the problems. Section I explains the perils of buying SH instead of shorting SPY on short signals in high volatility markets, and Section II attempts to explain the risk of trading in markets that are changing direction continuously in only a few days over long periods of time. Section III explains "drawdowns" and timing models in general.
SECTION I.
This first section shows MIPS4 drawdowns in 2015 that resulted from trading SPY/SH instead of trading SPY long/short. You will see that trading SPY/SH would have increased the drawdown in 2015 by 50% (from about -12% to -18%) !!!
The "standard" MIPS models trade the S&P500 Index SPY long and short
- some people believe that buying the inverse SPY500 Index (SH) will yield the same results as shorting the SPY,
but it can be much different (as in 2015).
- with high volatility, buying SH can be much different than shorting SPY (in normal times, we buy SH on short
signals; but, in highly volatile markets, we short SPY).
- in 2015, buying SH on short signals instead of shorting SPY would have lead to a 50% bigger drop
year-to-date (-18% vs -12%)
Note:
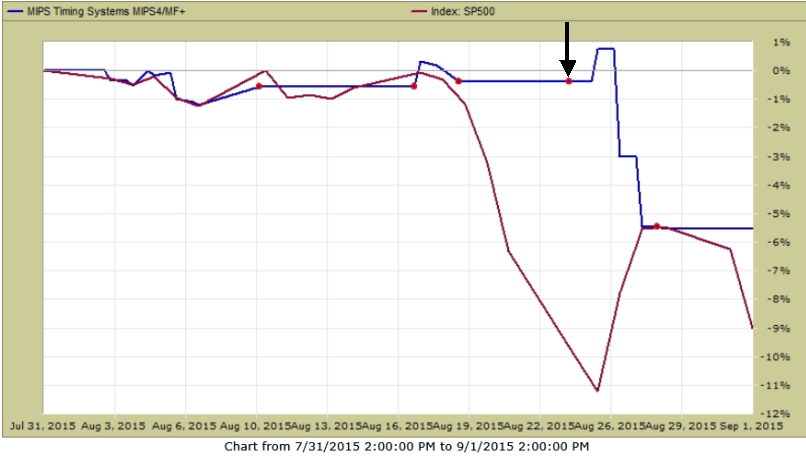
The high performance difference between buying SH on shorts instead of shorting SPY in 2015 was rare, as most of the deviation came on 8/24/2015. On that day, the overnight percent change in the SH was almost twice that of the change in the SPY. Since MIPS4 bought SH on the open of 8/24/15 and because the market recovered a large % of the overnight drop, MIPS got clobbered that day (shorting SPY would have been much less painful). See Graphs #1 and #2 below.
Graph #1 is MIPS4 trading SPY on long signals and shorting SPY on short signals
(-12% for the year)
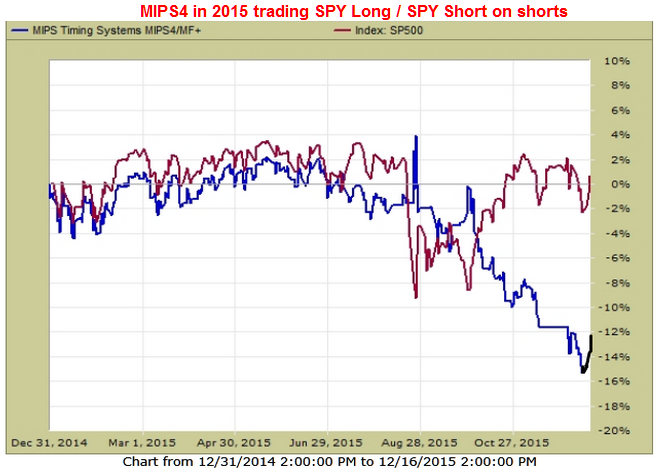
Graph #2 is MIPS4 trading SPY on long signals and buying SH on short signals
(-18% for the year)

=============================================================
SECTION II.
The rest of the bad performance from the MIPS models in 2015, of course, was the result of getting whipsawed.
This "whipsawing" was a rare phenomenon that resulted from very high-frequency direction changes (every 4-7 days) over a long period of time.
For example:
For the first time in its history, the SPY experienced 29 direction changes in the first 8 months of 2015 !!!
And, the Dow had a one-day 1000 point drop on 8/24/2012, one of the largest in its history (this "killed" the SH).
The things I want to point out are:
The MIPS models now have new algorithms that identify: (a) flat markets, and (2) directional changes that
are too short-term to trade.
- after our fixes for high-frequency directional changes, the MIPS models produced gains rather than nasty
drawdowns
- instead of being down between 12-18% as before, the new algorithms would have produced gains between
1% to16% for the year
- and, instead of trading an average of 17 times as with the old models, the new models traded an average of
only 10 times for the year
- this is because some of the new algorithms "stay the course" (rather than trade) under certain
identifiable conditions.
2015 with the New MIPS Models
Red line = SPY Green Line = MIPS3 Black Line = MIPS/Nitro Purple Line = MIPS4
======================================================================
SECTION III
Please remember that, although 2015 was a bad year for MIPS, it DOES NOT mean that the MIPS models are not still some of the best timing models on the market today. No mathematical model is perfect and they all have "bad periods". For example, many nuclear power plants have been shut down because the control systems could not keep the plant temperature from rising; NASA has had to "intervene" hundreds of times to keep a space ship to the moon on its trajectory because the control system cannot do it correctly for 250,000 miles; etc.
MIPS3 had a comparable bad period in 2011 and recovered nicely in 2009-2014 (see graph immediately below).
We are extremely confident that the same will happen with the MIPS models after 2015. And remember, the
current MIPS3 model is much better than the "original" M3.org model below, and MIPS4 is a much better model
than MIPS3.
MIPS3 2007-6/30/2015 CAGR = 20% Max DD = -10.6%
In our world, the Buy-and-Hold strategy has had two 50% drops (aka drawdowns) in the last 15 years and another one is due and coming in the next few years (or months). Virtually ALL of the best timing models on the market today that I know of, that have produced compounded annual growth rates (CAGRs) of 20% or better, have all had Max DD's of 25-30% over the last 8-10 years.
If someone somehow could produce a model with a CAGR of 24% per year with no setbacks, this model would double their money every 3 years! Of course, this means if an investor started with $10,000 at age 30 (and did NOT invest any more for the rest of his/her life), with a timing model like that above, their $10,000 would have a value of about $18.5 million at age 65. And, of course, if one started with $50,000 at age 30 (with no additional investment money), they would have over $93 million at age 65. BTW, if there ever was a model this good, the developers would be able to sell in on Wall Street for at least $50-75 million. You would never see it on the retail market for $500 per year.
Because of "setbacks" as in the MIPS models in 2015, very few people will experience the above; but, they should expect to do VERY much better than buy-and-hold if they use good timing models (like the MIPS models)
Stay tuned...
Sunday, December 06 2015
We take drawdowns very seriously...
- in fact, we have comprehensive stats on drawdowns for all of the MIPS models
- we "track" them ourselves AND through 3rd party "tracking" companies (like TimerTrac.com, etc.)
- remember, our new algos were designed to both: (a) increase performance and (b) limit drawdowns.
A few things to look for in Max Drawdowns with all timing models are:
1) how severe is the Max DD ?
2) how many times per year do large DD's occur (and, what is the Average DD) ?
3) what is the "Average Recovery Time" ("ART") for the Max DD in the model ?
- Definition: Average Recovery Time = Max DD divided by the model's CAGR.
For answers to the above questions for MIPS4 trading SPY/SH, please refer to the two graphs below:
1) In Graph #1, you can see that the MAX DD between 2007-Jun'15 was 10.6%, but Graph #2 shows
a 13.8% Max DD in 2014-2015.
2) At the bottom of Graph #1, you can see that MIPS4 only had one DD greater than 10% in the
8.5 years between 2007-Jun'15, and the Average DD between 2007-Jun'15 was less than 5%,
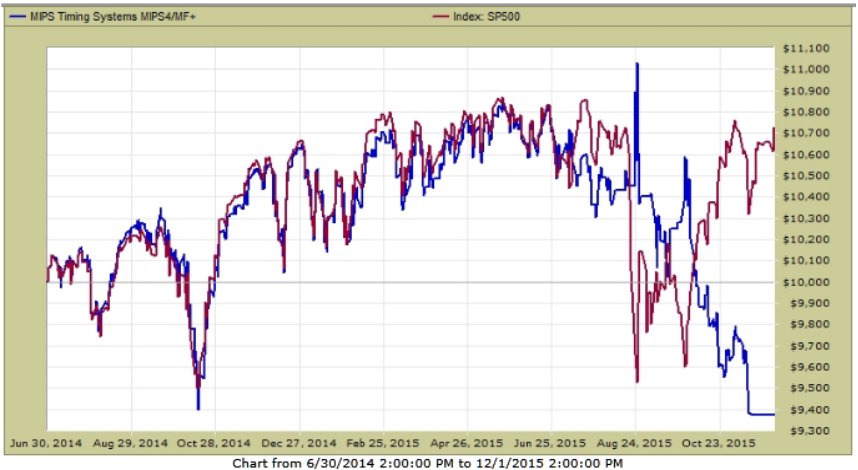
- but, MIPS4 did have a 13.8% DD between 2014-2015 (see graph 2).
3) The "Average Recovery Time" for the Max DD of 10.6% in Graph #1 is 4.2 months; and the "ART"
for the 13.8% Max DD in Graph #2 is 5.4 months.
Graph #1 - By StatsReports (Eric Stats)
CAGR = 30.5% Max DD = 10.6% Average Recovery Time = 4.2 months
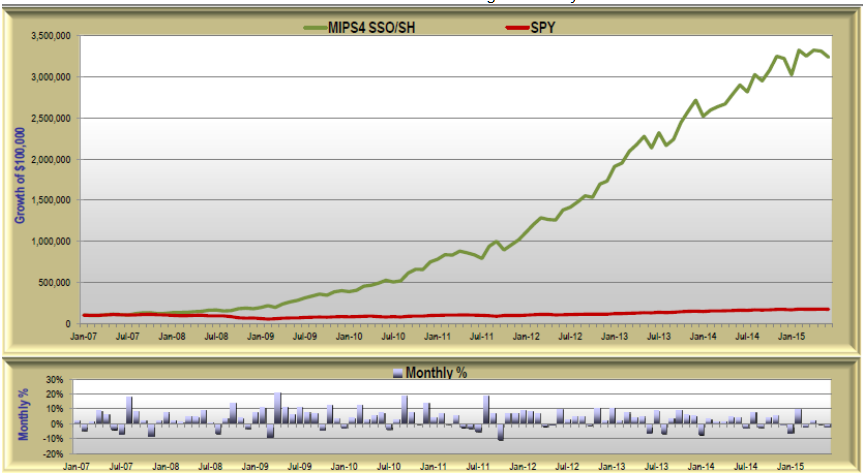
Graph #2 - By TimerTrac.com
Max DD = $9,380 / $10,880 = -13.8%
Not real pretty, but rather amazing for a model that has compounded out at over 30% (CAGR=30.5%, with no leverage), and made big $'s in 2008 (its younger brother, MIPS3, was verified up over 60% in 2008) !!!
So, stay tuned to MIPS !!!
- and enjoy the expected, long-overdue market crash in 2016...
Monday, November 30 2015
It would be foolish for us to say anything other than "our MIPS models have not performed well in 2015" !
- but, we have gone through these types of markets before (like 2011) and have experienced really good gains
from the MIPS models before and after those times.
In 2015, one of our worst nightmares came to light, and that is an extended, flat market that changed direction
every few days. Trend following models can "break down" in these types of markets. We experienced a similar
market in 2011, so we developed and built into the MIPS models several new algorithms that would "take the place" of trend following algorithms in these types of markets, and we really thought that we had solved the "entire" flat-market problem.
Then, along came 2015, where the Indices (Dow, SP500, etc.) set records for:
(a) the duration of a tight, flat trading range,
(b) the number of directional changes in 8 months of any year in the Dow's history,
(c) the market changing direction over-and-over in very few days (like 3-6 days) for months on end, and
(d) one of the largest one-day drops for the Dow in the last 50 years.
Needless to say, our "flat market" algorithms from 2011 were not enough to prevent getting whipsawed in 2015.
So, we have recently gone back to the drawing board and developed new proprietary algorithms that:
(a) track and calculate the "frequency" of the directional changes, and
(b) when the directional change frequency is only a few days several times back-to-back, the models will
"shut down" (go to cash) until the volatility dies down.
We have started using a preliminary version of the final release at these new algorithms at this time.
OUR PERFORMANCE BETWEEN 2008-2015
The goals that most intermediate-term model developers follow are to:
1) Do as well or better than the Index they are following (in our case the S&P500) in up markets and beat the market soundly in down markets. Of course, in up markets, the only ways to beat the markett (i.e., to beat the index you are trading) are to:
- identify and trade "intermediate-term" opportunities (trade-able dips, 20% "corrections", etc.), and/or to
- trade with some leverage (e.g., 1.33x leverage by trading 2/3 SPY and 1/3 SSO on long signals)
- we do not use leverage on shorts, so we either short the SPY (recommended) or buy the inverse SH.
2) Beat the market soundly in down markets ("crashes"). Our minimum goal is that we "gain" at least 1/2 of the total percentage that the market "loses" in a crash (e.g., market down 50%, MIPS up at least 25%).
- all of the MIPS models did way better than that in 2008.
- MIPS3 was live then and its "gains" were verified by TimerTrac.com (see the Graph #2 below).
BTW, everyone that has been in the market for 10-20+ years would have had unbelievable performance if they had somehow just "avoided" every market crash, and started their up-trend ("recovery") where these markets "peaked" rather than where they "bottomed" (i.e., no losses in the crash). A good timing system would do even better by just "keeping up" in up markets and making some money during market crashes. It is not difficult to calculate how much money you would have if you just "avoided" the two market crashes since 2000; and, of course, you would have made even more if you had been short at the right times in the "big falls" (as MIPS3 did in Graph #2 below).
Note: When we show performance results from the "MIPS models" we normally use MIPS3/MF because that model has been in use and verified by TimerTrac.com since 11/04/2005. But, please be aware that MIPS4 is a much better model than MIPS3, but it does not have as long a verified track record as MIPS3
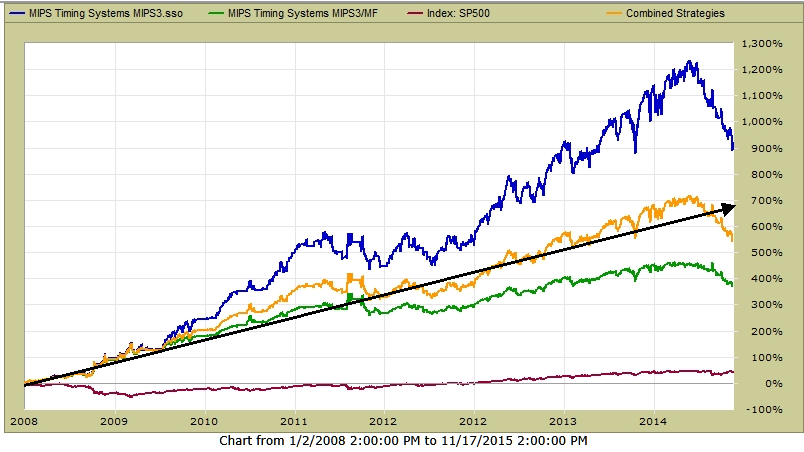
- in 2007-mid'2015, MIPS3 was up about 380% and MIPS4 was up 880%, when the SPY was up only 90%.
Exactly what does TimerTrac.com say about the MIPS3 performance since since 2008...
Please refer to the graphs below from TimerTrac.com (with 1.0x, 1.33x, and 1.5x leverage), where:
Graph #1 - MIPS3 in 2008-Nov'15 trading 1.33x leverage on Long signals and 1.0x on Shorts (Gold line)
- Note that the Green line in the graph is with 1.0s (no leverage)
Sure we have had somewhat bad periods in 2011 and 2015, but MIPS3 recovered after 2011, and should after 2015
- even with its not-so-good 2015, MIPS3 is still ranked #1 by TimerTrac.com from 2008-2015, and it is way ahead
of the 2nd ranked model.
GRAPH #1 2008-15 SPY = +124% MIPS3 w/1.0 leverage +380% MIPS3 w/1.33x leverage = +550%
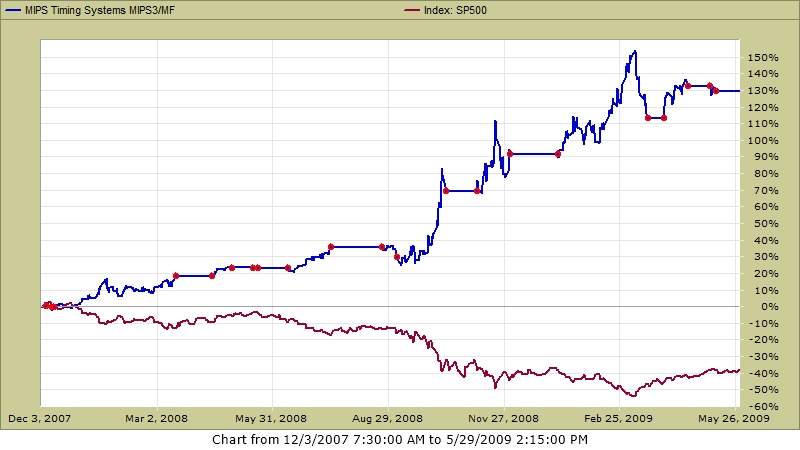
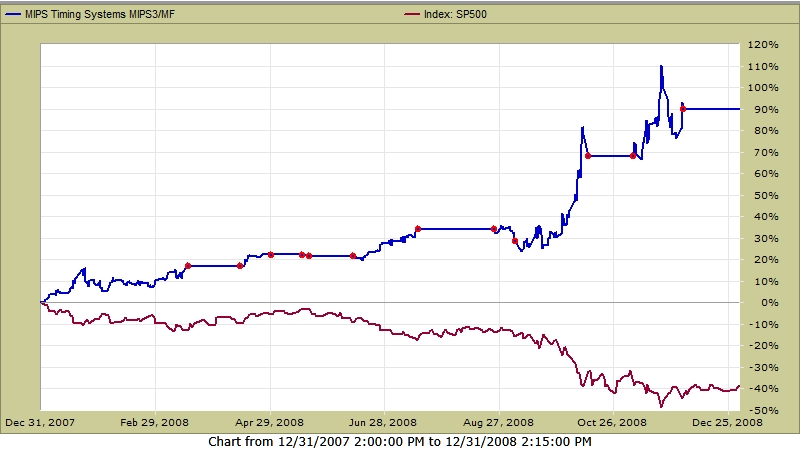
Graph #2 - MIPS3 in 2008 -May'09
- trading the 2008 market crash , with no leverage
- red "dots" on graph show "trades"
SPY = -40% (yes, -40%) MIPS3 = +130%
Going Forward into 2016 ...
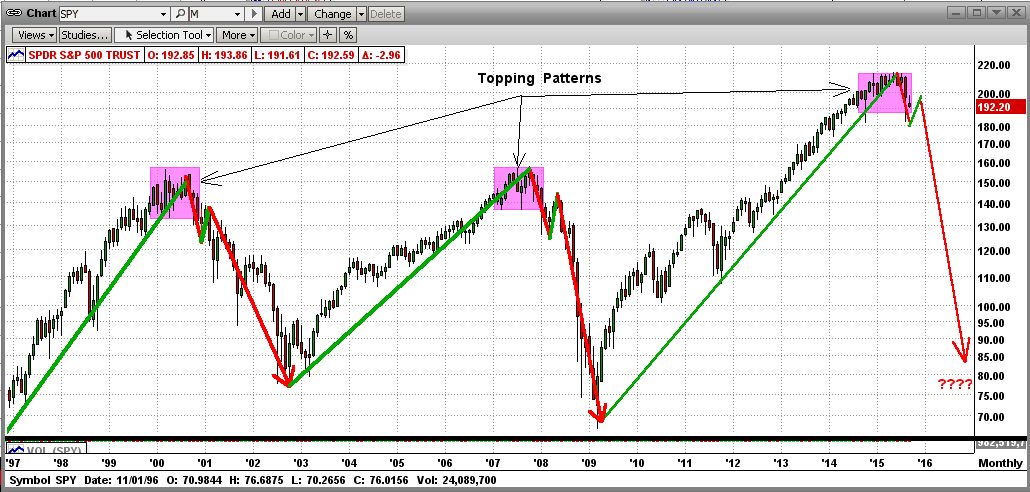
We still believe that this market could be "topping" now, thereby signaling a big crash before the end of 2016.
- this is why every individual investor needs a tried-and-proven timing model to help them avoid a 50% market crash.
- see the graph below to see the "topping" processes in the 2000 and 2008 market crashes (not the "kickbacks").
Stay Tuned...

Hope this helps...
Sunday, October 18 2015
As you all know, MIPS has held steady on its recent short signal, but most do not know why. There are two overwhelming reasons for this:
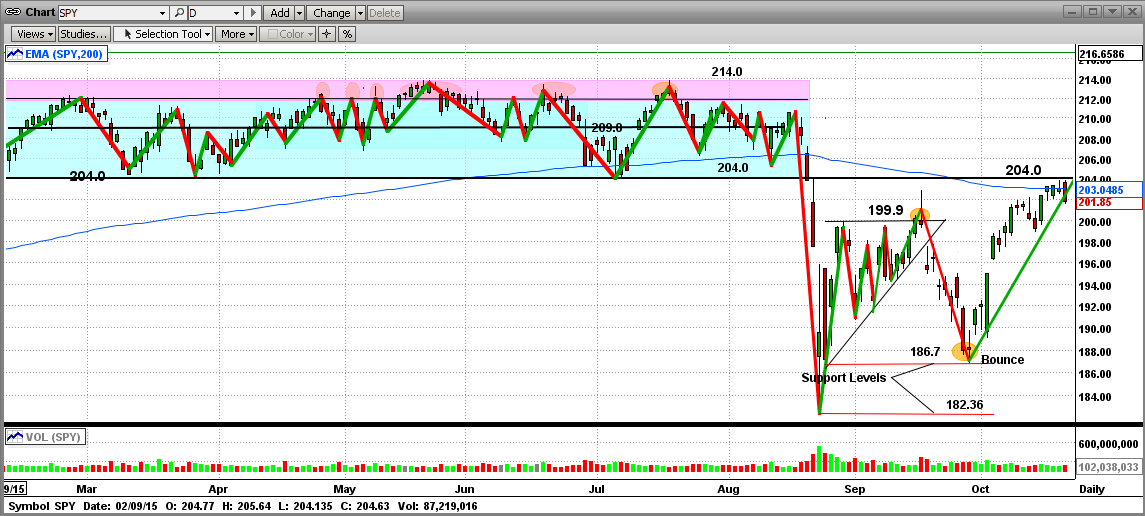
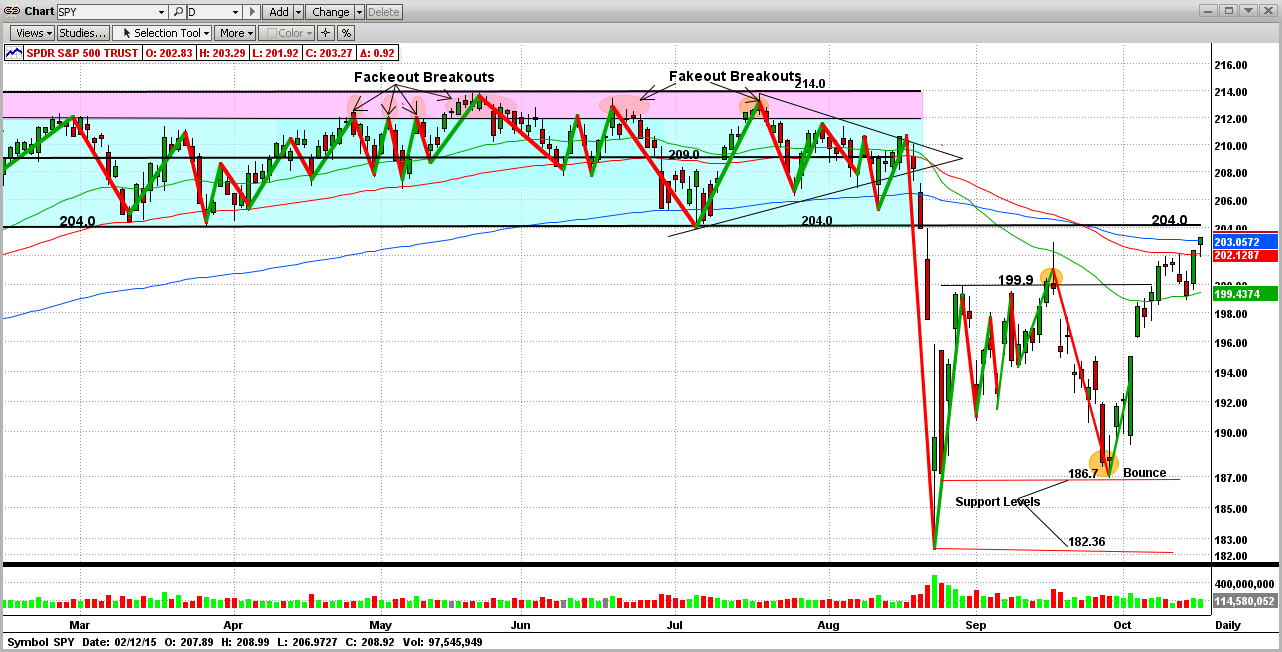
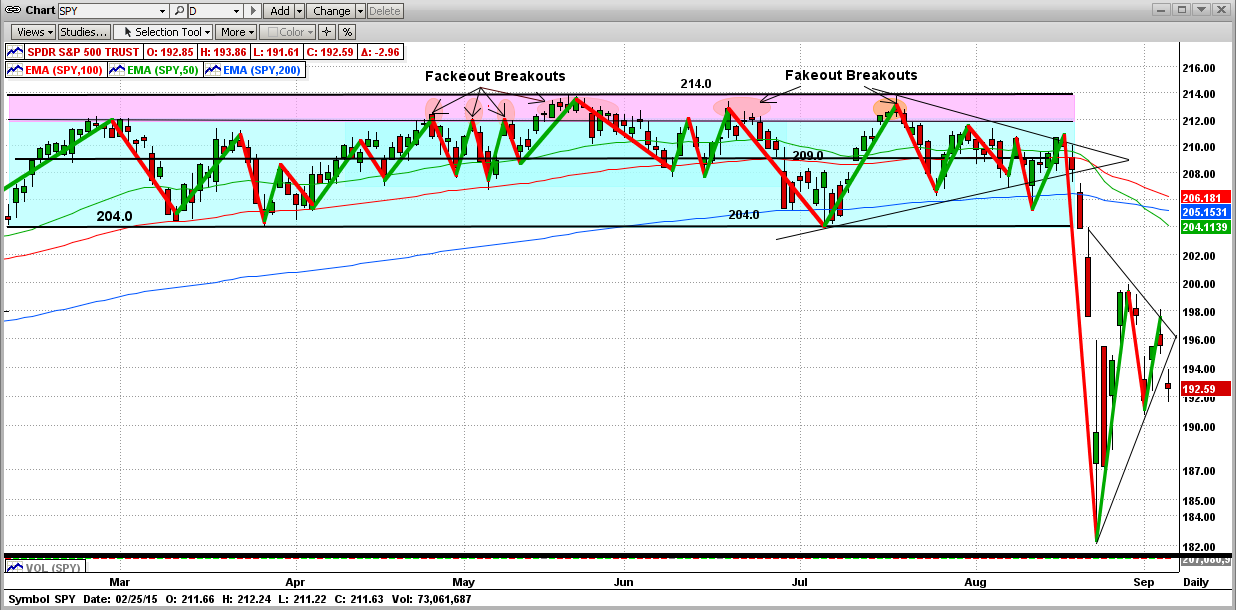
I.) After the big drop, the market has since bounced back and is going to test its most recent "support" level; which, of course, is now a strong "resistance" level at 2040 on the S&P 500 Index. Nothing new here, as the market almost ALWAYS goes back to test its "breaking points". MIPS most likely will not change its position until the SPY finishes its "shoot out" at 204.0.
Graph I - Critical Point for the SPY now - New massive "Resistance" at 204.0; which was the OLD major
"Support" level for the 9 months of Mar-Oct 2015
- this recent rally in the SPY went through the 50-EMA (green), the 100-EMA (red), and the
200-EMA (blue) like they were water
- it will be facing 204.0 soon
- this will be a CRITICAL TEST (if the SPY breaks above this, the bears will have to "give up").
II.) The second thing that MIPS is choking on is the "topping patterns" in 2000, 2008, and 2015. Almost all pattern recognition algorithms recognize the recent behavior of the SPY as a "topping pattern", which is where the big guys dump for 10-12 months to lighten their positions in anticipation of a big drop. Of course, this is easy for them to do because they "cause" big drops whenever they decide to. Only the little guys suffer in the following several years. And, the market DOES NOT have to always come back quickly (look at the Dow in the 1930's and the Japanese stock market since 1990).
Graph II - Long-Term View
- almost identical "topping patterns"
- market looks ripe for the next "Big One" (big drop, that is)
- and notice the "kickbacks" in the big drops in 2000 and 2008 (like what is happening now)
- it still looks a little early for the 'big one", but it can happen at any time
- but, of course, the market can continue to rally higher from here 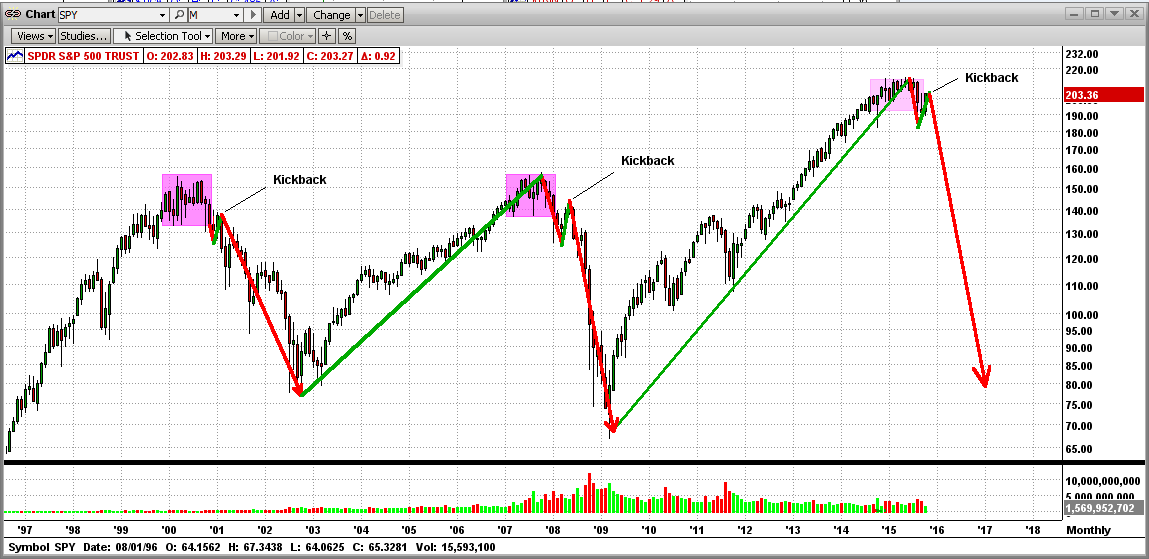
Stay tuned...
Monday, September 07 2015
Many MIPS members are asking us if we think that this market in 2015 is headed for "A Crash or A Correction". My answer, of course, is that nobody knows for sure.
From an economic viewpoint, things look "bleak". The US economy is not in good shape (barely growing at all); the Fed is getting ready to mess things up again; China is in deep trouble as its growth rate is slowing dramatically and its stock market is about to collapse; Japan is stagnant; Greece is still waffling; etc.
From the view of technical analysis, things are just as bad! Different charts show different outcomes (more below). And, even if all of the charts in the world agreed today, that DOES NOT mean that they can predict the direction of the market next week or longer.
What this equates to is that the only hope we have to determine the intermediate-term direction of the market is a good mechanical, mathematical timing model that can interpret the near-term directional changes in market trends as they develop (not daily, and not for 6 months from now, but more like the weekly/monthly trend). And, of course, that is what the MIPS models do, and do well.
Back to technical analysis of the market price movements and charts... Of course, technical analysis would not still be around if it did not as least show us the "probable" moves of the market and when certain directions are highly possible. However, many times there are contradictory views, and that is where I think we are now. See a brief explanation of this below.
The Case For a Market Crash
Without going through the details, many chartists think that the market is in a "Topping Pattern", where the big guys (institutional investors) are dumping heavily to prepare for a big market crash (one that they are basically causing). That happened both in 2000 and 2008 (and probably preceding all market crashes).
The chart below is what is driving this belief of most chartists today. See the graph immediately below. Does the market behavior today look very close (i.e., almost identical) to the markets in 2000 and 2008, when the fat kats took away 40-55% of our hard-earned money in two big crashes? If so, why not just go to cash now and wait out the drop? Read on...
The Case for a Market Correction
We do not have to simply bet on this "big drop" now, and possibly be wrong and lose big $bucks$. It is possible that the markets now may NOT be heading toward a "Crash" (like in 2000 and 2009), but merely to a "Correction" (like in 2011). The "chartist" evidence for a Correction below is almost as compelling as the evidence for a Crash, as above
The Market in 2015
The Market in 2011
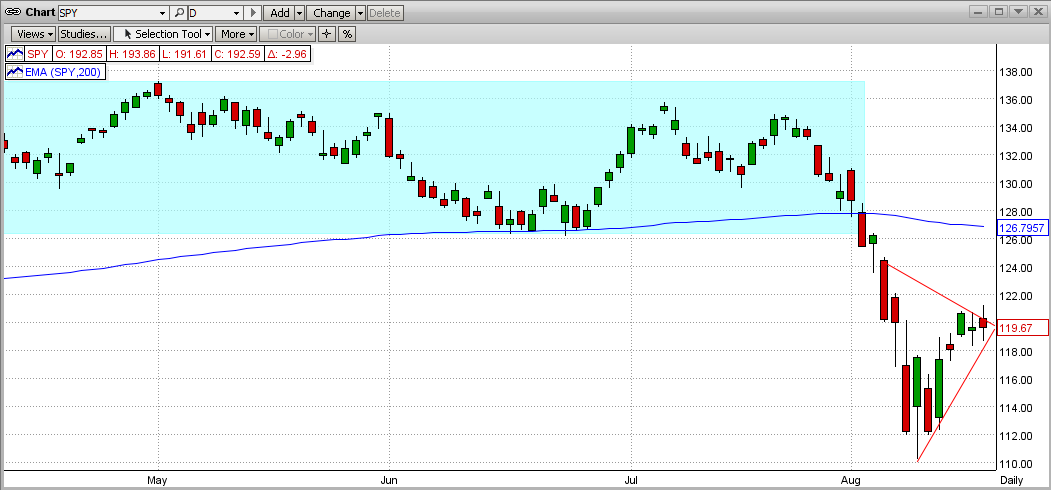
Compare the last two graphs above (2015 vs 2011). Do they look similar (or almost dead on)? Did the market in 2011 lead to a full blown market "Crash" as it did in 2000 and 2008? Read on...
The Market After 2011
Sorry, the drop in 2011 did not lead to a 40-50% "Crash", as you can see below in 2011-early 2012. The 2011 market suffered through a Correction and recovered to new highs over the next 3 years, before "flattening out" again in 2015. See graph immediately below.
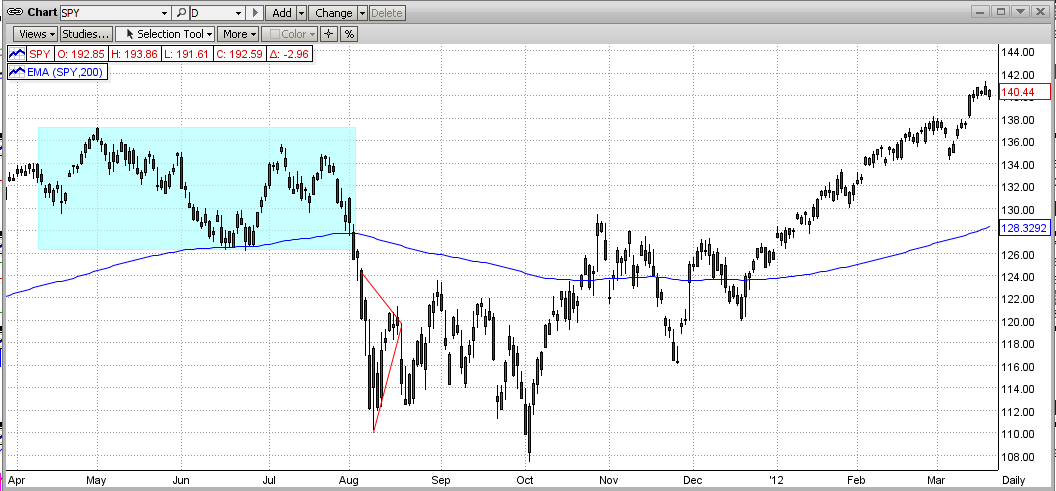
So, you see that trying to predict the market behavior beyond the scope of what you can see now is very dangerous. It's better to wait for MIPS to "drive us" in the right direction. After each "topping" process the market drops, and then seems to waffle for a relatively short while (like weeks) before it "breaks", and heads back up or continues down. This is a critical "trend change", and that is where MIPS shines (and what it is developed to do).
MIPS in 2008
it is easy for a market developer (like me) to "claim" that their model will do well in any type of market (like in a big bear market), but our MIPS3 model was "live" in 2008 and "tracked" by TimerTrac.com. And, remember, MIPS3 is also the "core" of all of our newer models, like MIPS4 and MIPS/Nitro.
So, see the graph below for how MIPS3 did in 2008... MIPS +90% SPY -40%.
(The red dots are trades.)
Sunday, September 06 2015
How has MIPS performed YTD in 2015 ?
2015 has been one of the toughest markets for timing models, mainly because of its volatility. It does not matter to mathematical models why the market is volatile (the Fed, Greece, China, etc.).
It is difficult for timing models to make money when the indices stay flat (plus or minus 2.5% around mean line), but change direction every 3-6 days (flat market in a very tight trading range). Most models will get whipsawed if they try to trade in a market like this (e.g., trying to trade every time the market "changes direction").
In the graph below, it can be seen that the 2015 market (aka the SPY) changed direction 28 times before it broke the flat trading pattern to the downside (starting on 8/19/15). That is a directional change (short-term trend change) every 4-6 days. Most timing models that tried to trade these "swings" got cremated. Through the end of July 2015, the MIPS models traded only 3-4 times, and was slightly ahead of its index (the SPY) at that time. And, all MIPS models issued a CASH signal on 8/18/15, the day that the "big drop" started !
MIPS in August 2015
ONE BAD DAY
So far, so good. MIPS issued a Cash signal on 8/18/15. On that day, the SPY closed at 210.0 and it opened the next morning (8/19/15) at 209.1. By issuing a Cash signal on 8/18/15, MIPS avoided a lot of "damage" until 8/21/15 came along. On 8/20/15, the SPY closed at 204.0 while MIPS was still in Cash, so up until that time we had avoided a drop of about 2.4%.
But then, starting on 8/21/15, all hell broke loose. In two trading days (Friday and Monday), the market experienced extreme volatility and dropped dramatically. On Monday of 8/24/15, the SPY hit an intraday low of 182.4, a drop of 10.6% in two trading days from the 8/20/15 close. That extremely large two-day drop resulted mainly from the one-day drop of 15.2 points in the SPY from the close on 8/21/15 (Friday) to the intraday low on 8/24/15 (Monday). This is roughly equivalent to about 150 points in the S&P 500 Index, and a near 1200 point drop in the Dow). This day was one of the largest one-day drops in the history of the US stock markets. Wow, that really was ONE BAD DAY !!!
MIPS issued a short signal on 8/21/15, which of course was executed on the open of 8/24/15 at 187.5. This was near the low and when the SPY was ready to "rebound" from the dramatic drop. After MIPS issued a cash signal on 8/27/15 (three trading days later), this one trade had lost about 6%. In effect, we "shorted" very near the bottom - ONE BAD TRADE !!!
For a model like MIPS4 that compounds with a CAGR of approximately 25-30%, this is like a "blip", so don't worry (see the MIPS4 growth graph at the bottom of this blog).
Please remember, whether a timing model did well on this one-day drop or not is basically pure luck. One bad day can happen at any time, and no timing model can consistently predict any one day's price action to the day. In this case, it stands out because the one-day change was so dramatic. This one-bad-day was going to happen whether MIPS (or any other model) was long, short, or cash. Good timing models recover, like MIPS did in 2011 and should do again in 2015. After a flat 2011, MIPS3 was up 9% in 2012 and 23.3% in 2013.
MIPS4 in August 2015
(Red dots are Trades dates)
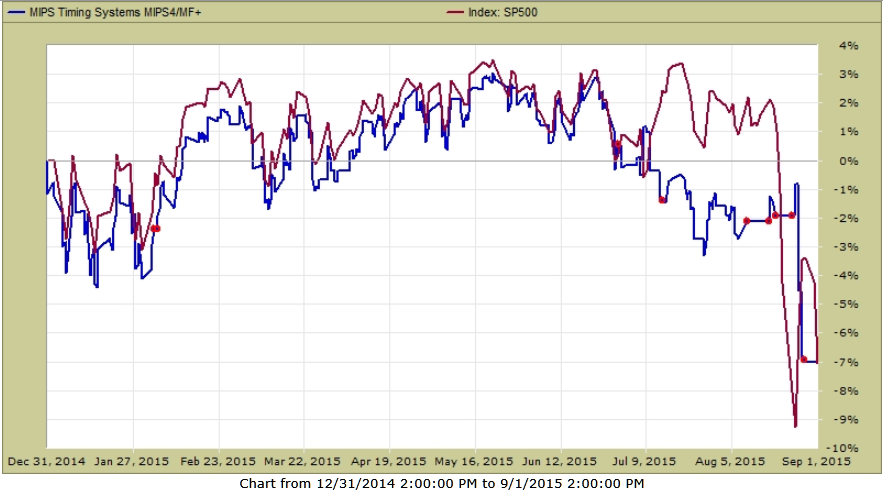
MIPS YTD in 2015
The graph from TimerTrac.com below shows the MIPS4 performance YTD thru August, 2015 (you can see the "one-bad-day" in the graph).
As discussed above and can be seen in the graph below, MIPS was hanging in there until late August, when MIPS was down only 2%, while the SPY was down 9%. Then the one-bad-day came along and upset the cart.
Now, through August 2015, MIPS and the SPY are both down about 7%. So even after all of the hoopla and "bad luck", MIPS has not done any worse than buying and holding the SPY.
MIPS4 YTD in 2015
(Red dots are trade dates)
MIPS3 in 2008
Whether this drop is a correction or the beginning of a market crash, we have plenty of time to make money, After backtesting in 1987 and 2003, and observing MIPS live in 2008, we feel 99% sure that MIPS will make us money in down markets. See MIPS3's "actual performance" graph in 2008 as "verified" by TimerTrac.com immediatelybelow:
MIPS3 in 2008
(Red dots are trade dates)
MIPS4's Long-Term Performance (2003-2015 ytd)
o When looked at from a "Long-Term View", the ONE BAD DAY goes away !!!
- So, don't let one-bad-day scare you away...
Stay tuned…
Sunday, August 09 2015
MIPS Members:
Since the markets (as measured by the S&P 500 and/or the Dow) have been moving sideways for over 7 months now, lots of people are saying, "This market makes no sense at all." Are they right?
Maybe or maybe not. It is very difficult to get to where you want to be if you really do not know exactly where you are now; or if you do know where you are now, but you do not have a clue as to how to get where you want to be from where you are now. The current stock market fits both of these situations.
What is confusing is that many investors do not not know how to determine where the market is now and where it might go from here. To show you what we mean, we will look at the current market from several slightly different viewpoints:
1) Short-Term movements in the markets (SPY) - Indeterminate
- Daily movements over the last 6 months...
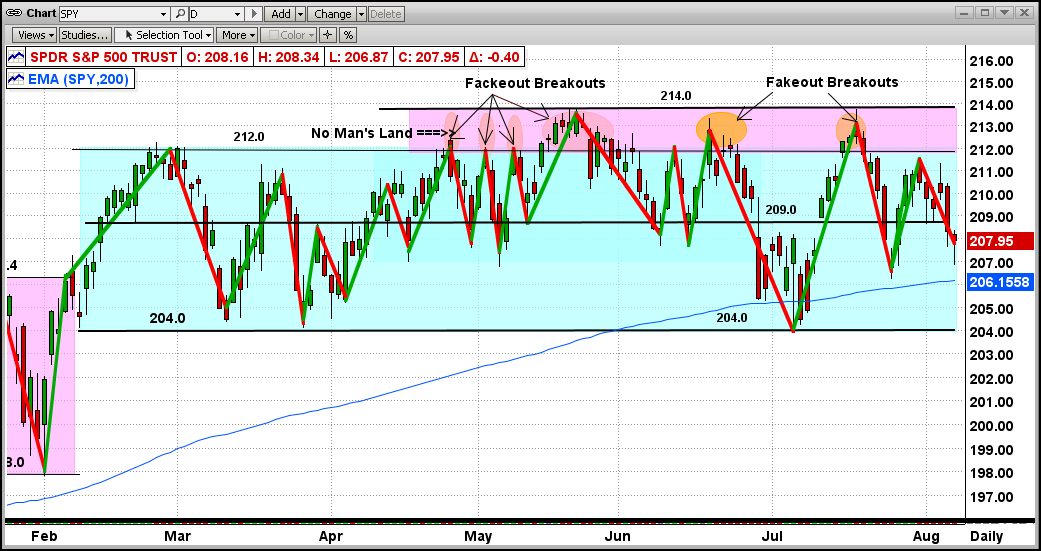
The graph below shows the SPY over the last 6-7 months. It seems obvious that, from the things that we can see, it is almost impossible to determine anything useful. The SPY has traded in a tight sideways "channel" of plus and minus 2.5% around its meanline of 209.0 over the last 6 months and the market has changed direction 24 times in this 6 month period. That represents a change in direction about every 5 days !!! Most of the time, trying to react to this rapidly changing behavior (like by trying to trade faster) will lead to getting horribly whipsawed. Let's try to ascertain more from looking at this very same market period from slightly different vantage points in 2) and 3) below.
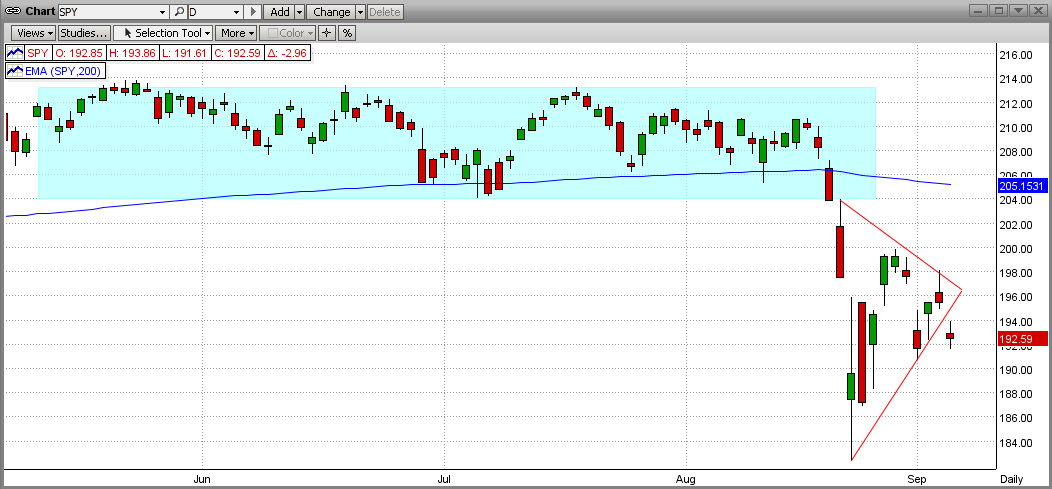
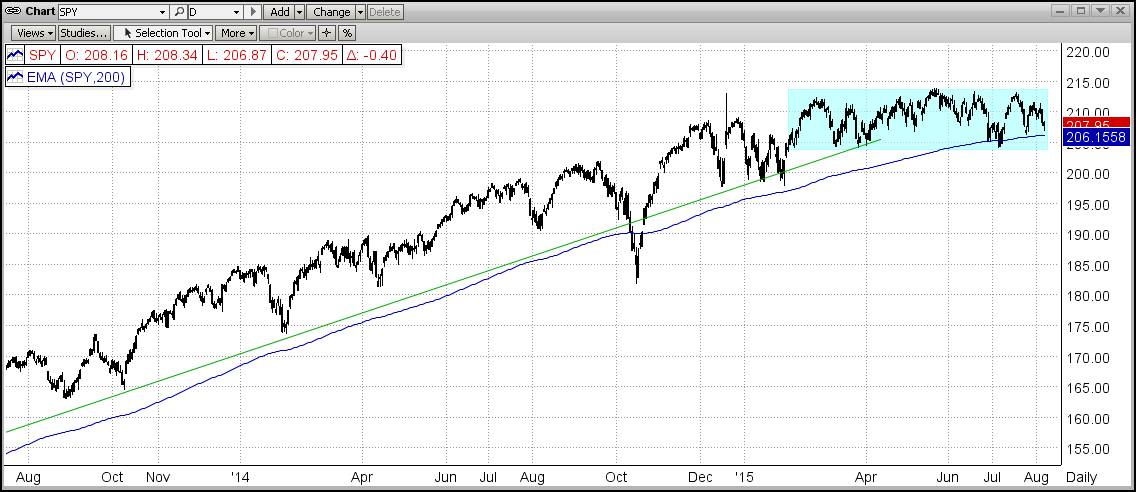
2) Intermediate-Term movements in the markets (SPY) - Bullish
- SPY in the last 2 years...
The graph below shows what the time period above (Feb-Aug 2015 in the blue rectangle below) looks like by "backing up" over the last 2 years and viewing where the market has come from to get where it is today and where it might go from where it is now. It can be seen that the SPY had been in a steady uptrend until Feb'15, where it stalled and went into a very obvious "Consolidation Pattern". While in this pattern, neither the bulls nor the bears would "commit" their money to pushing the market out of this tight trading pattern. The bulls buy the market up to its "upper" resistance level at (SPY at 214.0), where the bears come in and sell the market back down to its "lower" support level (SPY at 204.0), over and over again.
An recent study has shown that there were only 10 times since 1950 where the S&P 500 traded in a tight 3.5% (or less) trading range for 6 months or more. And, every time this happened, these flat markets broke to the upside over the following 6 months (average +6%). This is an interesting "statistical" metric and one to pay strong attention to, but there is really no solid reason for similar behavior for the remainder of this year. [BTW - In our case today, the SPY has traded in an even tighter trading range (2.5%) over the last 6 months.]
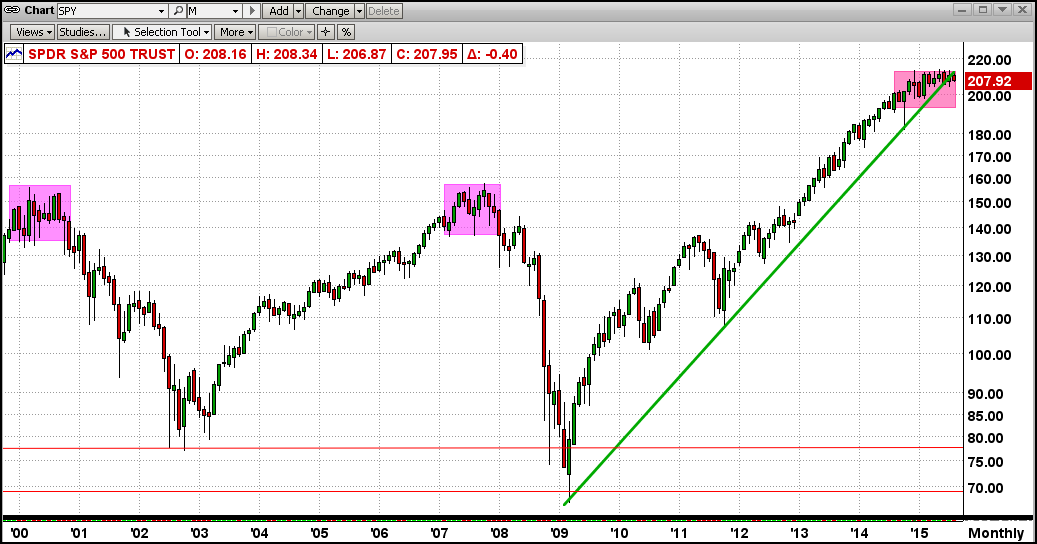
3) Long-Term movements in the markets (SPY) - Bearish
- SPY in the last 15+ years (with monthly bars)...
See the purple rectangle in the upper right in the graph below. This could very well be a so-called "Topping Pattern", like the two that preceded the big market crashes in 2000 and 2008. In both of these previous market crashes, the SPY traded in a tight plus/minus 5% trading pattern around its meanline for about 12 months each time, before crashing about 50% to the downside. In today's market, the SPY has "topped" for just about 12 months now, leading to fears of another big drop relatively soon.
BTW, my definition of the "topping pattern" behavior is a market where the big guys decide to unload most of their then current holdings over a relatively long period of time. This "dumping" process by the big guys takes a lot of time to implement in order to prevent stock prices from being driven through the floor before these fat kats unload the majority of their long positions. The fat kats sell and drive the market down 3-6%, and then they quit selling and let the little guys "buy on the dips" and push stock prices all the way back up the the top, where the fat kats start selling again. This goes on until either the little guys are fully invested and cannot buy the prices back up, or the fat kats have unloaded most of what they wanted to unload. And then, the fat kats start selling short. Along with the fat kats shorting, the little guys go into "panic selling" and drive the market down 40-50%. Of course, at this time, any big "catalyst" (like a big market crash in China, a surprise from the Fed in rate hikes, etc.) could expedite such a crash.
Obviously, none of us know what will happen from here but the above clearly defines where we are now and what could happen soon. The good news resulting from the current long-term flat market is that the MIPS "triggers" are now like "hair" triggers, and hence MIPS should react to either an upside or downside market move quickly.
Stay tuned...
PS - Please do not ignore the possibility of a big market crash and protect your nest egg now. Contrary to the outdated buy-and-hold philosophy, the next big drop will most likely NOT bounce back in the following 5-7 years as it has in the last 50 years, mainly because our economy has slowed down considerably (baby boomers no longer working, stronger competition from abroad, etc.), and the Fed cannot possibly "buy the market back up" again.
The recovery time of the next big market drop could be 25-30 years, like that after the market crash of 1929 (it took almost until 1960 for the market to reach the high of 1929, and stay above it). Or, it may be like the 35-year "non-recovery" of the stock market in Japan (the Nikkei), which dropped from 40,000 in 1980 and bottomed at 10,000 in 2010 (-75%), and which is only 20,600 today (still down 50% over the last 35 years). SO, A QUICK RECOVERY TO THE NEXT MARKET CRASH IS NOT A GIVEN !!!!
|
Thursday, July 16 2015
I received an email today from a loyal MIPS member and his opening line was "Up, Up, and Away!!!". As Robert explained, he is thinking (and hoping) that the acceptance of the aGreekment by the Greek Parliament will clear the slate for worldwide markets to go up from here. I am in the same boat, but at this point, I would say "Up, Up, and Away???"
As I told Bob, the 3 "Things" controlling the market that I mentioned in one of my recent blogs (see below), have all dissipated.
1. The Greeks caved in,
2. China "fixed" its stock market bubble problem by "outlawing" trading, and
3. Aunt Yellen repeats that there will be rate hikes later, but they will be small and gradual (thank
you, Aunt Yellen).
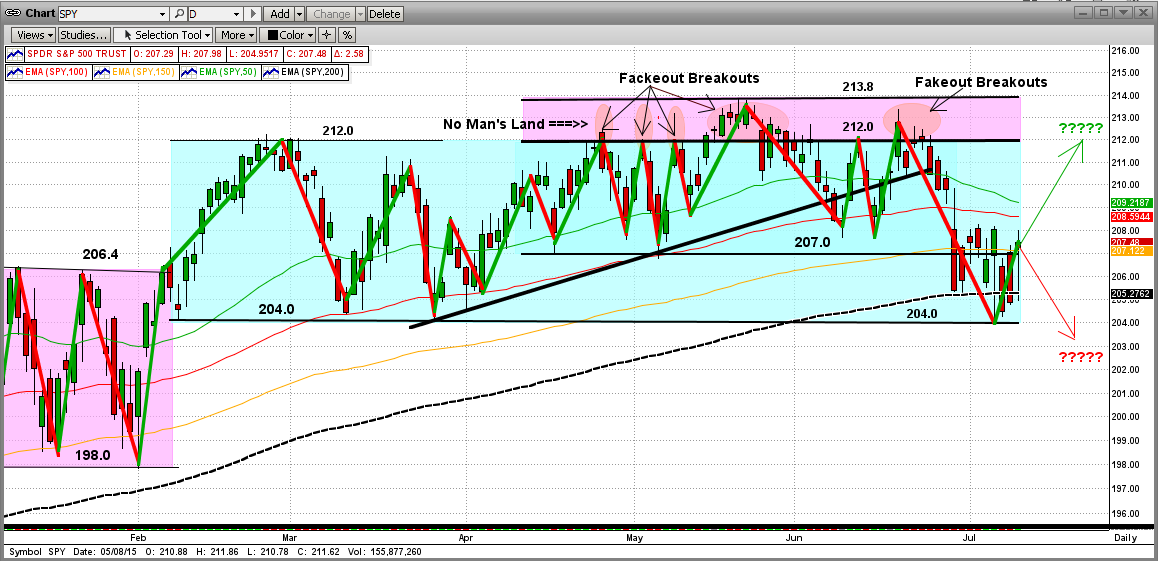
I will remain hesitant until the recent rise in the SPY "plays out". In the graph below, you will see that the SPY has risen from $204 on 7/7/15 to $212 on 7/16/15. That's about +4% in 7 trading days. And, the SPY moved into what we call "No Man's Land" today.
The real challenge lies at the all-time high resistance level in the SPY at $213.8 (from two months ago on 5/20/15). We are now less than 1% below that level, but would need to break above it with some degree of "force" (like maybe a big "gap" up), and stay above it for a while.
If that happens we can expect some significant gains; but if not, the outcome will most likely NOT be pretty.
Either way, MIPS will "map out" what we should do, so we should make money either way.
STAY TUNED !!!

==================
<<< Previous Blog >>>
7/2/2015
MIPS Members:
Here we go again. The markets are trading back and forth, with no clear direction. That is because there IS no direction, other than sideways. And, as we have said many times before, sideways or flat markets result from uncertainty amongst everyone in the market. The volatility you see in flat market comes from the floor traders that can trade with up to $200 billion in a very short time period. Their time horizon is in minutes/hours, NOT days/months like us. The floor traders can trade long in the morning and short a few minutes/hours later, often more than one round-trip per day. The ignorant little "day traders" usually get whipsawed trying to trade in these types of markets.
The uncertainty in the recent past has been about "nothing". The market has been mainly focused on things going on in Greece, China, and the Fed. The events surrounding all of the above are all very important, but most likely have very little long-term ramifications for the USA.
Greece
There are really only two choices in the current Greek situation, and neither will greatly effect the USA. Why? Because, the GDP for Greece is less than that of most states in the USA and even less than some of our larger cities. Where Greece can affect the USA/Europe/the World is if it causes great pain in the Euro Zone. I don't see that happening; but, of course, it could.
China
After a stock market "bubble" of almost unbelievable growth (kind of like our 1990-2000 tech bubble), the China market fell over 25-35% in the last 3 months. About 85% of the stocks on the China stock exchange are owned by the "little guys", who have been coming in to the Chinese markets in record numbers (mostly on margin). Of course, that is a recipe for disaster. The Chinese gov't. handled it this way - they made it against the law for big guys to trade for several months. Simple in a communist state, but not so here. Anyway, short-term this stopped the slide and their markets have even bounced back almost to their "pre-crash" levels (no harm really done outside of China).
The Fed
The Fed has been awfully quiet and timid about raising interest rates even just a little. Aunt Yellen, the STOCK MARKET HERO, is not going to do anything to upset our markets, so you can rest easy here (at least for 2015). Of course, the press will probably scream "Disaster" when the Fed first raises rates, even if only by 1/4 of 1%; but it should not get much attention from investors or cause any noticeable pain.
Here is where we stand now:
So there you have it... nothing out there now to upset our markets, but the big guys and the press can make a big issue out of any news (no mater how important or unimportant), and put the market on a new trend of their choosing (up or down).
In the graph below, you will see that the market dropped about 4% in the ten trading days between 6/8/15 and 7/7/15, and has bounced back some since then. The market movement in the next few days will depend on what happens in Greece, and then it will go on from there on the next wave of useless news.
But, we still need to know how to trade this market; and for that we will depend upon the MIPS signals.
Current MIPS Signals (MIPS Members only)
MIPS 1,2,34 Signals... http://www.mipstiming.com/current_signals
MIPS/Nitro Signals..... http://www.mipstiming.com/current_nitro_
Monday, July 13 2015
Re: Announcement from the European "Liars" this morning...
Bull S... Deal
Agreement finally reached in Greek financial crisis
After months of acrimony, European leaders announced a breakthrough early Monday, avoiding an exit from the euro and a global financial crisis.
Reality
This Agreekment is not a final deal. It is an "agreement" just like their last 100 agreements; that is, "to Agree to try to Agree again". For the deal to actually happen, the Greeks must start doing their part by Wednesday of this week in order to "start formal negotiations". What the heck was the "deal" that they all announced this morning, an "informal agreement"? And, after that, any "formal" deal will have to be passed by the Greek parliament and many other Eurozone members. What kind of a "deal" did they announce today ?
Needless to say, the Greek public is very disappointed with this current deal, as the terms are much worse for Greece than the deal the public voted "IXO" against in their recent referendum. This could have a VERY negative impact on the Greek Parliament's vote to accept such terms, so this is not the end.
The "Greek deal" is still up in the air.
|


