Thursday, December 27 2012
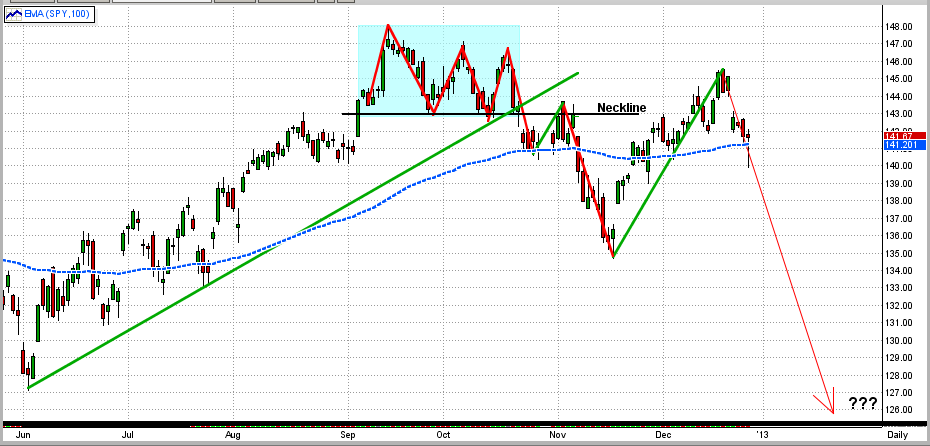
We got a real scare in the market today as the stock market fell more than 1% after Senate Majority Leader Harry Reid said that is unlikely that a deal could be reached in Congress before the Dec. 31st "deadline". This made us revisit our thoughts that we may be on a downward path in an eerily similar fashion to that in 2007-08 (see the graph immediately below and the first graph in our "Previous email"). Had the rapid fall continued, this could have been a grim day for the bulls. It is good to note that the pullback of the last 4 days has been on low volume.
On the positive side for the bulls, the SPY experienced what could prove to be a "one-day key reversal" where the market drops dramatically on a day following a short-term pullback, but recovers and closes above or near its open on that same day. Also positive is that the SPY broke its 100-day EMA, but recovered and closed above it (blue dotted line). Of course, this DOES NOT MEAN that the downward move is over, but it is a good sign.
We all know that the market's next short-term move is going to depend upon any progress (or lack thereof) in the negotiations in Congress regarding taxes and spending cuts and whether concrete progress is apparent in avoiding going over the "Fiscal Cliff".
It is impossible for any of us predict the outcome of these negotiations, so we will have to wait until these negotiations progress (or stall), and let MIPS decide what we should do.
Stock Market Crash of 2012 ???
Saturday, December 22 2012
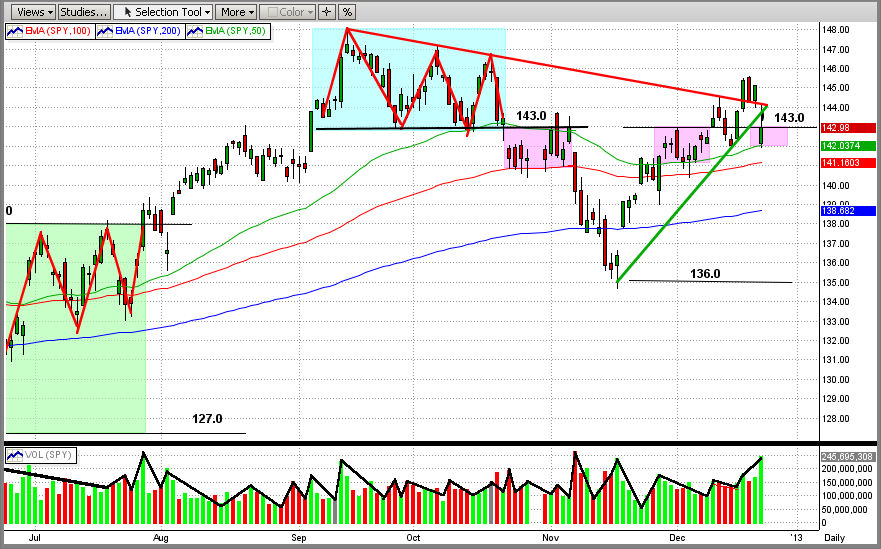
Responding to the bad news from John Boehner that he was calling off the vote in the House on the GOP's "Plan B" to avoid going over the "Fiscal Cliff", the SPY (and all other USA markets) fell substantially Friday. The SPY opened on Friday at $142.17 (approx $1421.7 on the SP500), which accounted for the downside "gap" of -$1.93 (or 1.34%) from Thursday's close of $144.10. Then, the SPY gained back $0.62 to close at $142.79, for a total loss of-$1.31 from Thursday's close (see the graph below). This $1.31 drop equates to approximately -$13 on the SP500 (or almost -1%).
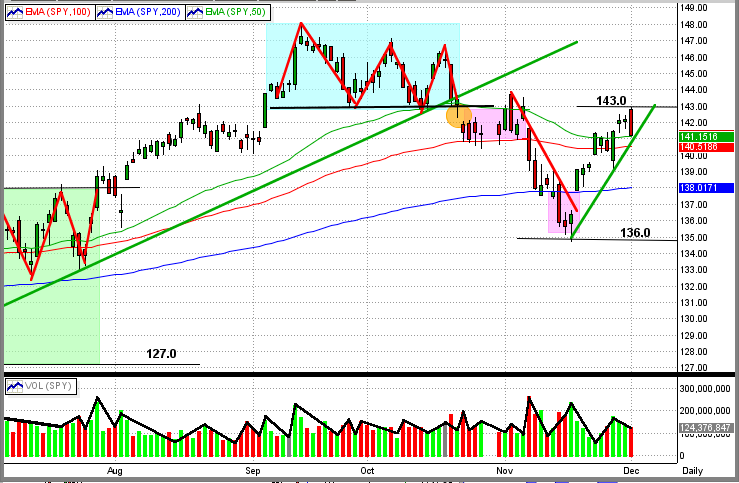
An interesting phenomenon has developed in the market around $143/share (neckline of the triple top).
1) In late Oct/Nov, the SPY bounced between $143 and the top of the 100-day EMA for 2 weeks, and
then fell almost 5% to $136 (left-most pink box).
2) Then again in late Nov/early Dec, after bouncing off of its support at 136, the SPY came all the way
back and traded between $143 and the top of its 50-day EMA for 8 trading days, before it broke out
to the upside (middle pink box).
3) Unfortunately, the upside move did not last long, as the SPY again fell back to between $143 and
50-day EMA. This is where we stand now (right-most pink box).
4) If the SPY does not again challenge the $143 resistance and goes down from here, we would of course,
face an immediate correction.
5) On the other hand, another attempt by the SPY to break $143 to the upside would be its 3rd attempt.
We believe that, if the SPY does break above $143 on this 3rd attempt, the upside move will last a while.
But, if the SPY fails to break above $143, the immediate future could be very worrisome, or worse.
Of course, what happens to the US stock markets in the short-term (weeks) will most likely depend upon:
(a) what our "heroes" in Congress decide to do about our country's financial future (taxes, spending, debt),
if they can decide on anything at all, or
(b) if they will continue to prove that they are incompetent and can't get anything done, thus letting our
country fall over the "Fiscal Cliff" into a financial abyss.
[Sorry for my nasty tone in the above paragraph, but I am fed up with our congressional "leaders" on both sides.]
But remember, we can follow the above with interest but without having to decide which way the markets will go (or why), because we can rely on MIPS to tell us what to do, and when.
The above has nothing to do with the MIPS models, and are simply observations and/or opinions of the author.
Tuesday, December 11 2012
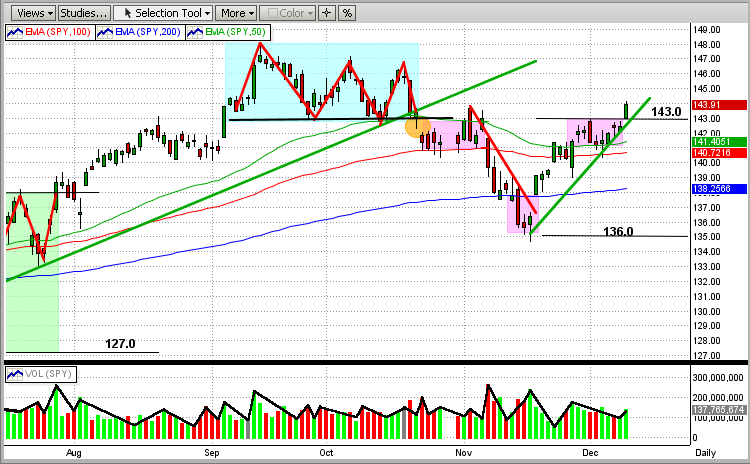
The previous email below was from 12/03/12, and was entitled "Year-End Rally or New Bear?" (2nd graph below).
After today's nice market gain, it seems like the "Year-End Rally" has won. All MIPS models are long, so that's a good thing.
In the 1st graph immediately below, you can see that the SPY danced between its 50-day EMA and the strong upside resistance level of $143/share (the neckline of the triple top) for almost two weeks. But, today the SPY broke out of this tight trading range and closed up at $143.44 on slightly higher volume.
We all know that one day does not dictate a new market direction, but today's breakout was impressive. If indeed this turns into a nice new intermediate uptrend (year-end rally), MIPS should stay long. However, if it turns south, we can expect MIPS to pick up the new downtrend and take us short. More later ...
Saturday, December 08 2012
Does history repeat itself? If so, does stock market behavior repeat itself? There are a lot of people that hope that it doesn't, but we know that many times it does.
The two graphs below are pretty compelling.
The first graph is a picture of the stock market crash of 2008, and the second one is the market behavior in 2012.
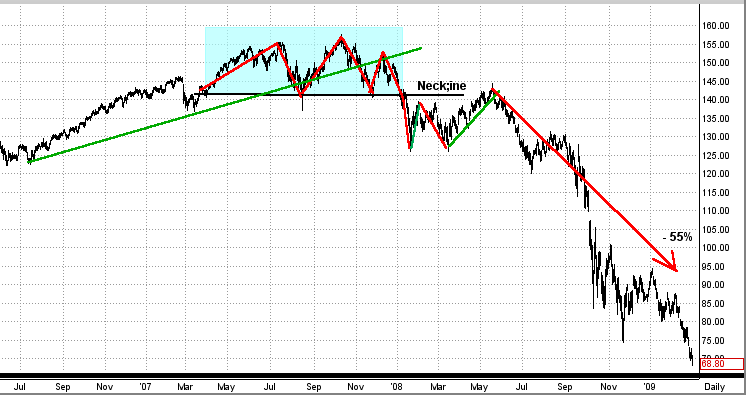
First Graph (2007-08)
In 2007-08 the SPY formed a triple top in the second half of the year. During that time, the SPY broke its intermediate-term trend line and then it broke through the bottom of the neckline of the triple top. After a fall through the neckline, the SPY re-tested the resistance of the neckline, fell back some, and then re-tested the neckline again. After two attempts to break the neckline to the upside, the SPY fell apart and dropped 55% !!!
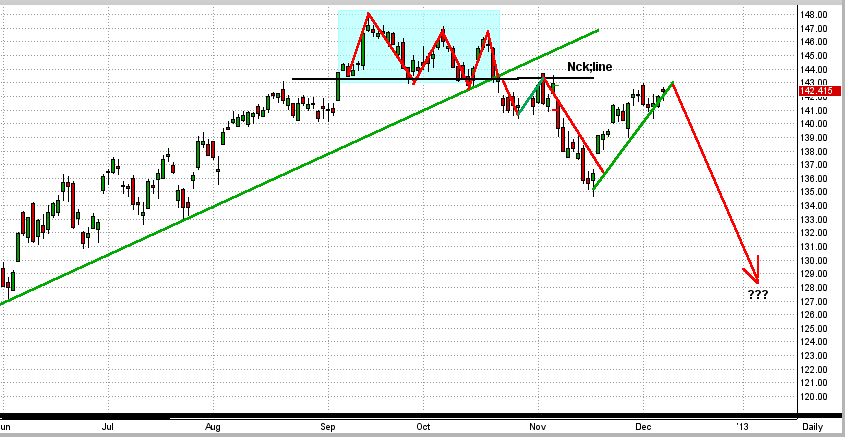
2nd Graph (2012)
In 2012 the SPY formed a triple top in the second half of the year. During that time, the SPY broke its intermediate-term trend line and then it broke through the bottom of the neckline of the triple top. After a fall through the neckline, the SPY re-tested the resistance of the neckline, fell back some, and then re-tested tested the neckline again. After two attempts to break the neckline to the upside, the SPY does what ??? (End of story for now.)
Pretty darn compelling and scary. Of course, the direction of the SPY (the market) most likely will show its hand in the next 2-3 months, and we will have either: (a) a booming bull market or (b) a big drop in the market. The good news it that, the bigger the move, the more we will make after MIPS determines the "new trend".
BTW- I follow MIPS, not the charts. But, over the years, I have found the charts to be a reasonable indicator (better than nothing). MIPS does not follow the the charts either; it is much more intricate than any one indicator.
Stock Market Crash of 2008 (graph is for the SPY)
Stock Market Crash of 2012 ???
Tuesday, December 04 2012
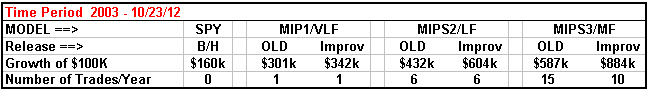
Good news, we are introducing new releases of our MIPS1/VLF, MIPS2/LF, and MIPS3/MF MIPS models that produce better results than our current models. The current models are very good, but the improved models ("Improv") are even better, with lower drawdowns and fewer trades/year. Please note that these are NOT new models, but simply revisions to the current models. Therefore, all models will retain their current names. BTW, "Improv" is an in-house project name for the development of these new models, and this name will not be used commercially. In this email, any reference to "Old" models means the current ones.
Of course, the past performance on our website and the past performance verified by TimerTrac.com will not change (can't change the past). But, our "release" process requires that we extensively "backtest" all new models (like the "Improv" models) to verify that they perform better than the current models over all time frames.
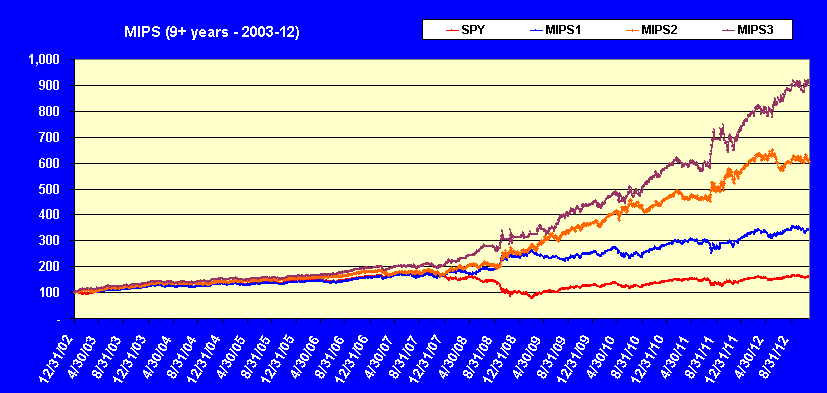
For example, see the table and graph immediately below
- the performance table and graph below were generated with "Improv" signals.
Performance with our "current" models can see seen on our website under the "Performance"
tab or under the "Signals" tab (past signals button); or performance results from our MIPS3/MF
model can be calculated and verified on TimerTrac.com from 11/04/05.
Monday, December 03 2012
As we all know, there is now somewhat equal pressure to push the market up as there is to push it down. The optimists are banking on our leaders solving our budget problems before we go over the fiscal cliff and on a Santa Claus rally that they have become accustomed to as in past Decembers. On the other hand, the pessimists are concentrating on a weakening EURO from defaults in some of the PIIGS countries, and are betting against the fiscal cliff problems being solved prior to Dec 31, 2012.
The graph below shows the recent market action (SPY price graph). From this, you can see the SPY breaking out of its November downdraft (red line) and forming a new, short-term up-trendline (rightmost green line).
Today (Dec 3rd), the SPY hit a strong upside resistance level at $143/share and bounced back down. That, of course, is bearish. This upside resistance is from the neckline of the recent triple-top (cyan box). The fact that the SPY hit and held above the 50-day EMA is bullish. The next support level is at $135/share on the SPY.
The greatest threat facing intermediate-term traders is if the SPY goes into a fast sideways trading pattern, like the one seemingly forming with tops at $143/share and bottoms at $135/share. This pattern would result in a sideways trading pattern with highs/lows plus and minus about 3% around the midpoint at $139/share. Unless an investor can trade close to these high/low points, they could get whipsawed and lose lots of $'s. Most investors cannot trade this pattern successfully on their own, and these investors need to follow a good timing system (like MIPS) or go to cash until the market breaks out of the sideways pattern, if it does form.
Or course, the SPY could simply turn around and break above $143/share into a rally or fall straight through $135/share into a new bear market. This is the type of market where MIPS can issue frequent trades because there is no solid intermediate-term trend, but that is better than being out of sync with the market and getting clobbered with fewer trades.
|


