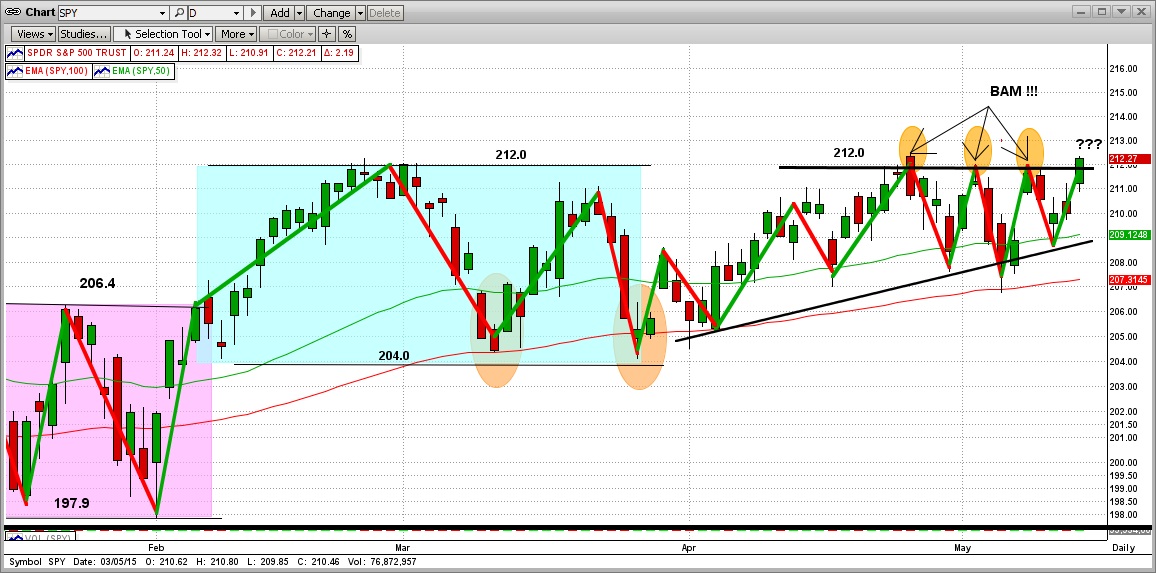
After 3 failed attempts in the last 15 days, the SPY finally broke up above its very strong resistance level and closed on a new high at 212.2 (and 2121 on the S&P500). While we are pleased that the S&P 500 made a new high, and the breakout was on a big rise today following an "up-gap" from yesterday, the volume was relatively low for a breakout (just a little negative, but very bullish overall).
The market movement seems to have transitioned from a sideways market to a "rising wedge" pattern, which usually breaks out following the trend that got it there in the first place (up, in this case). So far it has, and all is good. However, as we all know, the Bears are most likely NOT going to give up easily (they have a ton of short positions to "protect", so they may be selling big-time). On the other hand, if the Bears decide to "cover" their outstanding shorts, that would be VERY bullish. So, although things look bullish, this market can go either way from here. We can watch the price movements and chart patterns as they happen, but we can't analyze these volume-weighted movements anywhere close to how intricately MIPS does. For that reason (and many more), let's rely on MIPS to help us navigate our portfolio in these uncertain times.
Stay tuned...
===========================================================================
<<< Previous Blog >>>
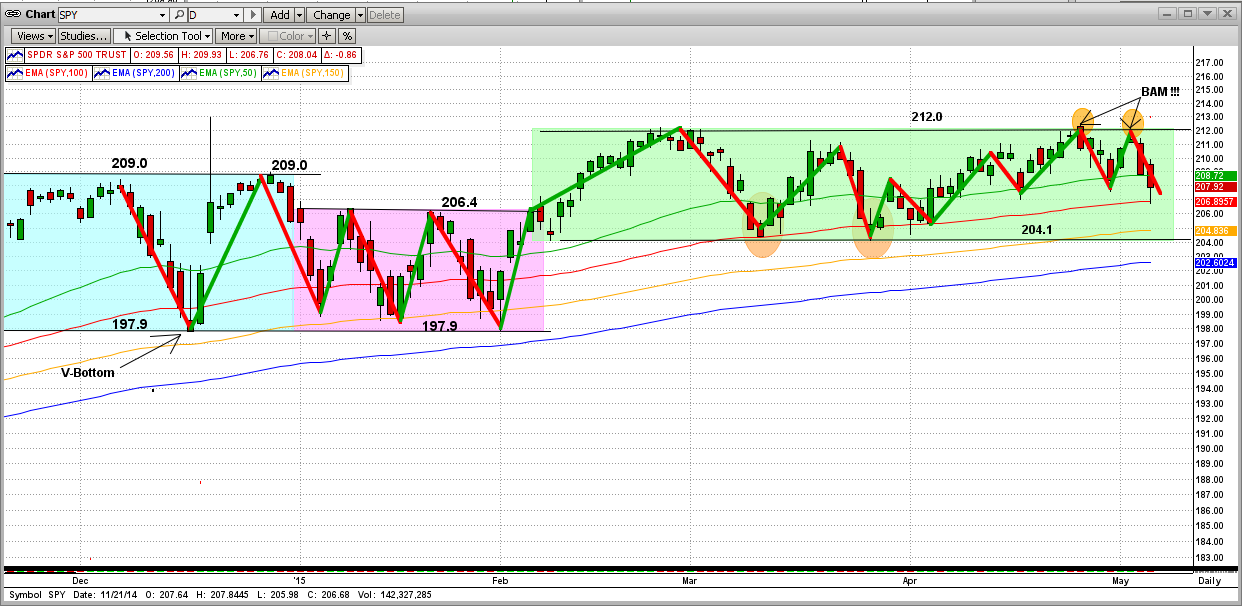
Needless to say, in the last few days the market has not performed well. In fact, some emails that we have received are borderline "panic". So, how bad is the market now and where are we headed?
If we look at a daily chart, as usual it looks like the market is coming apart (see the 1st graph below). From this viewpoint, we can see very clearly that the SPY hit the Bear's front-line resistance at 212.0 twice in five days, and got slammed back both times ("Bam"). Even though the market has been flat for over 5 months, the daily action has been very volatile. So, even though it is very obvious that the short-term trend is "flat", it is difficult to see where the intermediate-term is going.
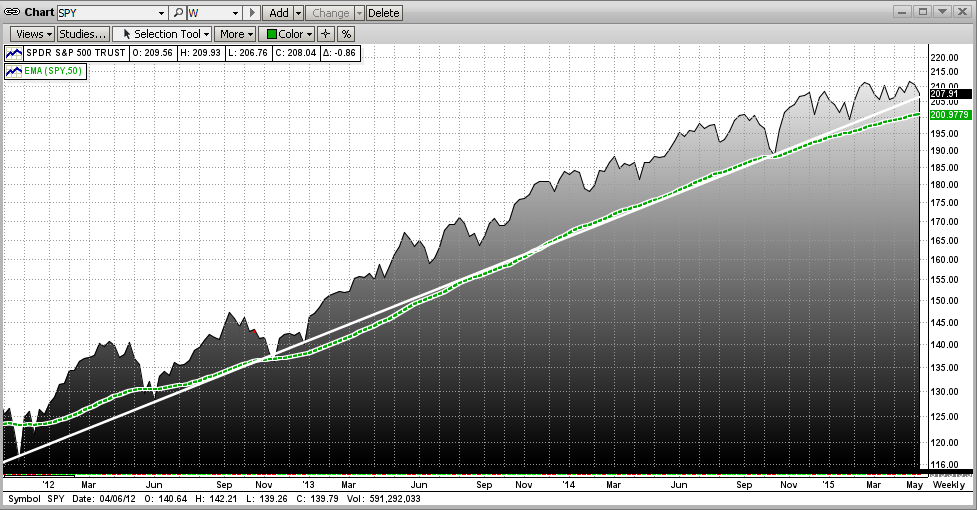
Like most other things in life, if we want to see the "big picture" we need to step back and look at the situation from afar. In this case, let's turn to a graph with weekly data instead of daily data (kind of smooths out the crazy ups-and-downs of everyday activities, as the "floor trades" sell one day and buy back the next.
The next graph shows the rare, "near perfect" 3-year trend from January 2012 through today (5/06/2015). [The trend line is white and the 50-week EMA is green.] As you can see, the SPY hit (or dropped back close to), its trend line (or EMA line) 7-8 times, but the trend line proved to be excellent resistance as the SPY bounced back up every time. As you can see, we are there again today.
Lots of smallish short-term "traders" (if we can call them that) got whipsawed mercilessly in this "froth" above the trendline, a place where the big floor traders live. Little guys trying to navigate that territory usually get killed. And, what for? Why take the risk of trading against the big guys IN THEIR OWN EXCLUSIVE TERRITORY when you can experience good returns following the trend. Greed, maybe?
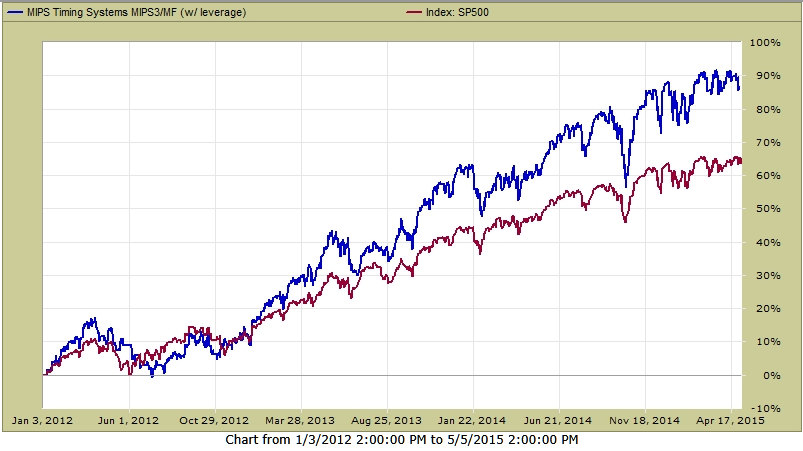
We just said the you could make good money following the trend instead of jumping into the froth above the trendline and getting killed. OK, so how did MIPS do in this time period? For that, we refer to TimerTrac.com, where MIPS3 has been "verified" since late 2005 (MIPS4 would have done better, but it was not introduced until 1Q'13).
As you can see below, MIPS3 trading 1.5x leverage SPY ended up +87%, while the SPY was up +64%.
- Just in case you don't know, if you did that well for the next 21 years, your portfolio then would be
about 80 times the value of what you have now (e.g., $50,000 would be about $4,000,000) !!!
- Still want to "play the froth" and lose your butt, or can you be patient and possibly get rich ?
Stay tuned and follow MIPS !!!