Monday, March 30 2015
Press ? for keyboard shortcuts.
The only good news that I could muster out of the last 2-3 weeks of "market noise" was that:
1) the Fed is still "dovish" with regard to raising interest rates,
2) the Fed still "rules",
3) relatively low volume says that it was not the Fat Kats causing last week's minor sell-off,
4) the SPY closed up above its 100-day EMA in the last two "attacks", and
5) this sideways trading pattern is getting "long in the tooth".
From this, one could expect a market bounce-back going forward, if not an SPY run-up to above $209. But, of course, it's anybody's guess from here, so let's simply follow MIPS' advice. Stay tuned !!!
BTW, these "sideways trading patterns" do not last forever. Many times, they break out in the same direction that they went in (up, in this case). And, the longer the time in a sideways pattern, the bigger the market move after the breakout.
ress ? for keyboard shortcuts.
In mid-February, the market (the SPY) broke out of its sideways trading pattern ("No-Man's-Land") and headed to what one might have thought was a new uptrend. As always, however, the market had its own view on what it was going to do, and it does as it wants. As we all know, starting on March 1st, the market stalled and waffled for a few days.
Then, the SPY got slapped back into No-Man's-Land, with a big drop on 3/06/2015. Ironically, the catalyst for this big drop was "too good" economic news, after a surprisingly good new jobs report and shrinking unemployment. Of course, good economic news should be good for the market, and it ultimately will be. But, this was mitigated away by "fear" of the Fed raising interest rates in June or September, which "overcame" the good economic news because it "MIGHT" affect the Fed's actions months from now. From my experience, these "knee-jerk" reactions to what might happen bad in the future that could trump positive results that have already happened, usually fizzles out within a few days. And this is exactly what happened today (3/12/15). I must add that today's positive move was also aided by the "cooling off" of recent gains in the value in the dollar.
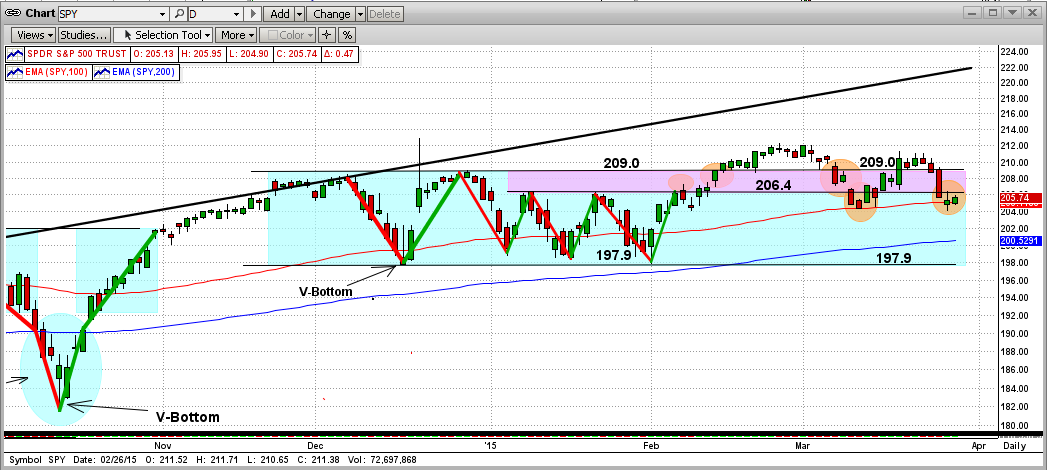
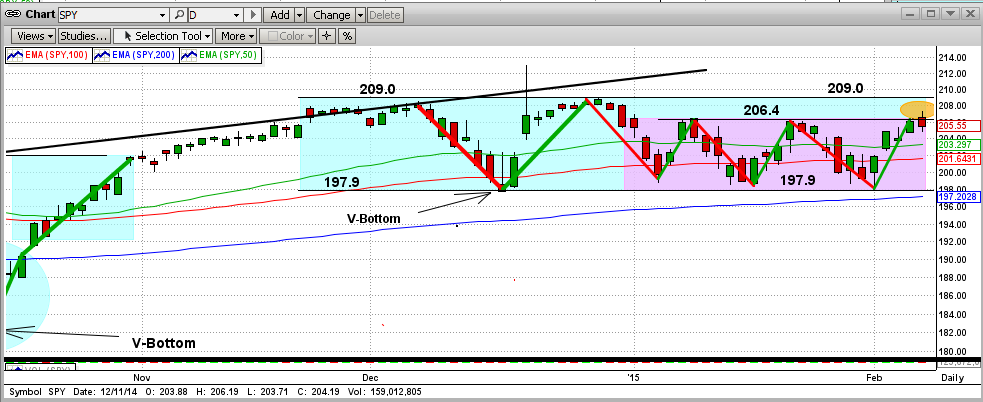
In the graph below (right-most orange circle), you will see that the SPY "held its ground" and bounced off of its 200-day EMA at $204.4 on 3/11/15; and then it climbed all the way back above its 50-day EMA to close at $207.1 today (3/12/15). I personally believe the market will go up from here, at least to again test the upside resistance at $209 on the SPY. What happens after that is anybody's guess, but MIPS will be watching closely for us. Stay tuned...
Sunday, March 15 2015
C O N F ID E N T I A L
From Paul D.
- this is simply my opinion/observation and it has nothing to do with our MIPS models...
Expect a market crash before August 2015 !!!
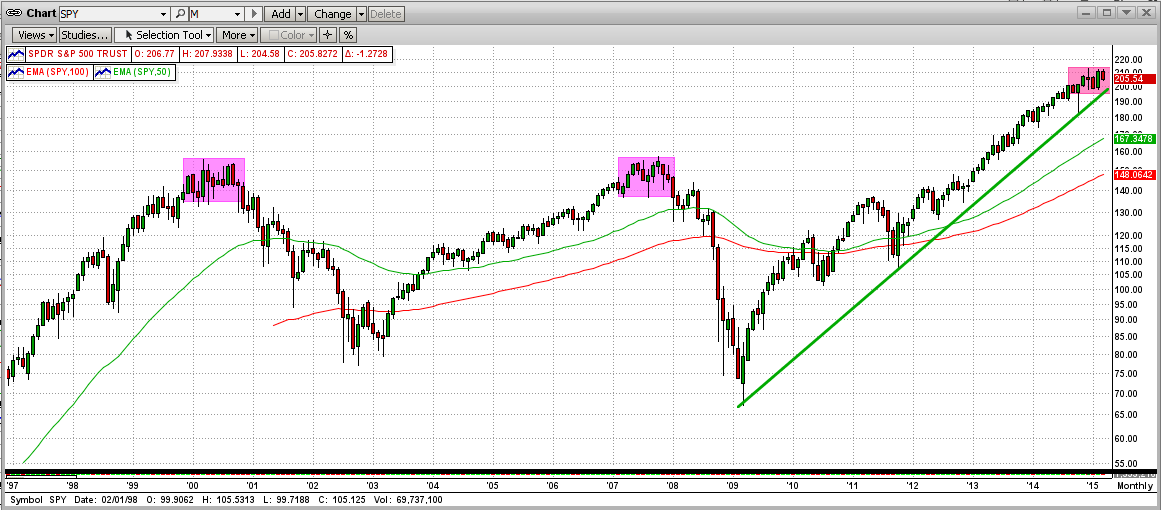
In the graph below, you will see that it took 10-12 months of sideways trading for the market (the SPY) to "top out" in both 1999-2000 and in 2007-2008.
My opinion is that this is roughly how long it takes for the big guys (Goldman Sachs, Morgan Stanley, UBS, etc.) to liquidate the holdings that they want to dump at the top (call me and I will explain this). For example, it would take months for a big guy to sell 100 million shares each of GE and Walmart and Merck, etc., without driving their prices through the floor. And, at the top, they hold 1,000's of positions just like that.
In the graph below, you can see that in 2014-2015 the market has basically traded sideways for 6 full months through February 2015, or 7 months counting March 2015. So, after 7 months in this sideways trading pattern, if the market stays in this relatively flat range for a few more months (highly likely), I believe that a Big Crash will come in July or August 2015 (most likely July 2015). If not, we could see the S&P 500 at $2500 or higher before the big crash finally comes.
This definitely does not mean that the MIPS models see the market the same way that I do (thankfully), so let's be patient while the market makes up its mind and MIPS follows it. Stay tuned ...
Thursday, March 12 2015
In mid-February, the market (the SPY) broke out of its sideways trading pattern ("No-Man's-Land") and headed to what one might have thought was a new uptrend. As always, however, the market had its own view on what it was going to do, and it does as it wants. As we all know, starting on March 1st, the market stalled and waffled for a few days.
Then, the SPY got slapped back into No-Man's-Land, with a big drop on 3/06/2015. Ironically, the catalyst for this big drop was "too good" economic news, after a surprisingly good new jobs report and shrinking unemployment. Of course, good economic news should be good for the market, and it ultimately will be. But, this was mitigated away by "fear" of the Fed raising interest rates in June or September, which "overcame" the good economic news because it "MIGHT" affect the Fed's actions months from now. From my experience, these "knee-jerk" reactions to what might happen bad in the future that could trump positive results that have already happened, usually fizzles out within a few days. And this is exactly what happened today (3/12/15). I must add that today's positive move was also aided by the "cooling off" of recent gains in the value in the dollar.
In the graph below (right-most orange circle), you will see that the SPY "held its ground" and bounced off of its 200-day EMA at $204.4 on 3/11/15; and then it climbed all the way back above its 50-day EMA to close at $207.1 today (3/12/15). I personally believe the market will go up from here, at least to again test the upside resistance at $209 on the SPY. What happens after that is anybody's guess, but MIPS will be watching closely for us. Stay tuned...
Hope this helps !!!
<<< Previous Blog >>>
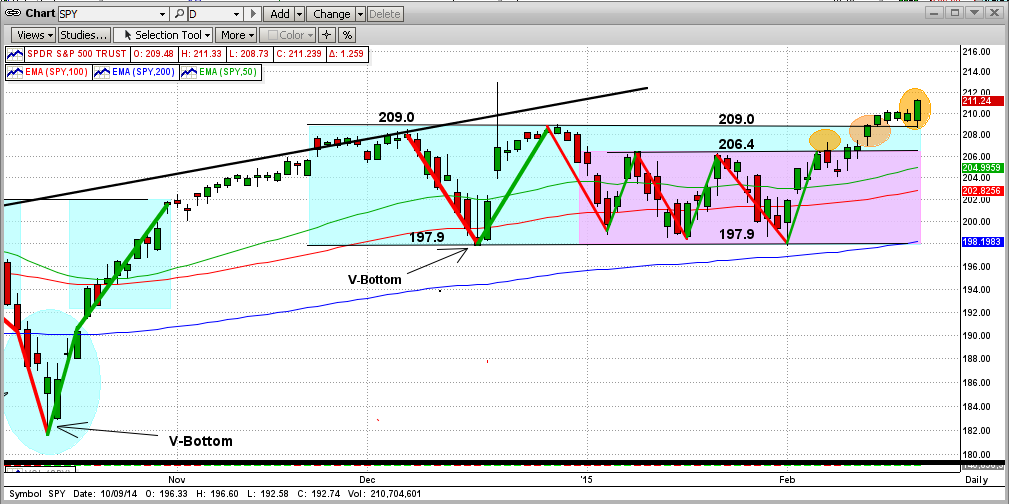
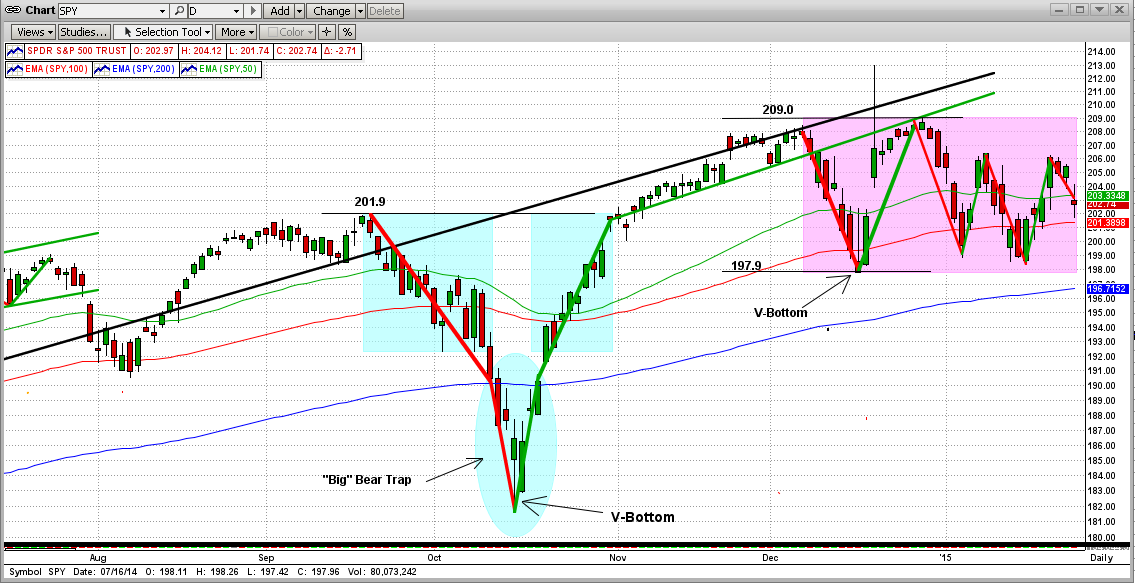
From the graph immediately below at today's close, you will see that the advancing forces (the Bulls) made their way up across the battlefield (pink space) from 197.9 to the beginning of No-Man's-Land at 206.4, with little or no resistance.
Then, they carried on through the "moat" around the castle (blue space) in No-Man's-Land in short order, with few set-backs. But, the Bears "stalled" them at the castle wall today, right at the 209.0 level (see the right-most orange circle in the graph). BTW, the 209.0 resistance level is the SPY's all-time-high, and hence, could provide ultra-resistance.
The last time the market charged the castle's wall, the upside resistance was at 189.0 (2nd graph below). it took nine charges to break out of No-Man's-Land, and it did so to the upside.
In order for the Bulls to feel comfortable now, any break to the upside from here needs to be dramatic. Otherwise, we may experience a Bear provided trip back down to 197.9, or lower (no free ride).
Let's keep watching, but let's wait for MIPS to tell us what to do next !!!
- Stay tuned...
Friday, February 20 2015
In our previous blog, we talked about a stalemate at the wall of the Bear's castle (SPY resistance at $209), just over the "moat" in No Man's Land (see 2nd graph below from previous blog). This was the 5th time that the Bulls had advanced up toward the Bears' front line, after having been beaten back in the previous 4 attempts.
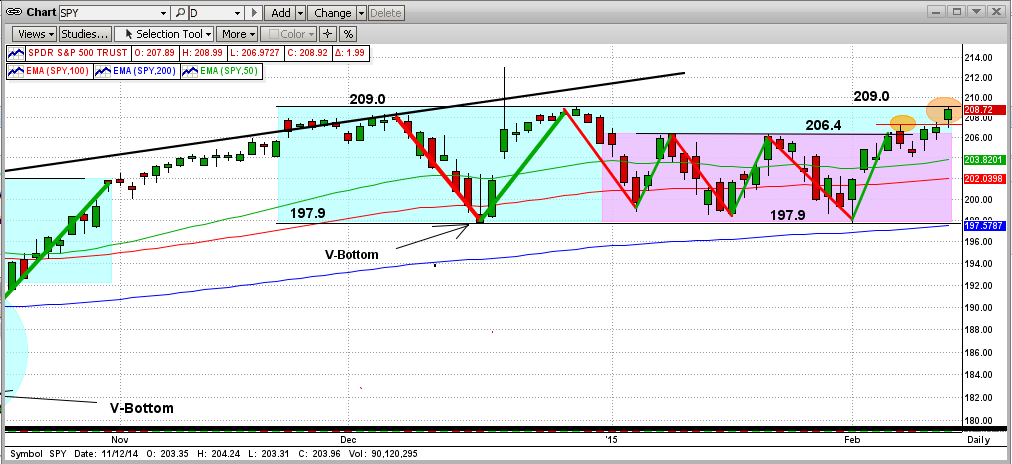
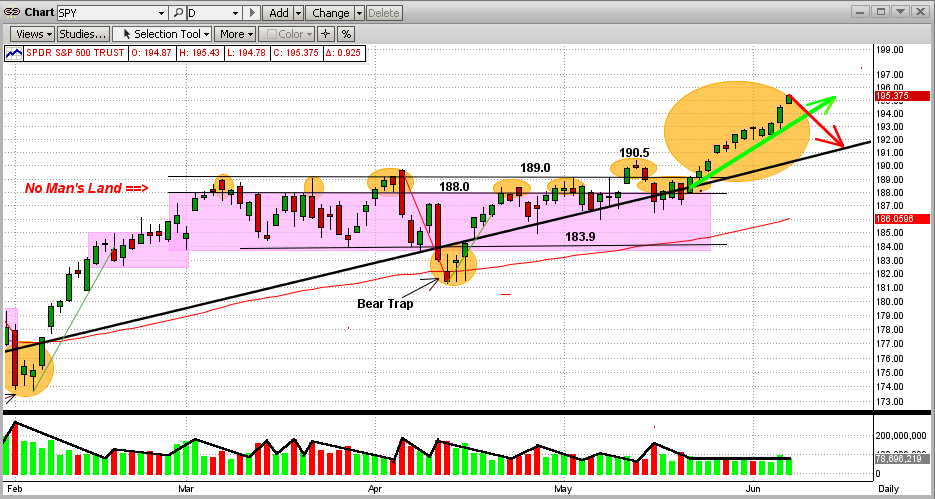
But, four days ago (2/13/15), the Bulls prevailed and the SPY broke $209 to the upside. At that time, we said the Bulls needed to show some strength and "staying power" by: (1) trading above $209 for at least a few days, and then (2) making a dramatic "power move" up soon thereafter. Well, today the Bulls did both (see the graph immediately below). [Look how similar the breakout immediately below is to the breakout from the last sideways trading pattern in May'14, as shown in the 3rd graph below.]
This seems to indicate a move higher from here. All of the MIPS models are (and have been) long, and we expect them to remain that way. OOOppppsss, here I go again... predicting what MIPS will do. Much better to wait for MIPS to tell us what to do. Stay tuned !!!
<<< Previous Blogs >>>
MIPS Members:
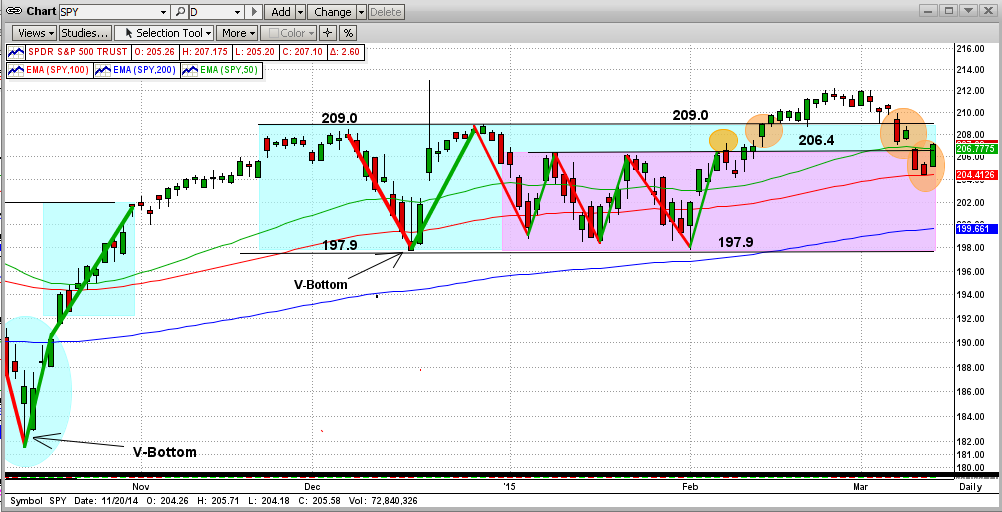
From the graph immediately below at today's close, you will see that the advancing forces (the Bulls) made their way up across the battlefield (pink space) from 197.9 to the beginning of No-man's-Land at 206.4, with little or no resistance.
Then, they carried on through the "moat" around the castle (blue space) in No-Man's-Land in short order, with few set-backs. But, the Bears "stalled" them at the castle wall today, right at the 209.0 level (see the right-most orange circle in the graph). BTW, the 209.0 resistance level is the SPY's all-time-high, and hence, could provide ultra-resistance.
The last time the market charged the castle's wall, the upside resistance was at 189.0 (2nd graph below). It took nine charges to break out of No Man's Land, and it did so to the upside.
In order for the Bulls to feel comfortable now, any break to the upside from here needs to be dramatic. Otherwise, we may experience a Bear provided trip back down to 197.9, or lower (no free ride).
Let's keep watching, but let's wait for MIPS to tell us what to do next !!!
- Stay tuned...
================================
<<< Previous Blog >>>
MIPS Members:
Re: Please glance at the two links below
1) http://mipstiming.com/blog/view/7781/the_market_battle_in__no_man_s_land___2014
2) http://mipstiming.com/blog/view/7848/_the_market_battle_in__no_man_s_land___2014____bulls_win_
Most of you are familiar with flat/sideways patterns that develop into what I call "No Man's Land". No Man's Land is a piece of the graph where the price (say of the SPY) gets very close to a resistance level (to the upside from below) or support level (to the downside from above) and repeatedly fails to break above resistance levels or below support levels. The market can "play" in No Man's Land for months.
Ultimately, the market (SPY) breaks out of No Man's Land above or below, and makes a significant move in the direction in which it broke out of the sideways pattern. The last time this happened is shown in the graph below. It shows the cyclic price action of the SPY between Mar-May 2014 and the breakout in late May'14. You will see that "the breakout" did not happen until the 7th attempt by the SPY to break to the upside. (Lots of dead bodies and broke traders that trade in these sideways trading patterns.)

Hope this helps !!!
Thursday, February 12 2015
From the graph immediately below at today's close, you will see that the advancing forces (the Bulls) made their way up across the battlefield (pink space) from 197.9 to the beginning of No Man's Land at 206.4, with little or no resistance.
Then, they carried on through the "moat" around the castle (blue space) in No-Man's-Land in short order, with few setbacks. But, the Bears "stalled" them at the castle wall today, right at the 209.0 level (see the right-most orange circle in the graph). BTW, the 209.0 resistance level is the SPY's all-time-high, and hence, could provide ultra-resistance.
The last time the market charged the castle's wall, the upside resistance was at 189.0 (2nd graph below). It took nine charges to break out of No Man's Land, and it did so to the upside.
In order for the Bulls to feel comfortable now, any break to the upside from here needs to be dramatic. Otherwise, we may experience a Bear provided trip back down to 197.9, or lower (no free ride).
Let's keep watching, but let's wait for MIPS to tell us what to do next !!!
- Stay tuned...
================================
<<< Previous Blog >>>
Re: Please glance at the two links below
1) http://mipstiming.com/blog/view/7781/the_market_battle_in__no_man_s_land___2014
2) http://mipstiming.com/blog/view/7848/_the_market_battle_in__no_man_s_land___2014____bulls_win_
Most of you are familiar with flat/sideways patterns that develop into what I call "No Man's Land". No Man's Land is a piece of the graph where the price (say of the SPY) gets very close to a resistance level (to the upside from below) or support level (to the downside from above) and repeatedly fails to break above resistance levels or below support levels. The market can "play" in No Man's Land for months.
Ultimately, the market (SPY) breaks out of No Man's land above or below, and makes a significant move in the direction in which it broke out of the sideways pattern. The last time this happened is shown in the graph below. It shows the cyclic price action of the SPY between Mar-May 2014 and the breakout in late May'14. You will see that "the breakout" did not happen until the 7th attempt by the SPY to break to the upside. (Lots of dead bodies and broke traders that trade in these sideways trading patterns.)
What does the above have to do with today?
The market (SPY) now seems to be in a "repeat" of the above (see graph below). This most recent sideways trading pattern is the SPY price between $197.9 and $209.0 (about 5.6%), with a "No Man's Land" space between 206.4 and 209.0 (blue space above pink space in graph). Friday was SPY's 5th run on the 209.0 resistance level, and its 3rd attempt to move back into No Man's Land. On Friday, the SPY stuck its nose into No Man's Land, only to be slapped back to close below it (this may indicate another drop back to the 197.9 support level, but the SPY could reverse itself and make another charge on the high point (209.0). Obviously, the next few days/weeks will be vital to the future direction in the market.
It's a good thing that we do not have to decide what to do now, as that is MIPS' job. So, stay tuned.
- New subscribers may want to wait a few days to see what the SPY does relative to the graph below before taking
a long position right away.
Hope this helps !!!
Monday, February 09 2015
Re: Please glance at the two links below
1) http://mipstiming.com/blog/view/7781/the_market_battle_in__no_man_s_land___2014
2) http://mipstiming.com/blog/view/7848/_the_market_battle_in__no_man_s_land___2014____bulls_win_
Most of you are familiar with flat/sideways patterns that develop into what I call "No Man's Land". No Man's Land is a piece of the graph where the price (say of the SPY) gets very close to a resistance level (to the upside from below) or support level (to the downside from above) and repeatedly fails to break above resistance levels or below support levels. The market can "play" in No Man's Land for months.
Ultimately, the market (SPY) breaks out of No Man's Land above or below, and makes a significant move in the direction in which it broke out of the sideways pattern. The last time this happened is shown in the graph below. It shows the cyclic price action of the SPY between Mar-May 2014 and the breakout in late May'14. You will see that "the breakout" did not happen until the 7th attempt by the SPY to break to the upside. (Lots of dead bodies and broke traders that trade in these sideways trading patterns.)
What does the above have to do with today?
The market (SPY) now seems to be in a "repeat" of the above (see graph below). This most recent sideways trading pattern is the SPY price between $197.9 and $209.0 (about 5.6%), with a "No Man's Land" space between 206.4 and 209.0 (blue space above pink space in graph). Friday was SPY's 5th run on the 209.0 resistance level, and its 3rd attempt to move back into No Man's Land. On Friday, the SPY stuck its nose into No Man's Land, only to be slapped back to close below it (this may indicate another drop back to the 197.9 support level, but the SPY could reverse itself and make another charge on the high point (209.0). Obviously, the next few days/weeks will be vital to the future direction in the market.
It's a good thing that we do not have to decide what to do now, as that is MIPS' job. So, stay tuned.
- New subscribers may want to wait a few days to see what the SPY does relative to the graph below before taking
a long position right away.
Hope this helps !!!
Sunday, February 01 2015
The market is at a critical point...
The daily charts and the monthly charts are both telling us this. Where the market goes from this "Critical Point" is very important and its anybody's guess. But, let's not "guess"... let's depend upon MIPS to tell us what to do !!!
DAILY VIEW
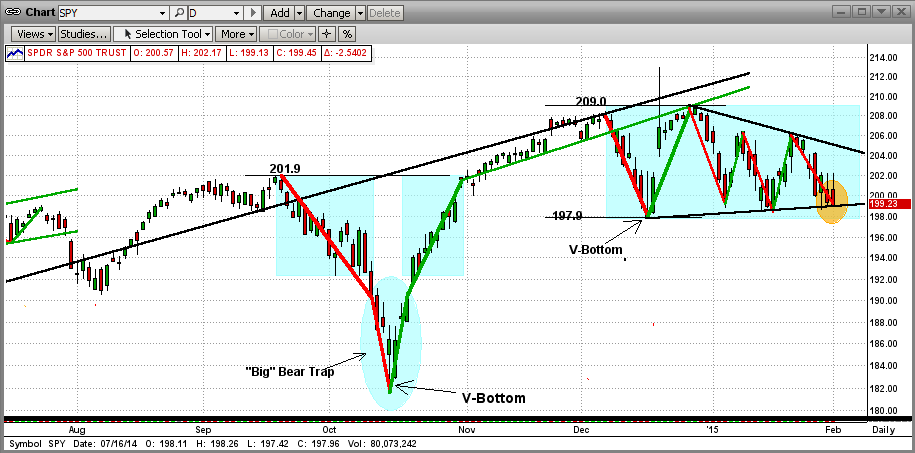
In our last blog, we showed what could be the market "topping". However, we also pointed out that it can take 10 months of "topping" before we experience a big Crash. What happens in the interim is also very important because a market crash is not obligated to "wait" 10 months to happen. The graph immediately below shows the trading of this crazy, volatile market in the last 2 months. It can be looked upon simply as erratic, but we see a "pennant" formation with the SPY at a Critical Point on the bottom edge of the formation (orange ellipse on the top right). A drop from here could be significant, but it would not necessarily mean that the drop would have to be the real "biggie".
MONTHLY VIEW
Now let's look at the price action of the DOW from a monthly viewpoint from 2000-2014 (graph below). This shows another reliable formation that basically says "Whichever way the market (in this case, the Dow) breaks out from here will most likely define its direction (up or down) for some time to come. And, as you can see, the market is almost 100% at that Critical Point. The next few days/weeks will be CRITICAL !!!
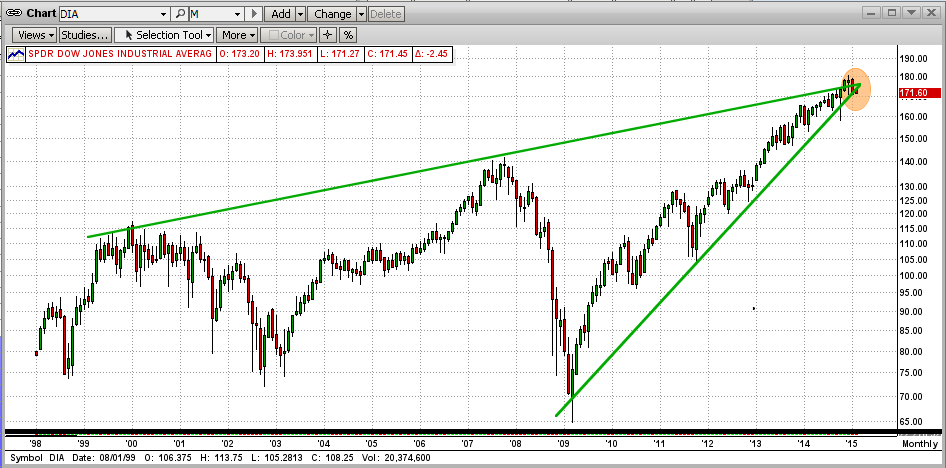
Stay tuned, and keep watching the MIPS signals. Remember, the market could break up from here and resume its powerful, six-year bull trend. But, if (or when, to be more accurate) the big drop comes, MIPS should call it in ample time for us to make sizeable gains in the crash.
Wednesday, January 28 2015
The main question on the minds of our MIPS members is "Is this Six-Year Bull Market Pausing or Topping?" We don't know that now, but we will soon. A bull market does not just run out of steam. Some run for over 10 years, as in the 1990's (until the tech bubble burst).
To turn a bull, at least two things have to happen: (1) there has to be a "catalyst" to kill the bull (degradation of the oil industry, death of the Euro, etc.), and (2) the big guys/fat kats (Goldman Sachs, etc.) have got to make it happen or at least let it happen. Please understand that these big guys "cause" bottoms and tops when they decide to buy or sell. And, the big guys will not let the big drop happen until they have liquidated most or all of the holdings that they want to dump. Since these fat kats own about 65% of all shares on the NYSE, dumping their shares can take lots of time (many months), because selling faster would lead to driving prices through the floor.
WHAT IS HAPPENING NOW ?
If you look at daily charts, the current market looks like a total mess (see the chart immediately below). To some people, the last 2 months (pink rectangle) look like the market is about to totally collapse (high volatility, etc.). But in reality, this horrible-looking price action boils down to plus or minus 2.7% around a mean-line at $203.5 on the SPY. That is certainly NOT enough for a long-term investor to lose any sleep over.
WHAT WILL THE MARKET LOOK LIKE IN 6 MONTHS ?
I will get really worried if the market (the SPY) stays in the trading range of $198-$209 for several more months. Why, because in 2000 and 2007/08, the SPY "topped" for 10 months in a tight trading range (like now) and then fell apart. From my analysis of the volume, this 10-month period is when the fat kats are dumping. They will dump in a tight trading range (plus/minus 5% or less). When their chore is done, their selling AND buying will dry up. Then, the little guys panic and continue the selling over the next 1-2 years (or until the market is way back down where it was 5 years before, or less). See the graph immediately below. As you can see, the SPY traded in a tight trading range in 2000 and 2007/08 for exactly 10 months both times, and then collapsed. As of the end of January 2015, the SPY has been in a tight trading range for 5 months. If this continues, it could lead to a market crash in July 2015 !!!
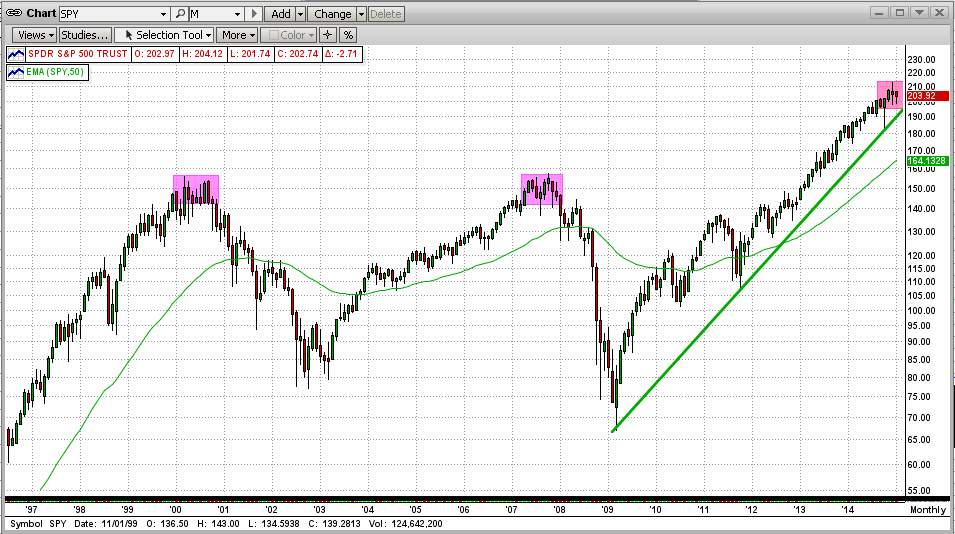
Of course, if the SPY breaks out of this tight trading range to the upside in the next few weeks/months, this would continue the nearly perfect 6-year uptrend and make us good money on the upside.
MIPS will be watching the SPY market movements (and the selling volume from the big guys) to help us react quickly to whichever way this market is heading. Stay tuned !!!
Sunday, January 04 2015
Anyone who has developed and programmed a mathematical model for managing a real-life process (like controlling a nuclear power plant, controlling a jet aircraft, sending a man to the moon in a spaceship, or forecasting changes in the direction of the stock market), knows the criteria for a good model.
The main conditions for a good model are:
1) the math has to realistically represent the actual situation that it is controlling/predicting,
2) it must be written to represent the real situation, and be tested against real data (or close to real data),
3) the backtesting cannot actually result in "curve-fitting",
4) it has to be update-able to work with "new" data,
5) the model should have built-in self-learning and self-correcting algorithms, and
6) the model needs to contain algorithms that stop the main model if it is not working properly and switch
to others.
Given the above, all good developers frequently forward-test their models against known and unknown changes in the environment (in our case, erratic market behavior). To that end, we are always looking at how our models might work in a new market crash. On average, investors face a market crash almost every 7 years (the so-called "Seven Year Market Cycle"). This comes from market data over many years that shows that the market continually goes up in cycles of 4-6 years up and 1-2 years down (say an average of 5 years up, then 2 years down). We should know, as we have faced two almost perfectly devastating 7-year market cycles in this very young century.
And, on this basis and many others, the 6-year bull market we are in is overdue for a big crash. And yes, we are aware that a bull market can last for 10-12 years as in the 1980's and 1990's, but the 7-year cycle is much more popular than 12-year bull markets. So, that leaves us highly vulnerable this year.
Even if we are not vulnerable to a big drop in 2015, as developers of the MIPS models we want to make sure that MIPS is ready if and when a big drop does happen. It is better for the MIPS models to fail to identify a major crash in forward-testing than in real life. At least we would have a chance to "fix it" before it happens, rather than after.
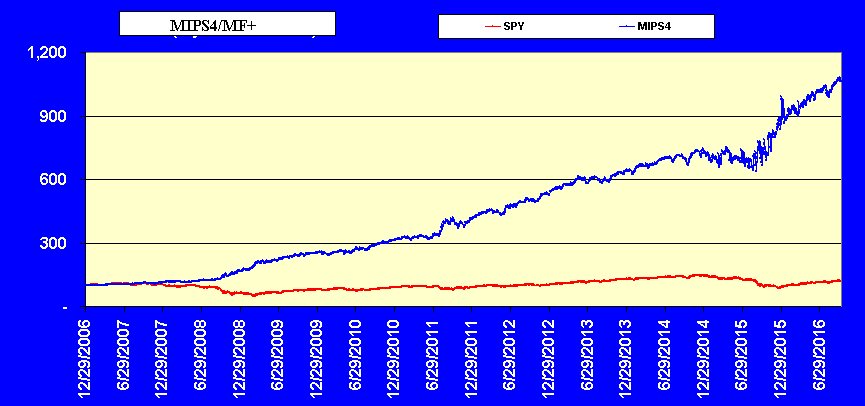
So, we dug back in time and used some real data from previous market crashes to see how MIPS would perform if the market started down now. We are pleased to say that the MIPS4 model would have performed nearly PERFECTLY (see below). [The MIPS3 and MIPS/Nitro models also did well, but their results are not shown herein.]
HYPOTHETICAL MARKET CRASH IN 2015
In the graph below from 2007-6/30/2016, the data through 12/31/14 is real SPY data (in % changes), and
the data from Jan 2, 2015 to about 12/31/2015 is our assumed drop in the S&P 500 (rebounds after).
- you can see that our "test data" included a -43% drop in the S&P 500 in the full year of 2015, and a
rebound of +22% over the next 6 months (through to 6/30/2016).
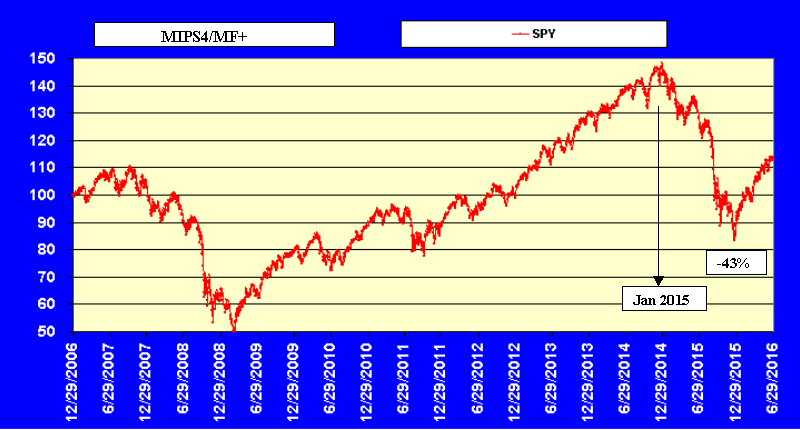
MIPS4/MF+ PERFORMANCE IN MARKET CRASH OF 2015
So, how did the MIPS4/MF+ model perform in this assumed (but highly possible) drop. The graph below makes us prematurely proud (only to be really proud when it does what it is designed to do in the next real market drop).
Performance of MIPS4/MF+ in the assumed market crash of 2015.
In 2015-6/30/16, MIPS4 would have been up about +55% (made money on the dip and on the rebound).
Saturday, December 27 2014
This blog attempts to explain why you see "wild price action" when MIPS doesn't. The explanation below is indicative of a lot of the math in MIPS, except for the algorithms we use to "speed things up" (trade faster) when required.
First off, this is because MIPS looks at "wild price action" in a slightly different way than we do. We look at daily market movements, caused mainly by NYSE floor traders who change their minds within minutes, hours, or just a few days after making huge trades. MIPS knows this from their "volume weighted data" trades. Since these floor traders create the "wild price action" on daily charts (and they can change direction on a dime), the MIPS models mimimize their short-term, wild price action in strong up or down markets (but, not so in slow-moving or flat markets). Needless to say, from a "technical analysis" standpoint, MIPS closely monitors price action and the "patterns" it they creates.
You don't need a MIPS model to show you this, you can see the "wild price action" disappear if you have the discipline and patience to look for it on weekly and monthly charts and wait until new trends develop. This is not what MIPS does, but it is a good example of looking deeper (certainly not recommended for actual trading signals).
DAILY
The "wild price action" below is what you see in the daily charts... looks terrible and "all over the map" (NO consistency). There is seemingly no trend at all, but you are being "fooled".
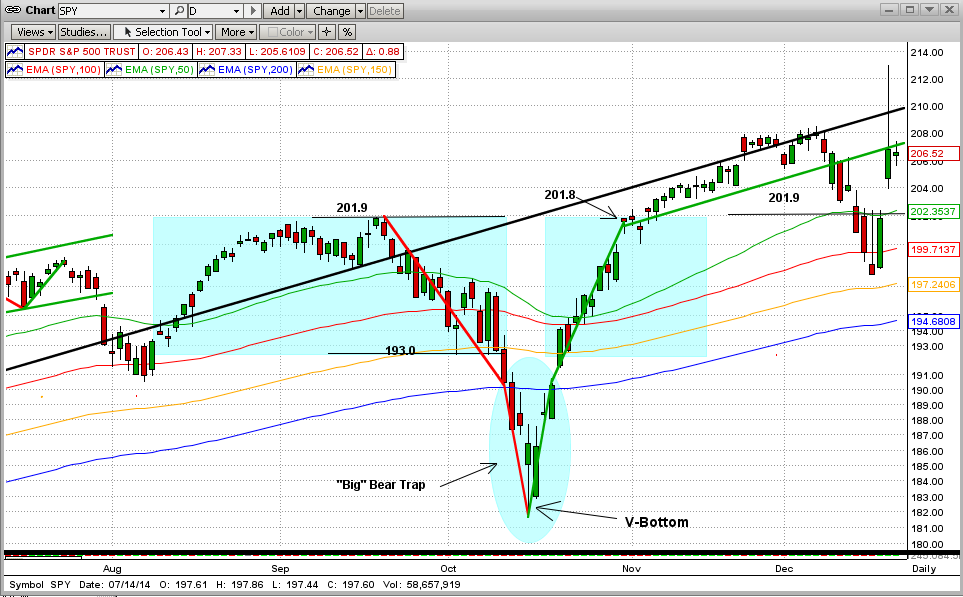
WEEKLY
If we just step back a little and look at this price action from more of an intermediate-term view, things look completely different. In fact, we can then see actual trends, etc. without being fooled by the wild movements caused by the floor traders that have nothing to do with us or the way we invest. Some Nervous Nelly, sick from wild daily movements, who at least had checked the weekly daily price action would have seen only one period of serious deviation, and it did not last long (only one "break" in the dominant trend). And, if that trend could have quickly been identified as a "V-Bottom", anyone in their right mind would have avoided trading it (like us).
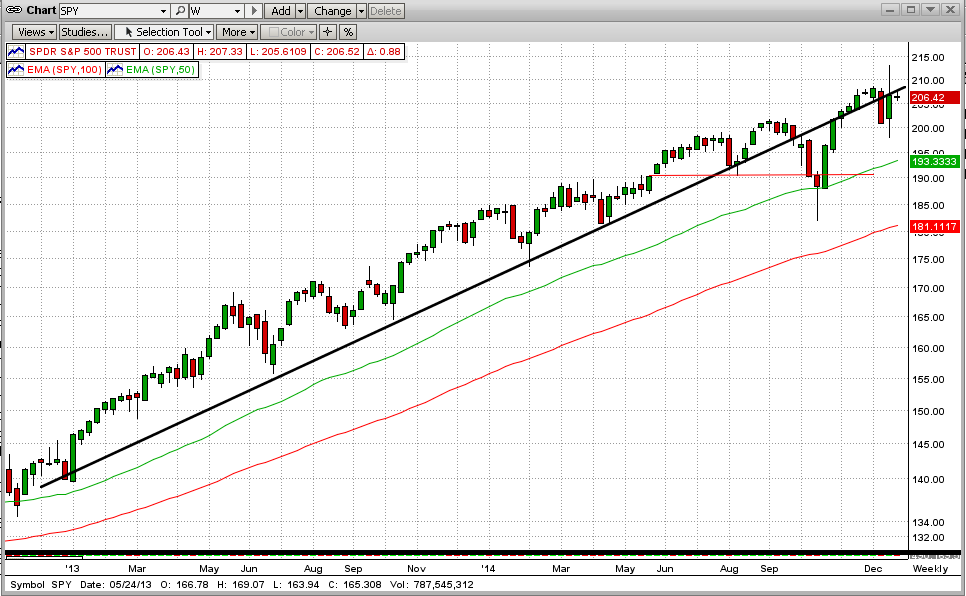
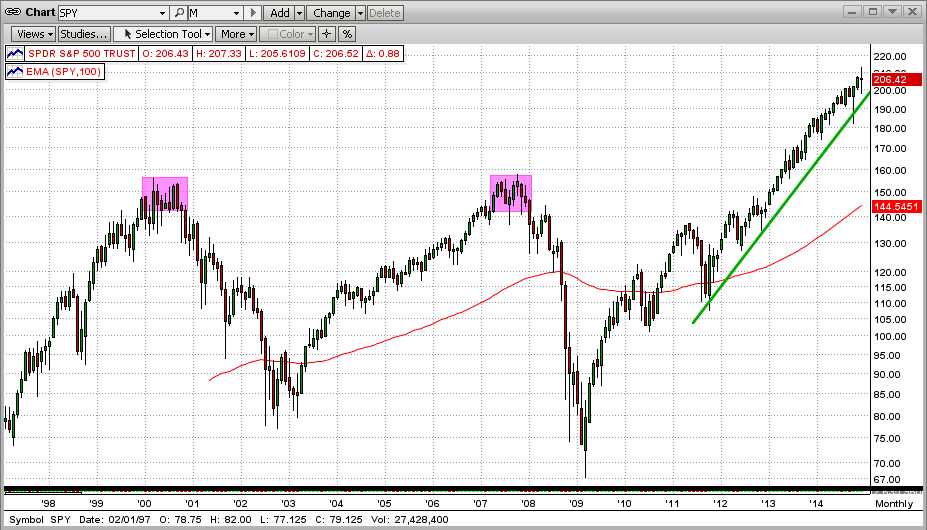
MONTHLY
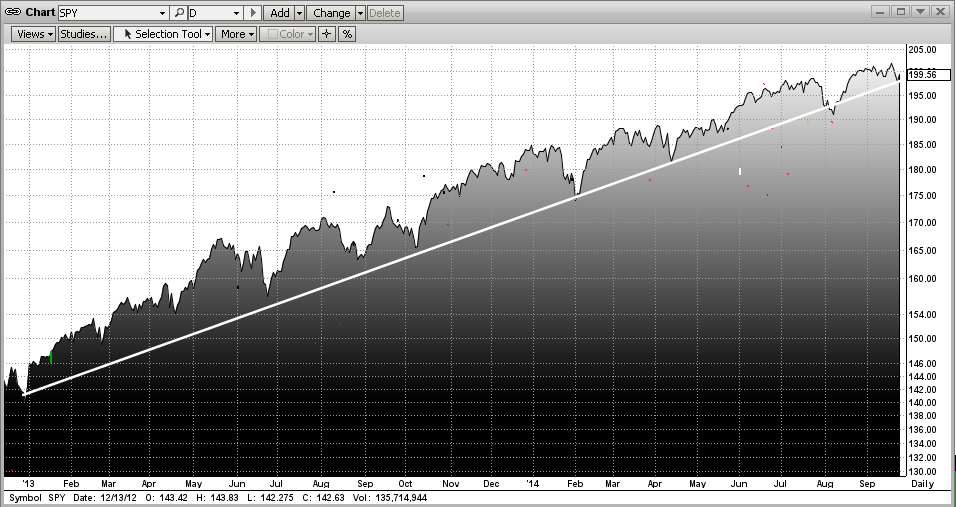
Although MIPS follows primarily intermediate-term trends with hundreds of indicators and proprietary algorithms, we get our quick "peace of mind" by checking the long-term monthly charts. At this time, we can still see a strong (yes, still a strong), almost perfect trendline going all the way back to 2012 without even a "hint" of a new downtrend coming (that is, no new "inflection point"). Of course, this can change at any time, so we WOULD NOT use monthly data to help us decide when a trend is changing (but more to decide when it is not changing).
In reality, we use much faster-moving algorithms to calculate our "Inflection Points". Any investor who cannot sleep well with a trend like the one below that we are following now (and with models like MIPS) needs to either (a) turn their trading decisions over to others (advisors, etc.), or (2) buy-and-hold, or (3) quit investing in equities.
NET BOTTOM LINE
The MIPS models are more likely to simply "follow" a strong trend as in the graph below (higher highs, higher lows) than to attempt to trade the cycles above the trendline, and get whipsawed. Of course, MIPS doe not simply "follow the trend", but this example is "directionally" correct.
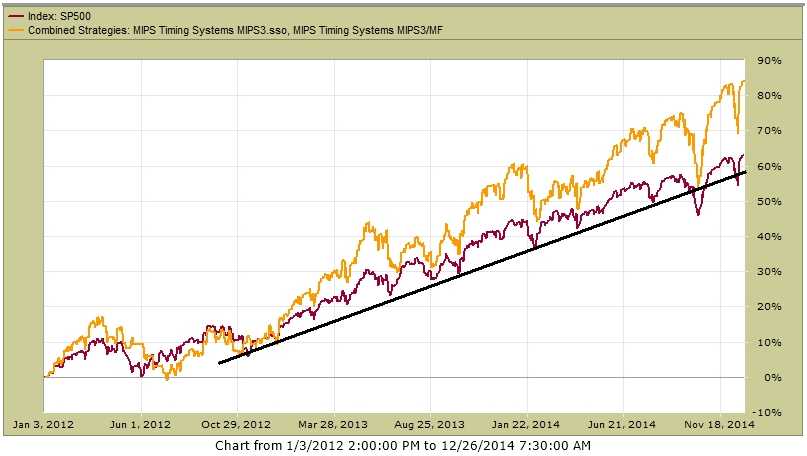
HOW DID MIPS DO IN THIS STRONG UPTREND ?
MIPS was able to avoid getting whipsawed in the recent turbulence due to algorithms that we have built into the models that act differently during strong trends (more tolerant) than they do in weak or flat markets (move quickly).
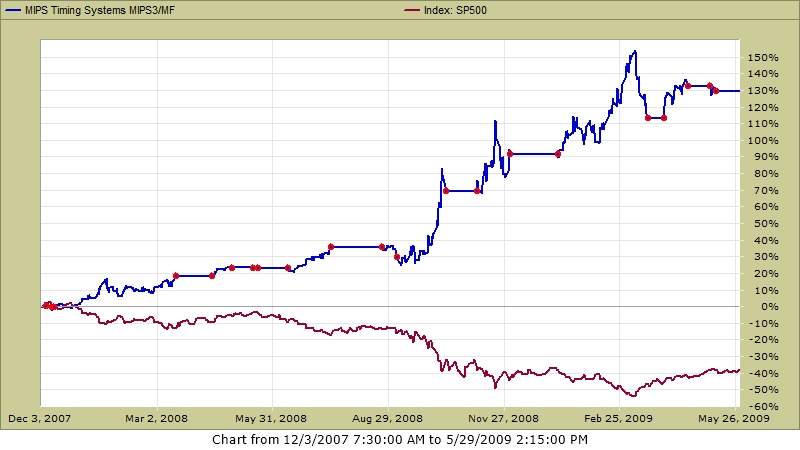
During the last three years, MIPS3 and MIPS4 were up about 85% (hard to beat that). But, one might say, there are other models that have stayed long and produced decent gains, right? True, but many of these other models almost always stay long, and trade very infrequently. So, to be sure, one MUST find out how these other models perform in down markets and in actual market crashes? See the 2nd graph below to see how MIPS did in 2008 (MIPS up 135%; SPY down 40%).
MIPS IN DOWN MARKETS (2008)
MIPS in 2008 (red dots show trades) MIPS +130% SPY -40%
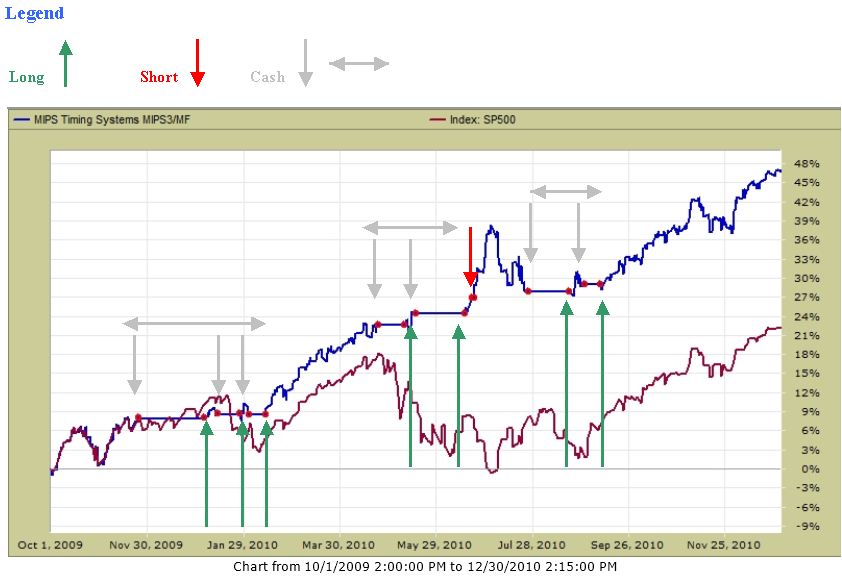
HIGHER FREQUENCY TRADING
When we have a very solid trend and MIPS does not trade very often (like now), our members start to ask "Does MIPS ever trade more often (faster)? Of course, the answer is YES, as can be seen above in 2008 and below in 2010. Without a constant long-term trend, MIPS will do what it does best... namely, trade faster to successfully follow the intermediate-term trends as it did in 2010. No MIPS models has ever issued more than 25 trade signals in any year.
MIPS in 2010
- Red dots show the 17 trades in 2010
|