The main question on the minds of our MIPS members is "Is this Six-Year Bull Market Pausing or Topping?" We don't know that now, but we will soon. A bull market does not just run out of steam. Some run for over 10 years, as in the 1990's (until the tech bubble burst).
To turn a bull, at least two things have to happen: (1) there has to be a "catalyst" to kill the bull (degradation of the oil industry, death of the Euro, etc.), and (2) the big guys/fat kats (Goldman Sachs, etc.) have got to make it happen or at least let it happen. Please understand that these big guys "cause" bottoms and tops when they decide to buy or sell. And, the big guys will not let the big drop happen until they have liquidated most or all of the holdings that they want to dump. Since these fat kats own about 65% of all shares on the NYSE, dumping their shares can take lots of time (many months), because selling faster would lead to driving prices through the floor.
WHAT IS HAPPENING NOW ?
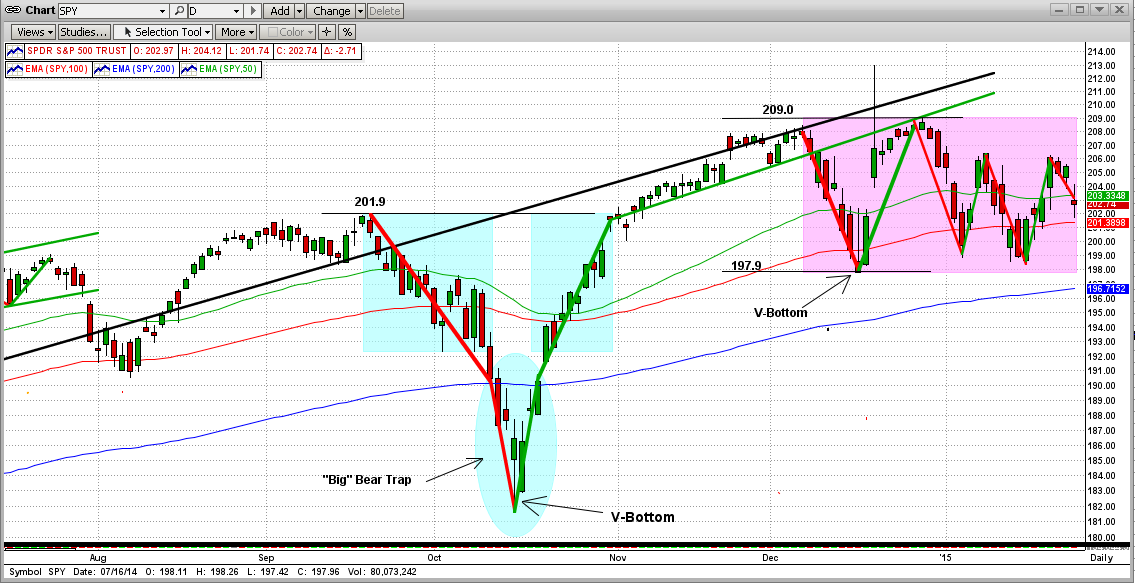
If you look at daily charts, the current market looks like a total mess (see the chart immediately below). To some people, the last 2 months (pink rectangle) look like the market is about to totally collapse (high volatility, etc.). But in reality, this horrible-looking price action boils down to plus or minus 2.7% around a mean-line at $203.5 on the SPY. That is certainly NOT enough for a long-term investor to lose any sleep over.
WHAT WILL THE MARKET LOOK LIKE IN 6 MONTHS ?
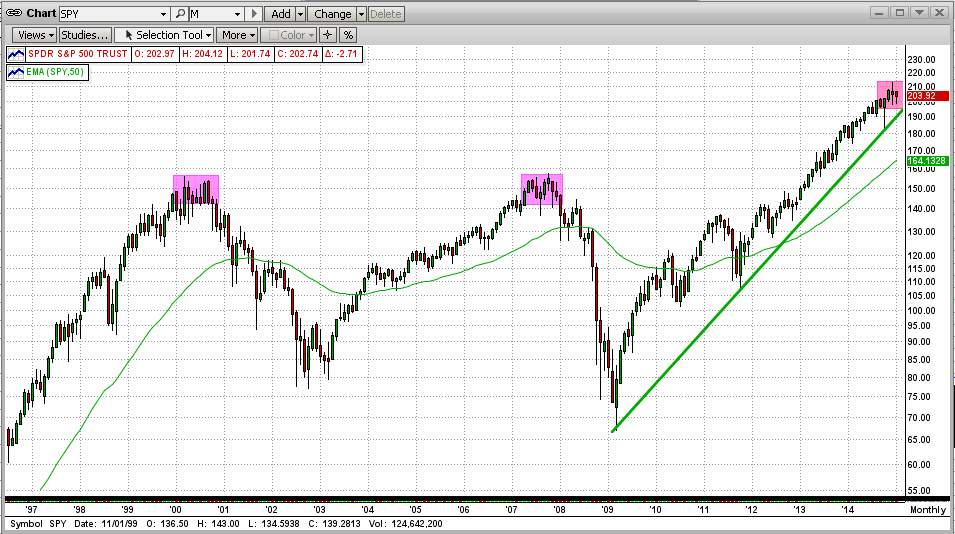
I will get really worried if the market (the SPY) stays in the trading range of $198-$209 for several more months. Why, because in 2000 and 2007/08, the SPY "topped" for 10 months in a tight trading range (like now) and then fell apart. From my analysis of the volume, this 10-month period is when the fat kats are dumping. They will dump in a tight trading range (plus/minus 5% or less). When their chore is done, their selling AND buying will dry up. Then, the little guys panic and continue the selling over the next 1-2 years (or until the market is way back down where it was 5 years before, or less). See the graph immediately below. As you can see, the SPY traded in a tight trading range in 2000 and 2007/08 for exactly 10 months both times, and then collapsed. As of the end of January 2015, the SPY has been in a tight trading range for 5 months. If this continues, it could lead to a market crash in July 2015 !!!
Of course, if the SPY breaks out of this tight trading range to the upside in the next few weeks/months, this would continue the nearly perfect 6-year uptrend and make us good money on the upside.
MIPS will be watching the SPY market movements (and the selling volume from the big guys) to help us react quickly to whichever way this market is heading. Stay tuned !!!


