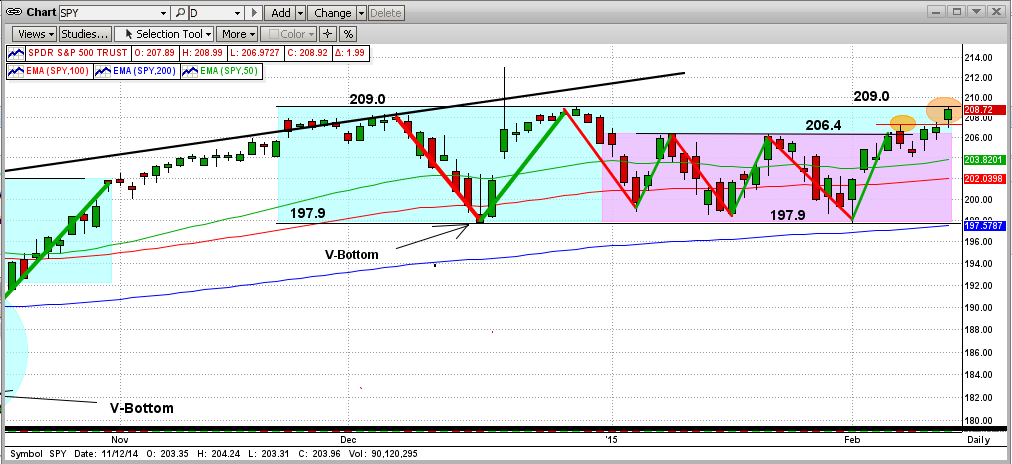
From the graph immediately below at today's close, you will see that the advancing forces (the Bulls) made their way up across the battlefield (pink space) from 197.9 to the beginning of No Man's Land at 206.4, with little or no resistance.
Then, they carried on through the "moat" around the castle (blue space) in No-Man's-Land in short order, with few setbacks. But, the Bears "stalled" them at the castle wall today, right at the 209.0 level (see the right-most orange circle in the graph). BTW, the 209.0 resistance level is the SPY's all-time-high, and hence, could provide ultra-resistance.
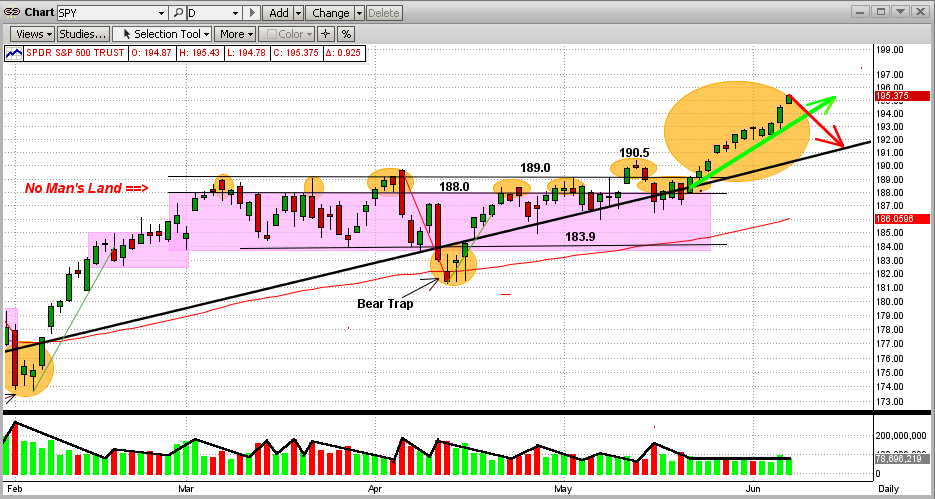
The last time the market charged the castle's wall, the upside resistance was at 189.0 (2nd graph below). It took nine charges to break out of No Man's Land, and it did so to the upside.
In order for the Bulls to feel comfortable now, any break to the upside from here needs to be dramatic. Otherwise, we may experience a Bear provided trip back down to 197.9, or lower (no free ride).
Let's keep watching, but let's wait for MIPS to tell us what to do next !!!
- Stay tuned...
================================
<<< Previous Blog >>>
Re: Please glance at the two links below
1) http://mipstiming.com/blog/view/7781/the_market_battle_in__no_man_s_land___2014
2) http://mipstiming.com/blog/view/7848/_the_market_battle_in__no_man_s_land___2014____bulls_win_
Most of you are familiar with flat/sideways patterns that develop into what I call "No Man's Land". No Man's Land is a piece of the graph where the price (say of the SPY) gets very close to a resistance level (to the upside from below) or support level (to the downside from above) and repeatedly fails to break above resistance levels or below support levels. The market can "play" in No Man's Land for months.
Ultimately, the market (SPY) breaks out of No Man's land above or below, and makes a significant move in the direction in which it broke out of the sideways pattern. The last time this happened is shown in the graph below. It shows the cyclic price action of the SPY between Mar-May 2014 and the breakout in late May'14. You will see that "the breakout" did not happen until the 7th attempt by the SPY to break to the upside. (Lots of dead bodies and broke traders that trade in these sideways trading patterns.)
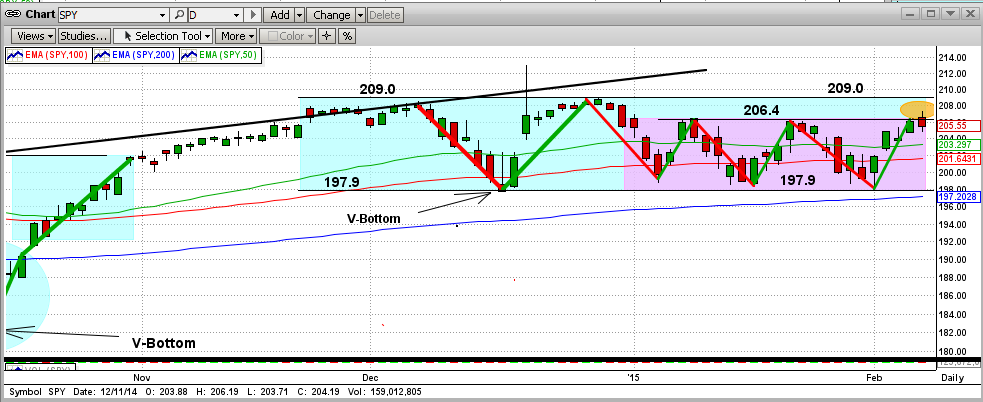
What does the above have to do with today?
The market (SPY) now seems to be in a "repeat" of the above (see graph below). This most recent sideways trading pattern is the SPY price between $197.9 and $209.0 (about 5.6%), with a "No Man's Land" space between 206.4 and 209.0 (blue space above pink space in graph). Friday was SPY's 5th run on the 209.0 resistance level, and its 3rd attempt to move back into No Man's Land. On Friday, the SPY stuck its nose into No Man's Land, only to be slapped back to close below it (this may indicate another drop back to the 197.9 support level, but the SPY could reverse itself and make another charge on the high point (209.0). Obviously, the next few days/weeks will be vital to the future direction in the market.
It's a good thing that we do not have to decide what to do now, as that is MIPS' job. So, stay tuned.
- New subscribers may want to wait a few days to see what the SPY does relative to the graph below before taking
a long position right away.
Hope this helps !!!


