Saturday, December 13 2014
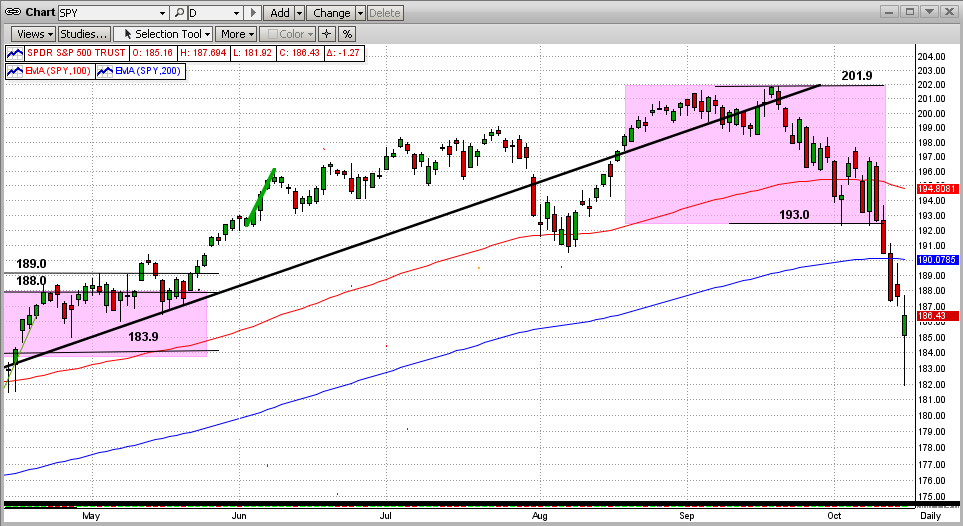
Last week the SPY broke two important support levels, one being its "first" new high of 201.9 from weeks ago and the other being its 50-day EMA (immediately below). In and of itself, this is NOT a big deal (2nd graph below).
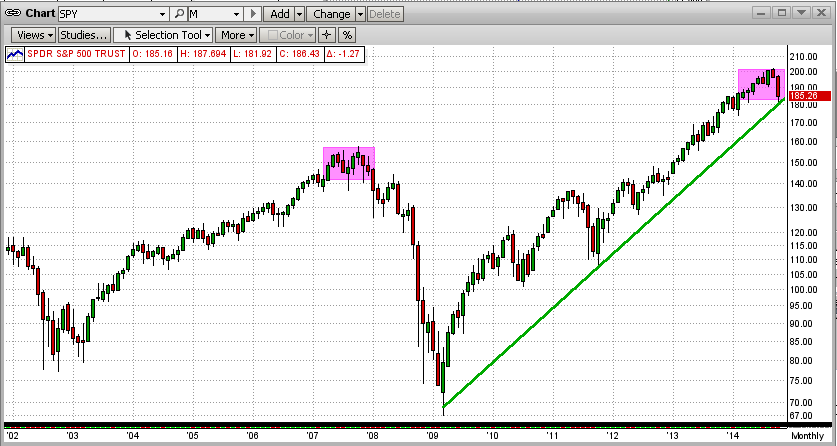
The "damage" above looks scary on a daily chart, but the weekly chart below shows that the action on the daily chart is just "noise" created by the traders on the floor of the NYSE (Ebola one day, Ukraine the next, Fed intentions after that, etc). Nothing sustainable...
Observing the chart below, one would simply ignore any fear of a big correction or bear market soon, and maybe rightly so. After all, bull markets can go on for YEARS after the market is oversold and getting worse (like in the 1990's). Maybe that is where we are today.
Bear Markets
Most bull markets that turn into bear markets need a "Catalyst" to get the fat kats to sell the shares that have made them richer (and when they do start selling, its all over). BTW, the fat kats (or big guys) in this blog are the big institutional investors, like Goldman Sachs, Morgan Stanley, UBS, Credit Suisse, etc). Basically the fat kats will ride the bull for years. In fact, as long as the little guys are feeding the bull (buying), the fat kats stay invested, riding the bull until it drops dead. But, of course, NONE of the fat kats want to be long after the bull dies and the bear moves in. Since no one really knows that day, and since the fat kats have their finger on the sell button now, any BIG NEGATIVE ISSUE that can last for years may push the fat kats to the sidelines fast and we all know what that leads to.
Right now, we may be sitting on the edge of that type of phenomenon with oil prices dropping like a rock (see graph below). Energy is one of the biggest industries in the world. As the price of oil goes, so goes some countries' entire gross national product. Oil prices have taken a 40% dive in the last six months (from $100 a barrel in May to under $60 today)!!! And, economies all over the world are weakening (Europe, China, etc.), which will result in less worldwide demand for crude oil. Those issues may be enough to keep oil prices low for a long time, and disrupt stock markets all over the world (as it did in the early 1970's, when the Dow tumbled 50%).
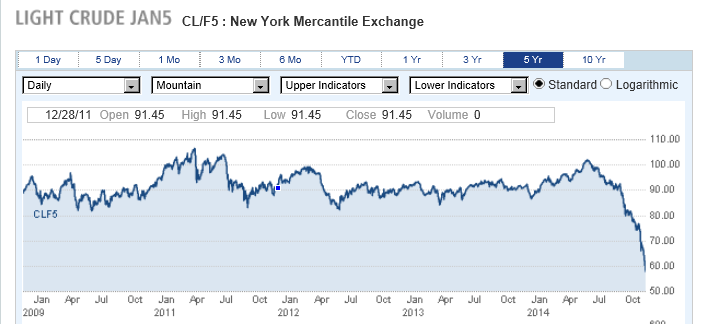
Are we there now? It's certainly possible, but not guaranteed. However, the risk is there and real.
We will have to wait for MIPS to tell us what to do.
Thursday, December 11 2014
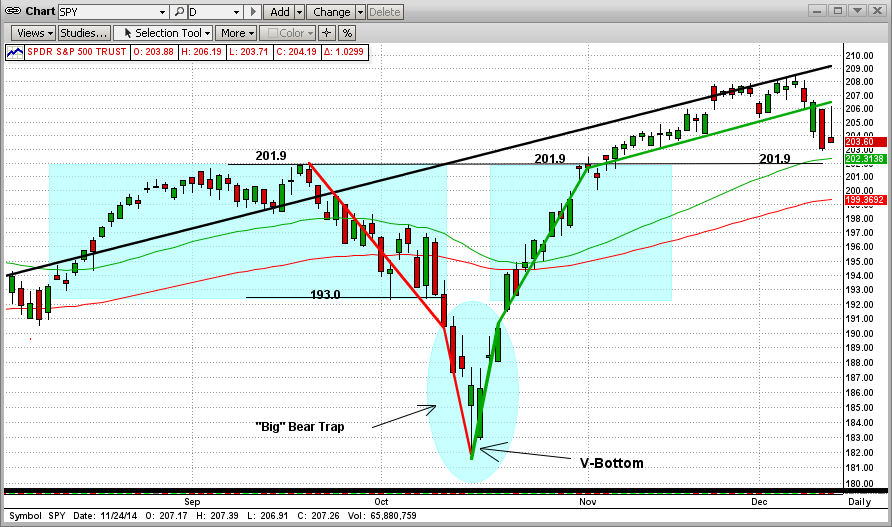
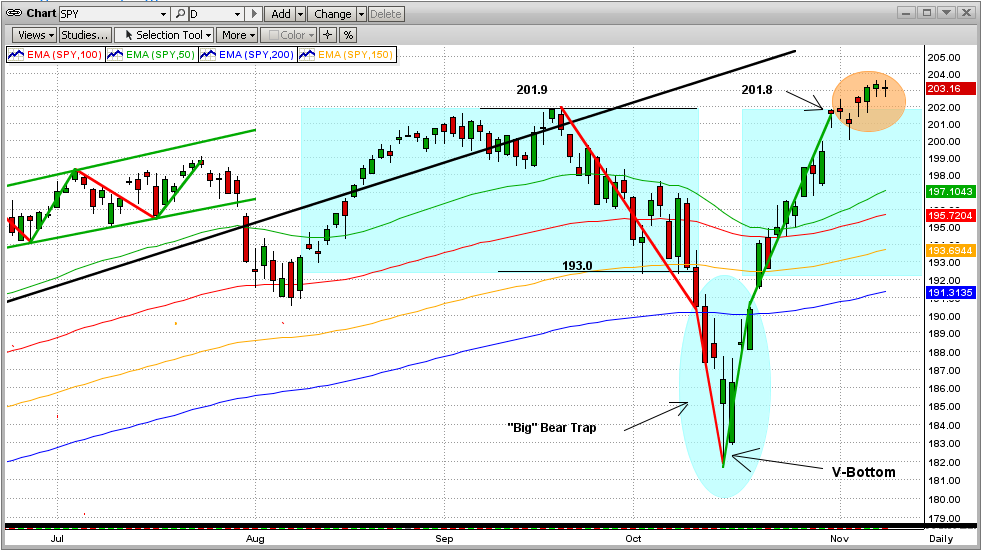
The S&P500 (SPY) did something this week that it rarely does... it did what I thought it would do. That is, it has gone into the process of re-testing its all-time high that it made on 11/03/2014. This original SPY "break-out" was at 201.9 and the market started a new uptrend rally all the way up to 208.3 on 12/05/2014.
After significant breakouts, the market will usually go back to re-test the breakout point. We believe that this reversal process began on 12/06/2014 and the SPY has headed down over the last few days, closing today at 203.5. Don't worry (yet) folks, this is the "norm", not an exception.
In the graph below, we can see that the "new-high" resistance level at 201.9 is about to coincide with the 50-day EMA (green line). Breaking this level to the downside could spell "double trouble". After that, the next resistance level is the 100-day EMA (red line at 199.3). It would not be good for the SPY to drop below that, but that by itself would not necessarily mean disaster (but it could be the start). Stay tuned!
On the other hand, if the SPY holds above the 201.9 level, we can expect a new uptrend to even higher levels than 208. This is where I would but my bet, if I were betting. But, I'm not betting or sweating; I am depending upon MIPS!!!
Saturday, December 06 2014
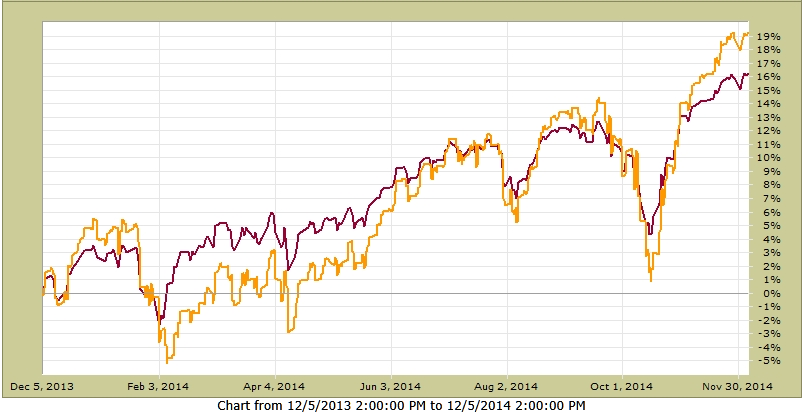
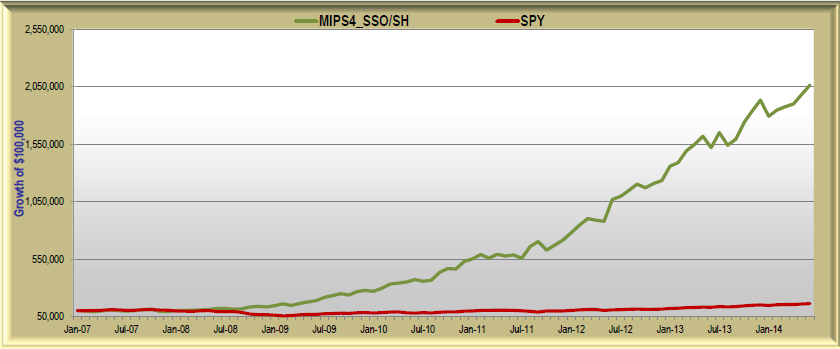
I know a lot of you are saying, "OK, MIPS4 has a good long-term performance record, but what about its more recent performance?" Our previous blog (earlier today) showed the great performance of MIPS4 trading 1/2 each of SPY/SH and SSO/SH in the last 8 years (III below). So, how did MIPS4 do with this same trading profile in the last 12 months? See the graph below from the tracking company, TimerTrac.com.
MIPS4/MF's performance trading 1/2 SPY/SH and 1/2 SSO/SH for last 12 months from from Dec 5, 2013
SPY +16.3% MIPS4 +19.3%
Saturday, December 06 2014
As most MIPS members already know, we show several possible trading profiles for our MIPS models under the "Services" tab on our main menu at www.mipstiming.com (and more under the "Trading Profiles" button on the Services page). With the MIPS models, you can trade any ETF that "correlates" well with the SPY:
(from Investopedia => http://www.investopedia.com/terms/c/correlation.asp ).
We like trading with various "mixes" of SPY and SSO on long signals, and SH on short signals (no leverage on shorts).
For aggressive investors, we recommend trading the following "mix" of SP500 ETFs:
(a) 50% of your MIPS money trading SPY and the other 50% trading SSO on long signals and
(b) 100% trading the "inverse" SPY (SH) on short signals (i.e., no double leverage on shorts).
See various trading profiles using SPY and SSO below.
Note:
(1) The scale on the Y-axis is different in each graph below.
(2) Our "Conservative" mix below performs better than most other "Growth" models on the market today.
(3) For extra '"safety", you can trade a portion of your money in each below; like 30% in (I) and 70% in (IV).
(4) We trade as described in III below.
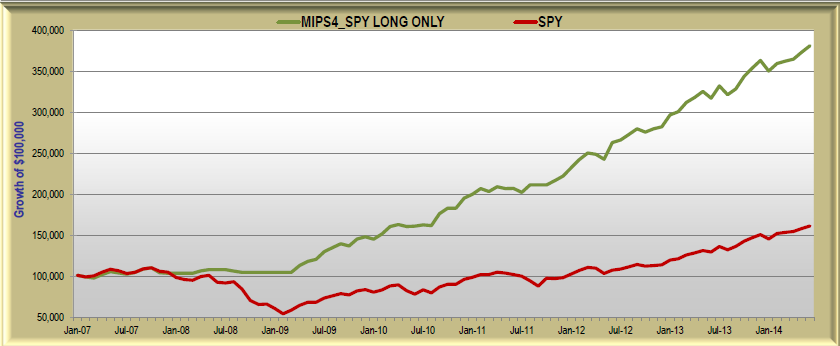
I.) CONSERVATIVE => MIPS4/MF Trading SPY Long Only (no shorts) from 2007-6/30/2014
CAGR since Jan'07 SPY=+6.6% vs. MIPS=+19.5% Max Drawdown= -6.0%
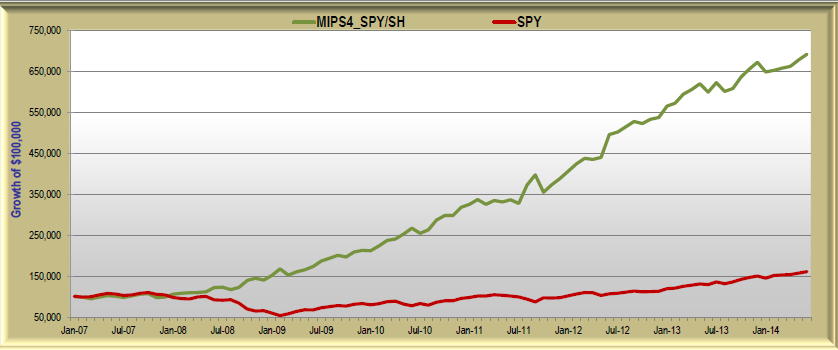
II.) GROWTH => MIPS4/MF Trading SPY/SH long/short from 2007-6/30/2014
CAGR since Jan'07 SPY=+6.6% vs. MIPS=+29.4% Max Drawdown= -10.6%
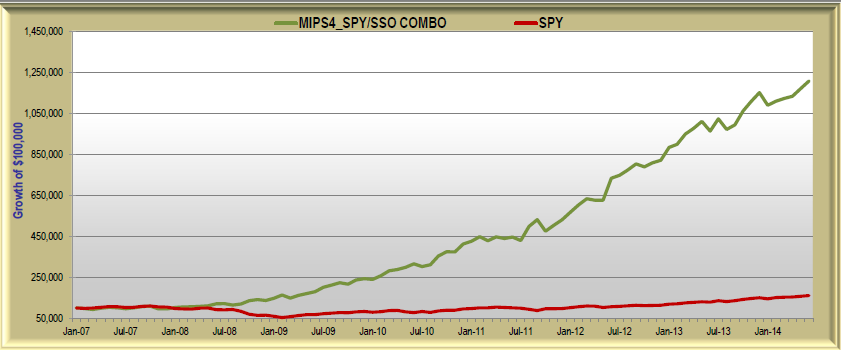
III.) AGGRESSIVE => MIPS4/MF Trading 50% in each of SPY/SH and SSO/SH Lg/Sht from 2007-6/30/2014
CAGR since Jan'07 SPY=+6.6% vs. MIPS=+39.4% Max Drawdown= -12.2%
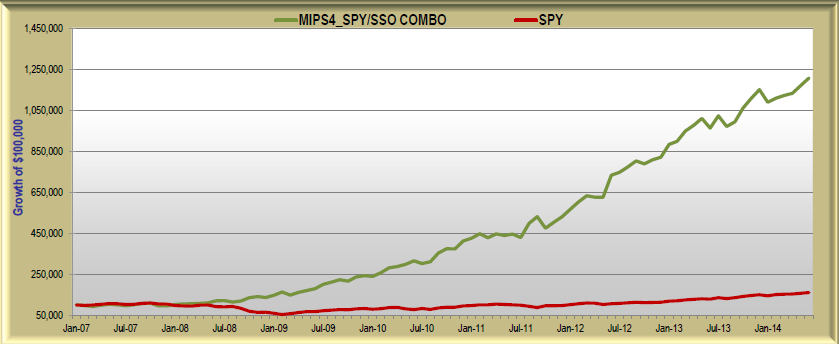
IV.) ULTRA AGGRESSIVE => MIPS4/MF Trading SSO/SH long/short from 2007-6/30/2014
CAGR since Jan'07 SPY=+6.6% vs. MIPS=+49.7% Max Drawdown= -16.1%
Good "mixing" to all !!!
Sunday, November 09 2014
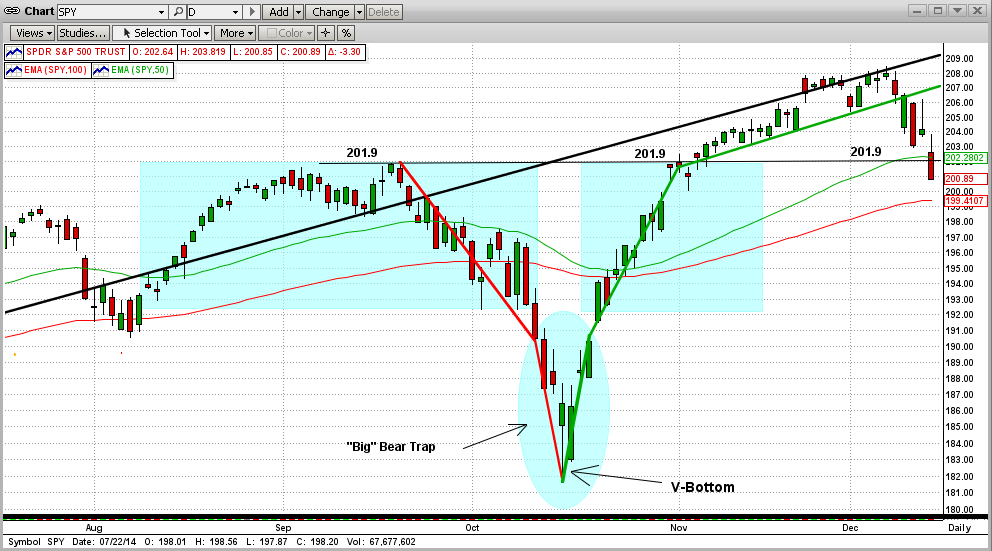
As you all know by now, the SPY hit an all-time high on 11/03/14 after a strong "V-Bottom" pattern following the big 4-week drop that started on 9/19/14. From this, one may think that we are in for a large number of "new highs" for months to come. Not so fast !!!
For that to happen, the SPY must clearly and strongly stay above its previous new high at 201.9. This could take several weeks like it did in the 3-month period in late April'14 to mid-May'14 (see the graph we called "No Man's Land" in our blog from 5/12/14 below). This was a long, sideways trading patten that took over 50 trading days of sideways trading before the SPY broke to the upside. This could happen again, but it does not have to.
There is tremendous "resistance" when the market approaches a new high after a big dip like the one we just had. Almost everyone in the market wants to "get out at the top" before a big dip. And, when they don't get out at the top and the market falls, most investors are kicking themselves and promising themselves that if the market goes back up to or near its last top, they are going to bail out!!! So, there is a tremendous amount of built up selling pressure at or near the last high, and, hence, it takes a tremendous amount of buying demand to push the market up through all of the looming sell orders. That is why the market can move sideways for so long at or near a strong resistance level.
From the viewpoint of the bears, if the market tries and cannot substantially rise above the "new high" resistance level after say 4-5 tries, the market will most likely drop all the way back to its most recent "support" level (which in this case is the bottom of the V-Bottom at about 191.6. (That's a long way down, but this would indicate a possible "correction" rather than an all-out market "crash").
Even though the market can move any way from here, my vote is up. But, my vote will not buy much. We need to sit back and relax (as if that is possible) and wait for MIPS to tell us what to do.
MIPS4/MF trading 1/2 each of SPY/SH and SSO/SH since 2007 (verified since 4/20/2013, backtested prior).
SPY CAGR = 6.6% MIPS CAGR = +39.4% Max DD = -12.2%
Saturday, November 01 2014
The stock market is arguably at the most critical point in its six-year uptrend that started in 2009. The SPY is very near its "all-time high" that it has failed to grow above in the last 10 weeks (and in fact dropped way below). And, "all-time highs" are a tough resistance level to break at any time. Let's see why.
Resistance Levels
Resistance levels are "deemed" price levels that up-trending markets are going to have trouble breaking above. So, why are new-highs "deemed" resistance levels and why are they hard to break above? Simply because lots of traders bought at those levels or at least are waiting for the market to reach those levels so they can sell. Problem is, they did not sell at the all-time high levels the last time and are (and have been) waiting for the market to get back to its all-time high. When the market is below its all-time high, most traders and investors are sorry (or sick) that they did not dump at the all-time high level. So, many are impatiently waiting and determined to sell if or when the market gets back to its all-time high level (lots of pent-up supply there).
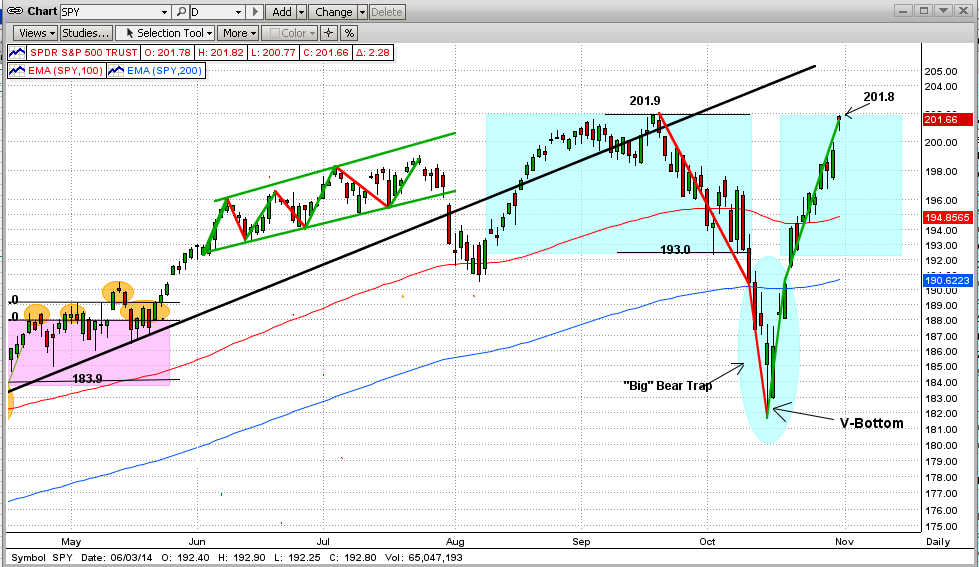
SPY Chart
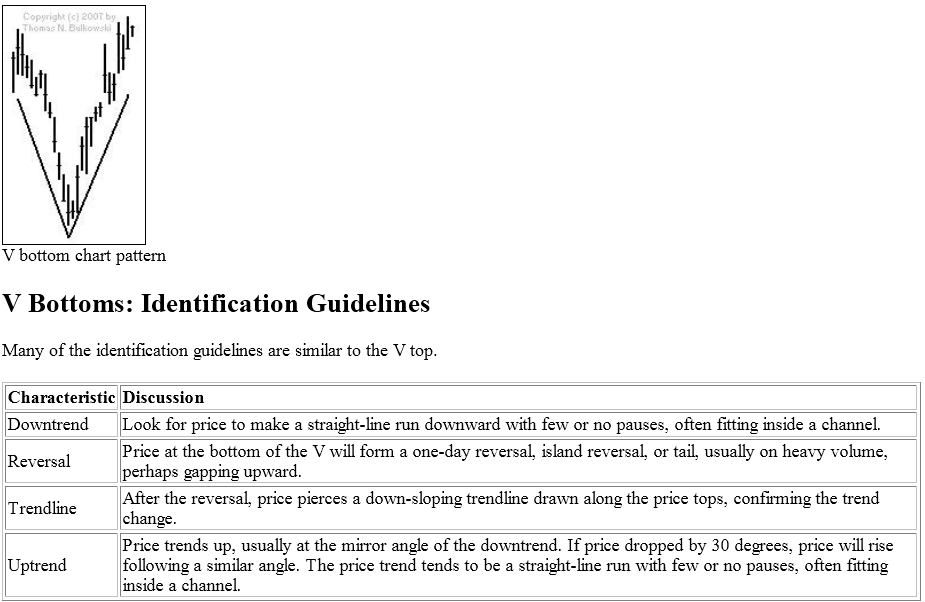
The SPY price chart is telling us multiple things (see graph immediately below). First, the SPY formed a dramatic V-Bottom. You can see the V-Bottom pattern in the graph immediately below (see a detailed explanation of a V-Bottom pattern from Bulkowski in the 2nd graph below). The V-Bottom is extremely important here because: (1) it formed a near-perfect, symmetrical up-and-down trend, (2) the downtrend was stopped by a perfect one-day key reversal, and (3) the top of the uptrend is less than 1/20th of 1% from the SPY's all-time high. Wow! V-Bottoms like this usually are identifying a market bottom (but it CAN be just a short-term bottom).
Critical Point
We are at a critical point in this market, and only time will tell which way we go from here.
If the SPY fails to break above its all-time high of 201.9 in the next few days, it will most likely keep trying for the next few weeks, Remember, to call it a "break above", the SPY needs to break significantly above 201.9 and stay there for a while. If this does happen, the market could then go into "panic buying" because everyone that is not in the market is sick and determined to "join the party". Remember, the four stages of market development after a big turnaround like 2008 into a new bull market are: (1) Pessimism, (2) Skepticism, (3) Optimism, and (4) Euphoria.
On the other hand, if the SPY tries several times and fails to break above 201.9, we could then see the big crash that we have all been anticipating. This could be ugly, but we believe that MIPS will make us money in the market fall as it alway has in the past. Stay Tuned.
V-Bottoms
http://thepatternsite.com/patternz.html
Friday, October 24 2014
Over the last few weeks/months, we have been asked many times,
1) Why is the recent MIPS trading frequency so low, and
2) Will the MIPS models react fast enough to catch real "market crashes" ??
First, the past trading history for the MIPS3 and MIPS4 models has been about 10-18 trades/year. But, the trading frequency of the MIPS models in the last two years has been the very lowest in the nine-year history of any of the MIPS models. This is basically because the market has been so strong recently (very strong up-trend) that it will take a lot of negative market action to get the MIPS models to change their direction. For example, when the market is lackadaisical, MIPS3 or MIPS4 may change direction with a 2-4% market dive, but at other times (like now) when the market has been super strong, even a 9% dive was not enough to get the MIPS models to change direction. In other words, the resistance of the MIPS models to a market change is somewhat "relative". Its kind of like comparing the condition of a really strong, healthy young man that falls off of a high cliff while hiking to the condition of his grandfather who fell of the same cliff at the same time. Most likely, the strong young man would be in a better condition a few days after the accident. [Of course, there are hundreds of other factors that determine a MIPS change, so don't just bank on "relative" changes.]
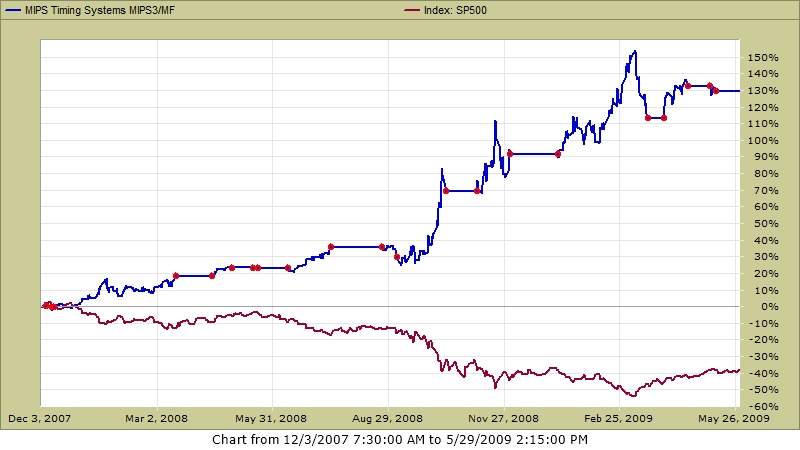
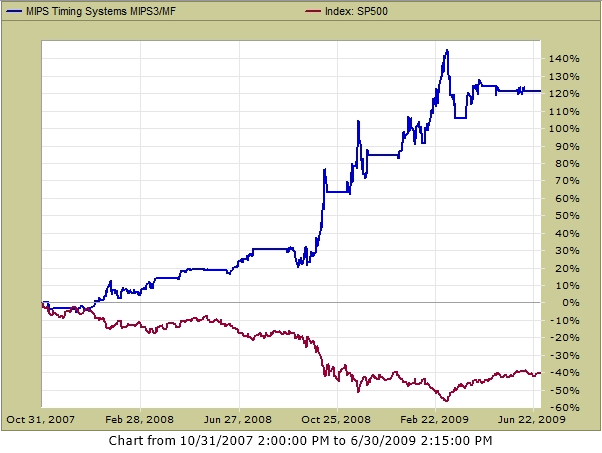
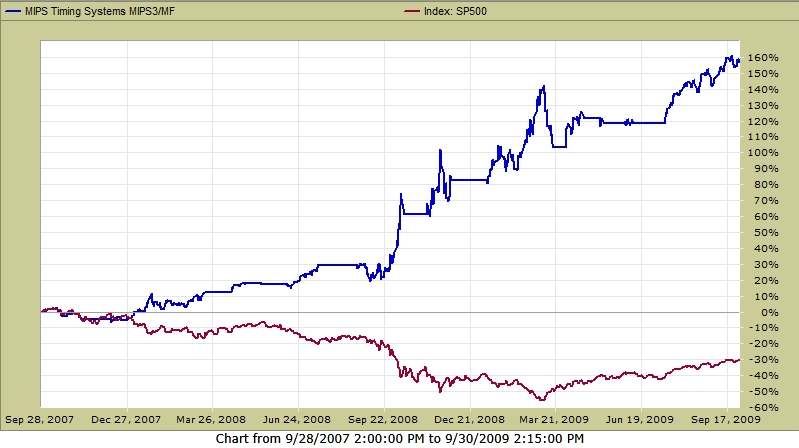
Second, the only real "live" experience we have with market crashes in the U.S. markets was during 2008-09 (actually, the eighteen months from 12/01/2007 - 05/30/2009). See the graph immediately below, with MIPS "trades" shown as red dots on the graph (during this time, MIPS3 traded 21 times or approx 14 trades/year). You will see that MIPS3 went short well before much downside damage had been done, and the model performed brilliantly during this entire period. Believe it or not, backtest results show that MIPS4 would have done even better !!!
MIPS3 +130% SPY -38%
For the record, the actual, live trades from TimerTrac.com for this period are shown below.
TimerTrac.com
Trades for the strategy MIPS Timing Systems MIPS3/MF between
Saturday, December 1, 2007 and Saturday, May 30, 2009.
Times are mountain time, MST (GMT -7) / MDT (GMT -6).
* Note: For this strategy, any trades within the last 30 days are not shown.
| Date |
Distribution |
Percentage |
Comment |
| 12/6/2007 5:10:00 PM |
Mips Long |
100 % |
|
|
Mips Short |
0 % |
|
|
MMF |
0 % |
|
| 12/11/2007 5:10:00 PM |
Mips Long |
0 % |
|
|
Mips Short |
0 % |
|
|
MMF |
100 % |
|
| 12/12/2007 5:10:00 PM |
Mips Long |
0 % |
|
|
Mips Short |
100 % |
|
|
MMF |
0 % |
|
| 3/14/2008 5:10:00 PM |
Mips Long |
0 % |
|
|
Mips Short |
0 % |
|
|
MMF |
100 % |
|
| 4/11/2008 5:10:00 PM |
Mips Long |
100 % |
|
|
Mips Short |
0 % |
|
|
MMF |
0 % |
|
| 4/29/2008 5:10:00 PM |
Mips Long |
0 % |
|
|
Mips Short |
0 % |
|
|
MMF |
100 % |
|
| 5/15/2008 5:10:00 PM |
Mips Long |
100 % |
|
|
Mips Short |
0 % |
|
|
MMF |
0 % |
|
| 5/19/2008 5:10:00 PM |
Mips Long |
0 % |
|
|
Mips Short |
0 % |
|
|
MMF |
100 % |
|
| 6/11/2008 5:10:00 PM |
Mips Long |
0 % |
|
|
Mips Short |
100 % |
|
|
MMF |
0 % |
|
| 7/15/2008 5:10:00 PM |
Mips Long |
0 % |
|
|
Mips Short |
0 % |
|
|
MMF |
100 % |
|
| 8/22/2008 5:10:00 PM |
Mips Long |
100 % |
|
|
Mips Short |
0 % |
|
|
MMF |
0 % |
|
| 9/4/2008 5:10:00 PM |
Mips Long |
0 % |
|
|
Mips Short |
100 % |
|
|
MMF |
0 % |
|
| 10/10/2008 5:10:00 PM |
Mips Long |
0 % |
|
|
Mips Short |
0 % |
|
|
MMF |
100 % |
|
| 11/5/2008 5:10:00 PM |
Mips Long |
0 % |
|
|
Mips Short |
100 % |
|
|
MMF |
0 % |
|
| 12/1/2008 5:10:00 PM |
Mips Long |
0 % |
|
|
Mips Short |
0 % |
|
|
MMF |
100 % |
|
| 1/7/2009 5:10:00 PM |
Mips Long |
0 % |
|
|
Mips Short |
100 % |
|
|
MMF |
0 % |
|
| 3/18/2009 5:10:00 PM |
Mips Long |
0 % |
|
|
Mips Short |
0 % |
|
|
MMF |
100 % |
|
| 3/31/2009 5:10:00 PM |
Mips Long |
100 % |
|
|
Mips Short |
0 % |
|
|
MMF |
0 % |
|
| 4/17/2009 5:10:00 PM |
Mips Long |
0 % |
|
|
Mips Short |
0 % |
|
|
MMF |
100 % |
|
| 5/6/2009 5:10:00 PM |
Mips Long |
100 % |
|
|
Mips Short |
0 % |
|
|
MMF |
0 % |
|
| 5/8/2009 5:10:00 PM |
Mips Long |
0 % |
|
|
Mips Short |
0 % |
|
|
MMF |
100 % |
|
Copyright © 1999-2014 TimerTrac.com. All Rights Reserved.
Thursday, October 16 2014
The short-term view of the market looks terrible and simply could not look much worse. In the last 3 weeks the SPY has fallen about 9% from its all-time high of $201.9, broke through the bottom of its most recent trading pattern, broke through both the 100-day and 200-day EMAs, etc. Like I said, couldn't be much worse. One good note yesterday (Wednesday) was that the price action in the 2nd half of the day could represent a "One Day Key Reversal" pattern, which usually identifies a short-term rebound.
Should we be worried?
Remember, we are intermediate-term investors and not day traders. After the strong ride we have had in the stock market in the last 3-5 years, a short-term drop does not usually cause MIPS to signal a directional change in the stock market. [In other market conditions where the intermediate-term trend had only gained say 10-15%, a dip as small as 2-3% would catch MIPS' attention.] In other words, all changes in the price movement of the SPY are looked at by MIPS on a "relative" basis. For example, a 3% drop in a market that has been up 10% represents a 30% setback, whereas an 9% drop in a market that has been up 50% represents only an 18% setback. And, a market that grows 50% will recover a 9% setback quickly.
Long-Term View
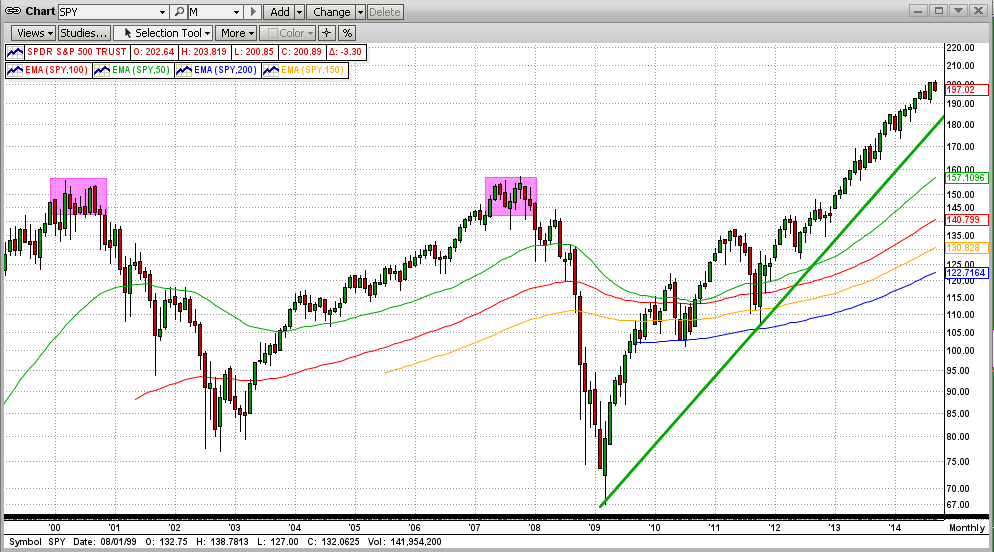
There is one thing that investors need to concentrate on to become successful long-term investors. They must be able to somewhat ignore short-term (daily) gyrations in the market and put more emphasis on the long-term view. Looking at the monthly chart below, we can see that the disaster on the daily chart above is hardly noticeable on a monthly chart.
Topping Process
- Is the market topping?
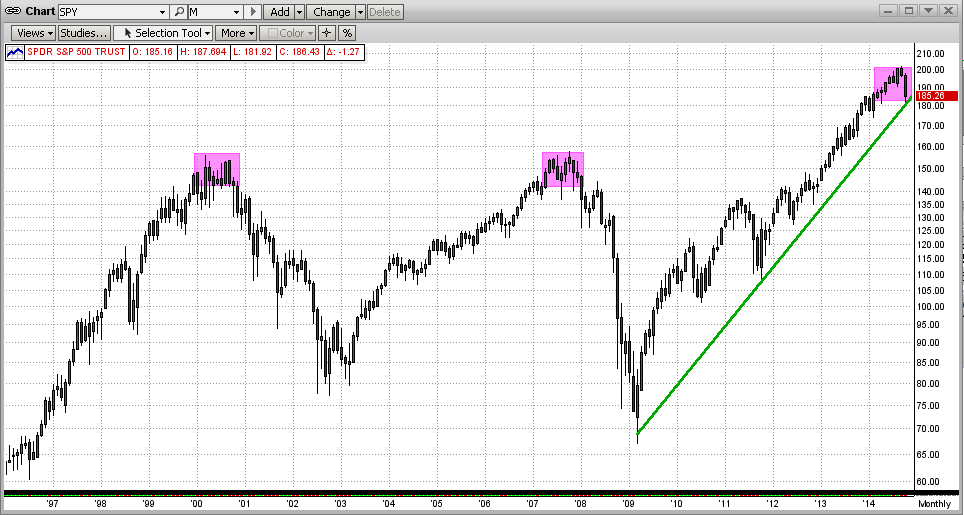
The good news is that strong bull markets (4-6 years up) do not turn around easily or quickly. For this, let's look at the two most recent market "crashes", one in 2000 and the other in 2008. From the graph below, we can see that it took 8-10 months for these bull markets to give up and collapse. At this time, we are about 1/2 of the way through this process. Of course, the market in October could be the catalyst for the "Big One".
Our Goal
Our goal in MIPS is to capitalize on at least 80% of each major market crash. We do this by being willing to give up 10% on each end of the cycle to make sure that we capitalize on the other 80%).
What if this is the beginning of the "Big One" ?
For that, we have to rely on MIPS. All of the MIPS models are now on the edge of going short, but they have not yet issued new short "Signals". Sometimes that is a blessing.
The MIPS models have been around since 2004, and the MIPS3/MF signals have been tracked by TimerTrac.com since 11/04/2005. During that time, we have had several intermediate-term downtrends and MIPS has profited from most of them (of course, MIPS also beats the SPY in up markets by detecting and shorting these intermediate-term downtrends).
We have had only one really big stock market "crash" in this 9-year timeframe from 2005 and that was from 4Q'07-2Q'09, when the S&P 500 dropped by over 50%. How did MIPS do in that market? For that, see the graph below for the period of the last big market crash using verified MIPS3/MF signals from TimerTrac.com.
MIPS3/MF +120% SPY -40%
Thursday, September 25 2014
We all know that the stock market moves in "cycles", but many people cannot recognize them as such. To many investors, these cycles look like highly-volatile movements, but most really are just normal fluctuations. If you cannot decipher normal cycles as such and no more, you may not sleep well investing in the stock market. I personally learned how to do so over the years and thought that some of my tips may help you.
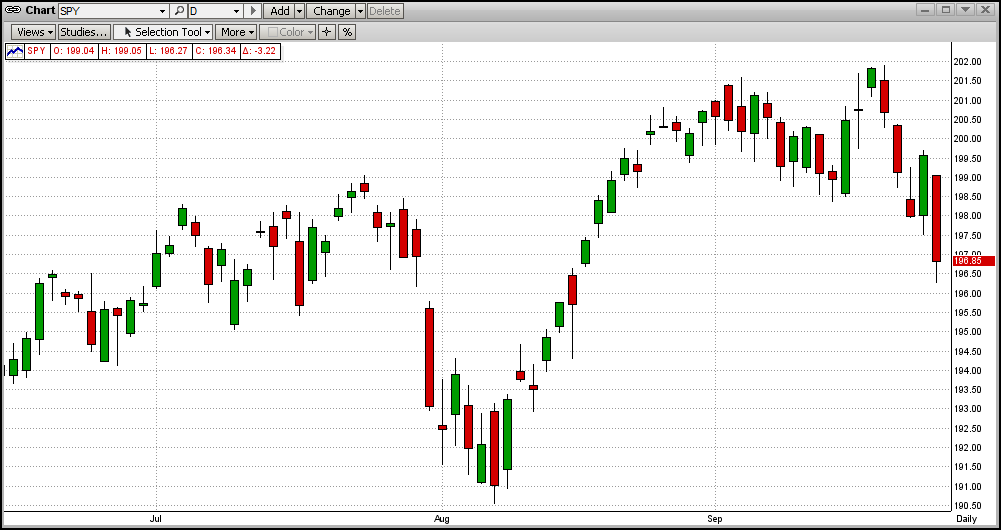
DAILY VOLATILITY
First, let's take a look at the moves in the SPY in the last few months (graph immediately below). The SPY movements in this graph are fairly representative of the last couple of years. Given that these "bars" represent your hard-earned money (retirement stash?), this can be unsettling. But, maybe it should not be. To see this more clearly, you need to step back a bit and look at it from a very different vantage point.
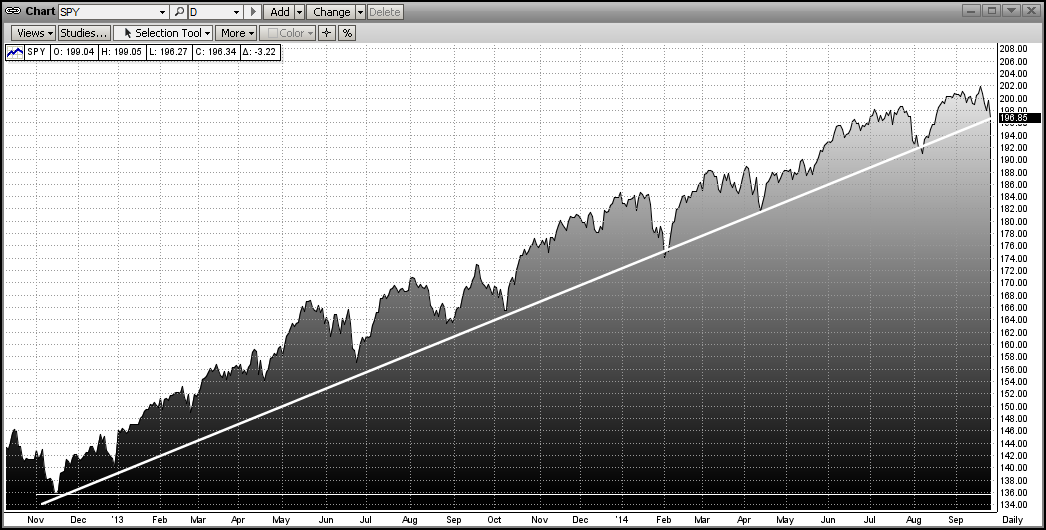
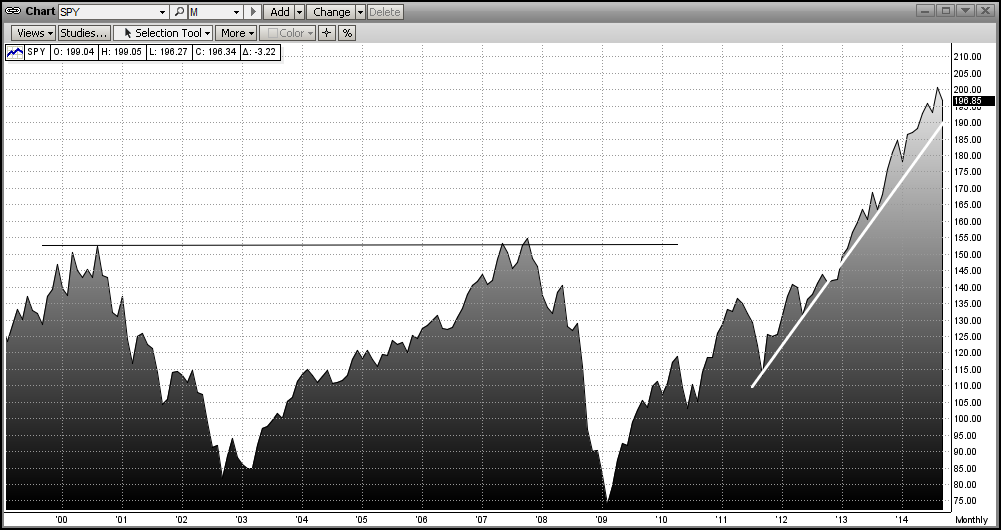
2-YEAR UPTREND
The graph below shows the price of the SPY since mid-Nov 2012 in a very different way (dark part). From this you can see a very definitive uptrend (white line). We all know that uptrends are made of higher-highs and higher-lows. The trendline in an up market is drawn along the bottoms of the higher-lows (just the opposite of being in a downtrend). Following the trend, this graph shows a 47% gain in the SPY (and, of course, in your money). BTW, if you had been trading 1/2 each of SPY/SH and SSO/SH (e.g., 1/2 double leverage on long signals), your gains would have been more like 65-70%.
Now, here is how you can sleep with this volatility: "Always consider the value of your portfolio to be the value on the trendline, no more". That is, do not consider the money above the trendline to be "your money" because the market is going to come back to the trendline over-and-over again until the trend runs its course. [What to do then is another topic in itself, and it entails knowledge and use of the MIPS models.]
MONTHLY GRAPH
While you are enjoying watching the trend (and MIPS) making you money (or coming to an end), you can also sleep better at night along the way by looking at the same movements of the SPY on a weekly or even monthly basis. See the above trend on a monthly graph below (white trendline). Even if you look very carefully at the monthly graph below, you will NOT even be able to see the market volatility in the first graph above that kept you up at night. So, maybe you have been worrying about nothing !!!
MIPS IN MARKET CRASH OF 2008
And again, don't be afraid of a market crash. Embrace it. Down markets are where MIPS should really make us big money, as it did in 2008 (see verified graph of MIPS3/MF trading SPY/SH from TimerTrac.com below).
Tuesday, September 23 2014
It is not really whether or not a market crash is coming, it's when. How do we know this? Because the big-bad-bear ALWAYS comes.
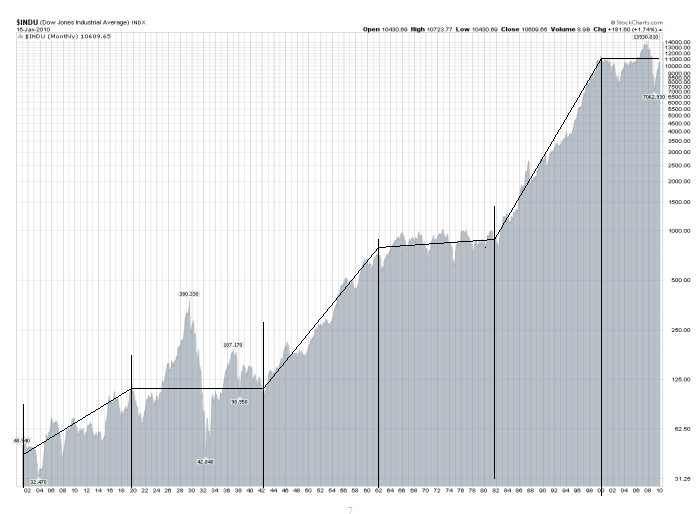
The very same "evidence" that Buy and Hold pundits (liars) use to prove that buy and hold works, actually proves that it does not !!! Their basic evidence is the "100 Year Dow" graph below. Upon close examination, starting with 1900-1920, you will see 20 good years followed by 20 flat/down years, over-and-over. BTW, being flat or "even" after 20 years is really a tremendous loss, because one would have doubled their money over 20 years with bonds paying only 3.6% !!!
From the graph below it would seem that, if people lived 100 years or more, the Buy/Hold liars may have a point. But most investors' prime "equity" investment years are from the time that they are say 45 years old (bought house, kids in college, career sound, etc.) until they are 65 years old (approaching retirement, need safe investments, more money in bonds, etc.). So, the prime time span for investors having a large portion of their portfolios in equities is about 20 years.
In the last 110 years, the 20 good/bad periods were:
Good 1900-1920 1940-1960 1980-2000
Bad 1920-1940 1960-1080 2000-????
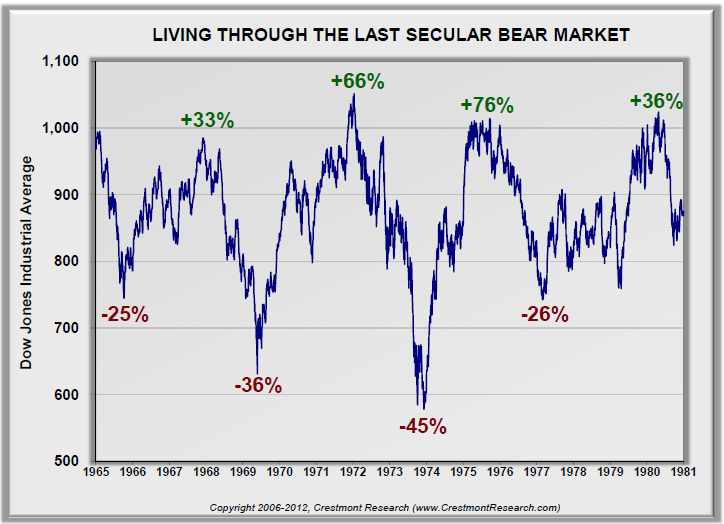
Almost everyone knows that the stock market in 1920-1940 experienced the biggest crash in the last 110 years, and we have personally "lived" through the market ups/downs in 2000-2013. But, what about the market in 1960-1980? For that, see the graph below. One could say that the graph speaks for itself.
It should be obvious by now that this leaves the time period 2000-???? to dissect. Will we have another big drop? If so, when? And, how fast will the market turn down and will MIPS catch the turn? My experience has shown the market crashes that result from bad fundamentals change slowly (long bubbles like housing, etc.), whereas crashes that come from surprise "events" (like Lehman Bros.) change quickly.
See the graph between 2000-2013 below. We all know (unfortunately) that we have had two big market drops of over 50%. You will probably be relieved to see that, at the top, these markets traded in a range of (+ and -) 5% of their market tops for 9-10 months, before they headed down fast !!!
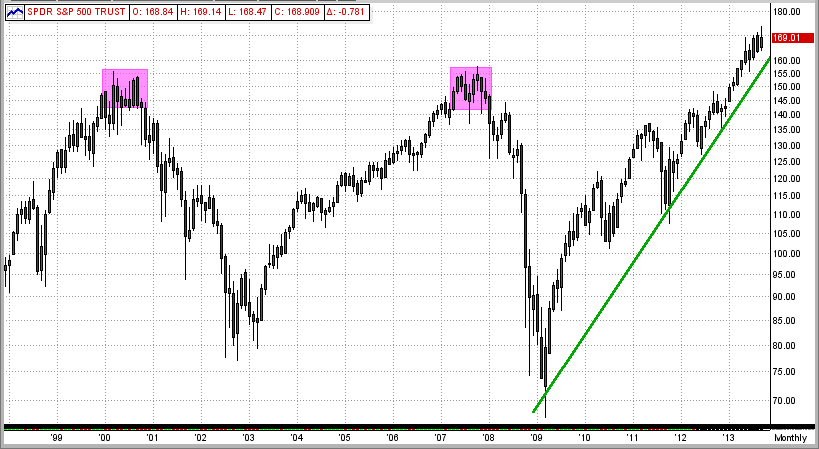
How did MIPS handle the BIG market crash of 2008?
- Well, it started with a short call on 12/12/07 for a 12% gain, followed by 4 other profitable short trades.
- Total gain of about +40% on the last 3 short trades between Sep'08 - Mar'09) !!!
- See graph below. What, me worry?
Legend: Red Boxes = Short Signals; Green Boxes = Long Signals; Yellow Boxes = Cash
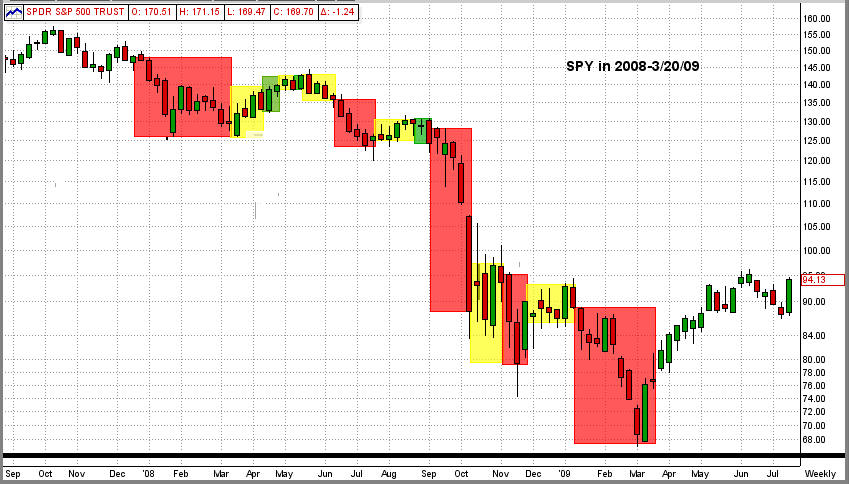
Graph below is the MIPS3/MF performance in 4Q'07 - 3Q'09 using "verified" trade signals on TimerTrac
|


