This blog attempts to explain why you see "wild price action" when MIPS doesn't. The explanation below is indicative of a lot of the math in MIPS, except for the algorithms we use to "speed things up" (trade faster) when required.
First off, this is because MIPS looks at "wild price action" in a slightly different way than we do. We look at daily market movements, caused mainly by NYSE floor traders who change their minds within minutes, hours, or just a few days after making huge trades. MIPS knows this from their "volume weighted data" trades. Since these floor traders create the "wild price action" on daily charts (and they can change direction on a dime), the MIPS models mimimize their short-term, wild price action in strong up or down markets (but, not so in slow-moving or flat markets). Needless to say, from a "technical analysis" standpoint, MIPS closely monitors price action and the "patterns" it they creates.
You don't need a MIPS model to show you this, you can see the "wild price action" disappear if you have the discipline and patience to look for it on weekly and monthly charts and wait until new trends develop. This is not what MIPS does, but it is a good example of looking deeper (certainly not recommended for actual trading signals).
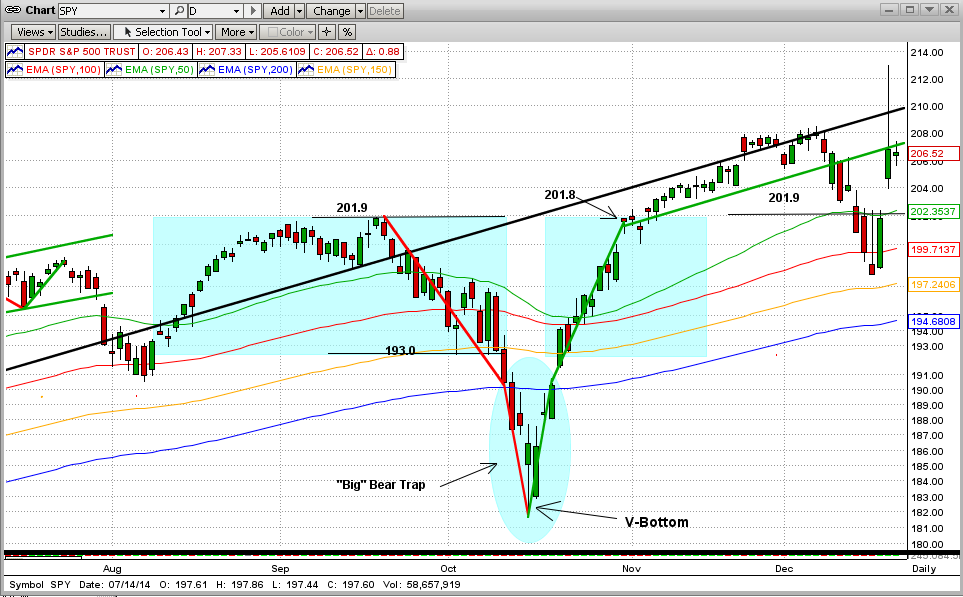
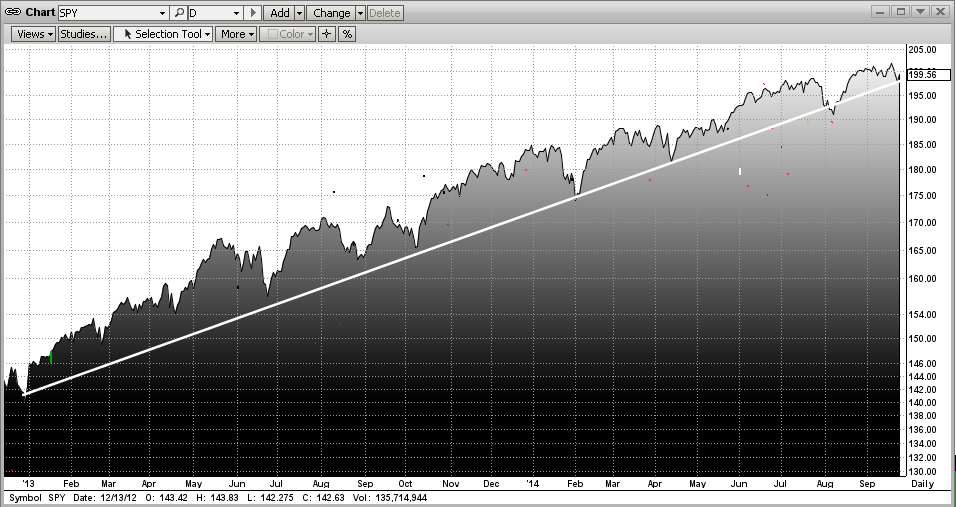
DAILY
The "wild price action" below is what you see in the daily charts... looks terrible and "all over the map" (NO consistency). There is seemingly no trend at all, but you are being "fooled".
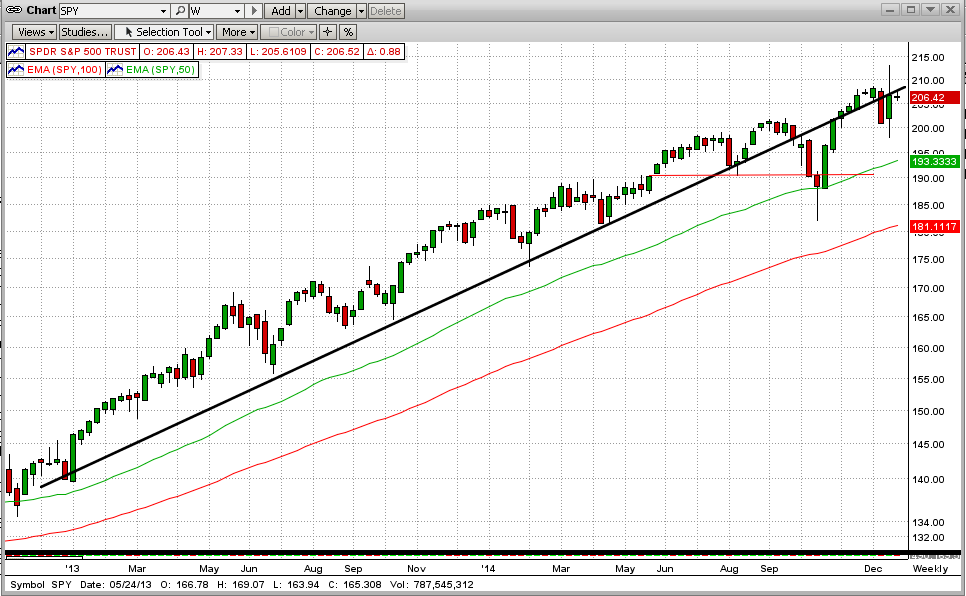
WEEKLY
If we just step back a little and look at this price action from more of an intermediate-term view, things look completely different. In fact, we can then see actual trends, etc. without being fooled by the wild movements caused by the floor traders that have nothing to do with us or the way we invest. Some Nervous Nelly, sick from wild daily movements, who at least had checked the weekly daily price action would have seen only one period of serious deviation, and it did not last long (only one "break" in the dominant trend). And, if that trend could have quickly been identified as a "V-Bottom", anyone in their right mind would have avoided trading it (like us).
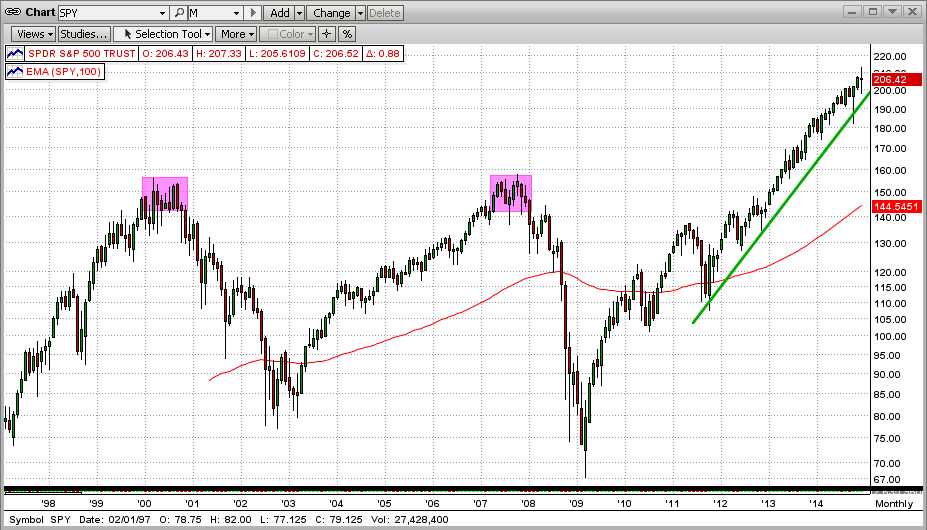
MONTHLY
Although MIPS follows primarily intermediate-term trends with hundreds of indicators and proprietary algorithms, we get our quick "peace of mind" by checking the long-term monthly charts. At this time, we can still see a strong (yes, still a strong), almost perfect trendline going all the way back to 2012 without even a "hint" of a new downtrend coming (that is, no new "inflection point"). Of course, this can change at any time, so we WOULD NOT use monthly data to help us decide when a trend is changing (but more to decide when it is not changing).
In reality, we use much faster-moving algorithms to calculate our "Inflection Points". Any investor who cannot sleep well with a trend like the one below that we are following now (and with models like MIPS) needs to either (a) turn their trading decisions over to others (advisors, etc.), or (2) buy-and-hold, or (3) quit investing in equities.
NET BOTTOM LINE
The MIPS models are more likely to simply "follow" a strong trend as in the graph below (higher highs, higher lows) than to attempt to trade the cycles above the trendline, and get whipsawed. Of course, MIPS doe not simply "follow the trend", but this example is "directionally" correct.
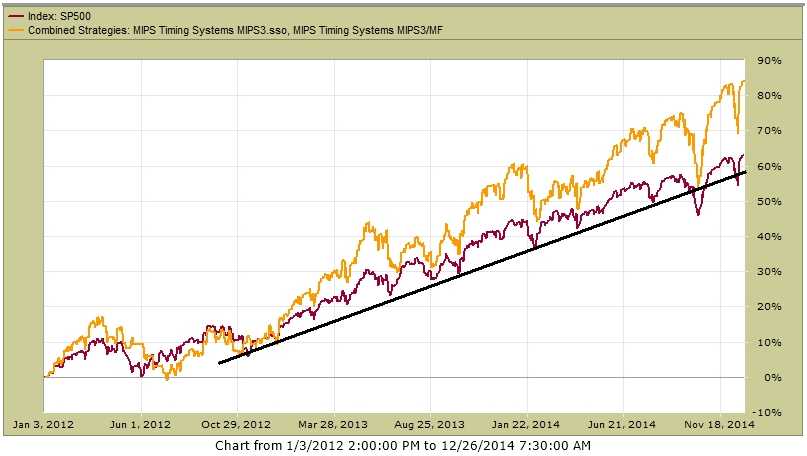
HOW DID MIPS DO IN THIS STRONG UPTREND ?
MIPS was able to avoid getting whipsawed in the recent turbulence due to algorithms that we have built into the models that act differently during strong trends (more tolerant) than they do in weak or flat markets (move quickly).
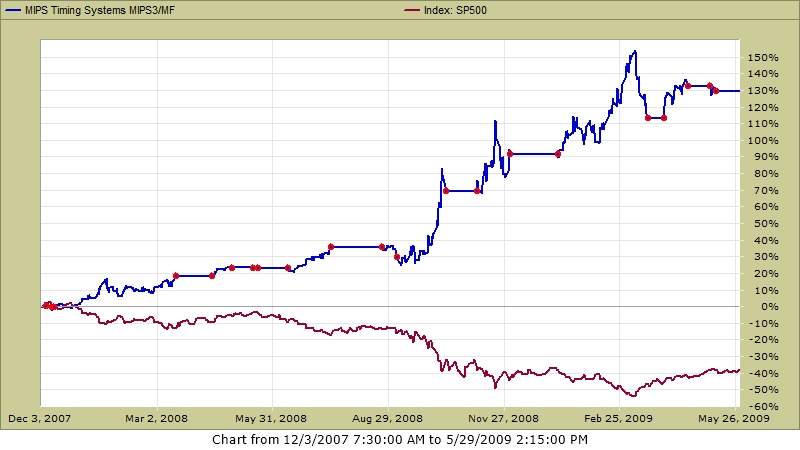
During the last three years, MIPS3 and MIPS4 were up about 85% (hard to beat that). But, one might say, there are other models that have stayed long and produced decent gains, right? True, but many of these other models almost always stay long, and trade very infrequently. So, to be sure, one MUST find out how these other models perform in down markets and in actual market crashes? See the 2nd graph below to see how MIPS did in 2008 (MIPS up 135%; SPY down 40%).
MIPS IN DOWN MARKETS (2008)
MIPS in 2008 (red dots show trades) MIPS +130% SPY -40%
HIGHER FREQUENCY TRADING
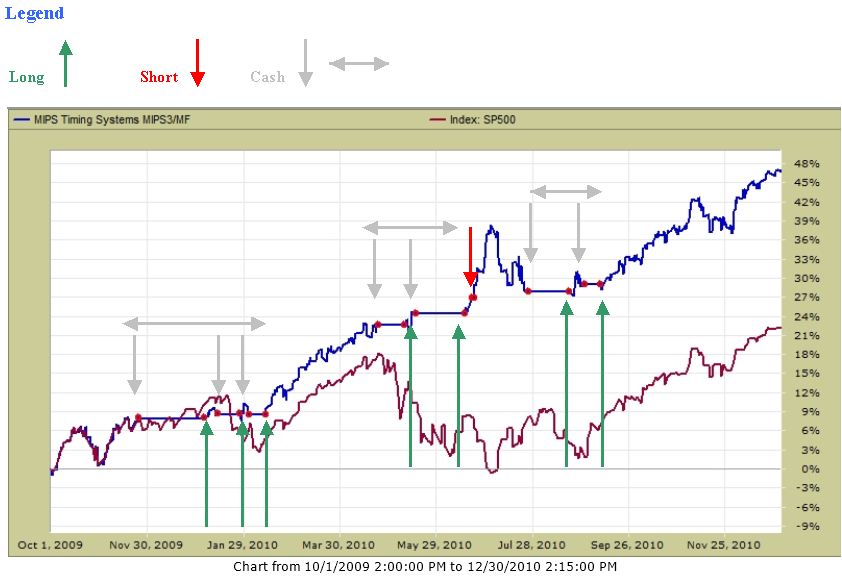
When we have a very solid trend and MIPS does not trade very often (like now), our members start to ask "Does MIPS ever trade more often (faster)? Of course, the answer is YES, as can be seen above in 2008 and below in 2010. Without a constant long-term trend, MIPS will do what it does best... namely, trade faster to successfully follow the intermediate-term trends as it did in 2010. No MIPS models has ever issued more than 25 trade signals in any year.
MIPS in 2010
- Red dots show the 17 trades in 2010