As most MIPS members already know, we show several possible trading profiles for our MIPS models under the "Services" tab on our main menu at www.mipstiming.com (and more under the "Trading Profiles" button on the Services page). With the MIPS models, you can trade any ETF that "correlates" well with the SPY:
(from Investopedia => http://www.investopedia.com/terms/c/correlation.asp ).
We like trading with various "mixes" of SPY and SSO on long signals, and SH on short signals (no leverage on shorts).
For aggressive investors, we recommend trading the following "mix" of SP500 ETFs:
(a) 50% of your MIPS money trading SPY and the other 50% trading SSO on long signals and
(b) 100% trading the "inverse" SPY (SH) on short signals (i.e., no double leverage on shorts).
See various trading profiles using SPY and SSO below.
Note:
(1) The scale on the Y-axis is different in each graph below.
(2) Our "Conservative" mix below performs better than most other "Growth" models on the market today.
(3) For extra '"safety", you can trade a portion of your money in each below; like 30% in (I) and 70% in (IV).
(4) We trade as described in III below.
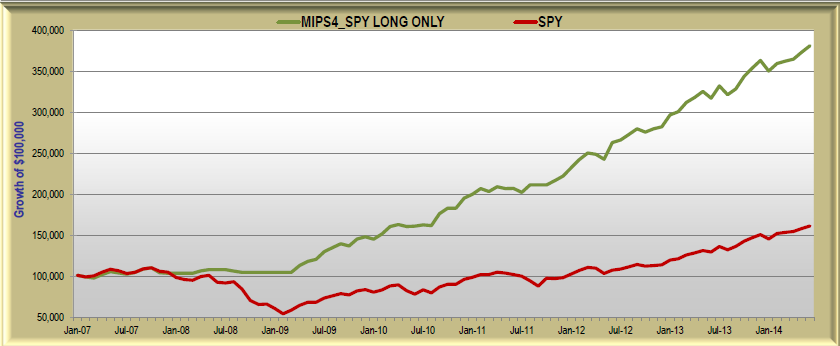
I.) CONSERVATIVE => MIPS4/MF Trading SPY Long Only (no shorts) from 2007-6/30/2014
CAGR since Jan'07 SPY=+6.6% vs. MIPS=+19.5% Max Drawdown= -6.0%
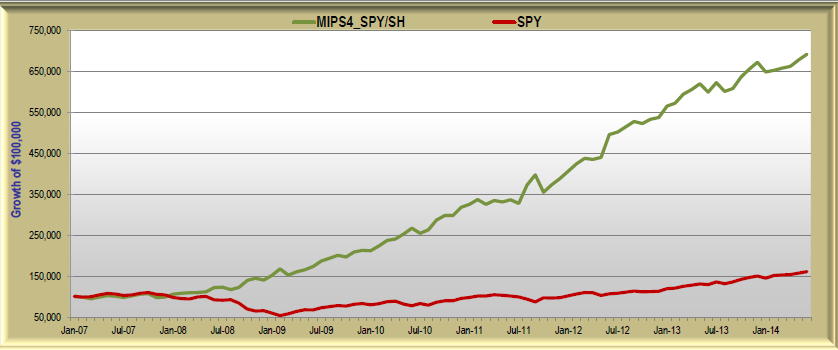
II.) GROWTH => MIPS4/MF Trading SPY/SH long/short from 2007-6/30/2014
CAGR since Jan'07 SPY=+6.6% vs. MIPS=+29.4% Max Drawdown= -10.6%
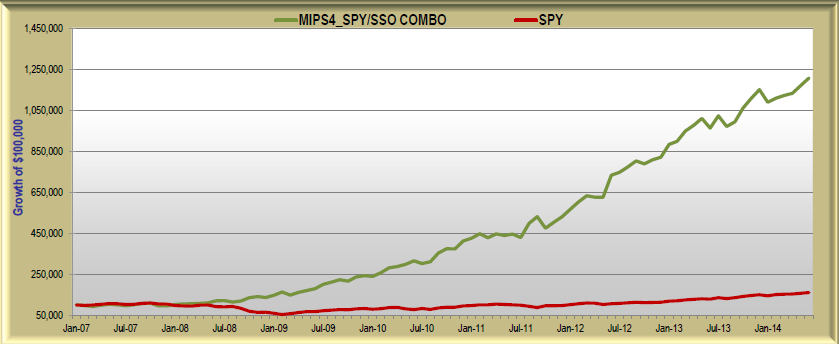
III.) AGGRESSIVE => MIPS4/MF Trading 50% in each of SPY/SH and SSO/SH Lg/Sht from 2007-6/30/2014
CAGR since Jan'07 SPY=+6.6% vs. MIPS=+39.4% Max Drawdown= -12.2%
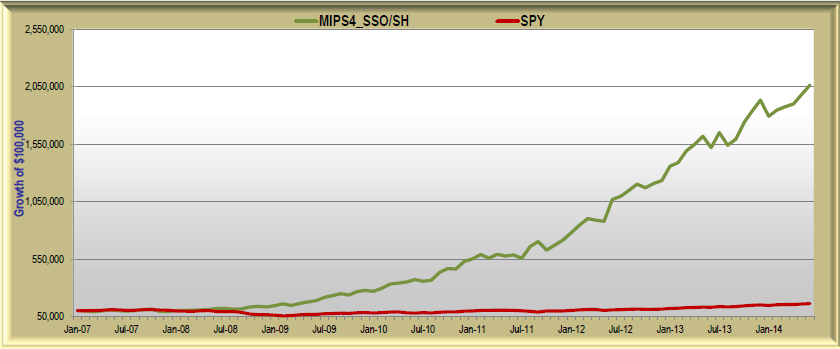
IV.) ULTRA AGGRESSIVE => MIPS4/MF Trading SSO/SH long/short from 2007-6/30/2014
CAGR since Jan'07 SPY=+6.6% vs. MIPS=+49.7% Max Drawdown= -16.1%
Good "mixing" to all !!!


