The S&P500 (SPY) did something this week that it rarely does... it did what I thought it would do. That is, it has gone into the process of re-testing its all-time high that it made on 11/03/2014. This original SPY "break-out" was at 201.9 and the market started a new uptrend rally all the way up to 208.3 on 12/05/2014.
After significant breakouts, the market will usually go back to re-test the breakout point. We believe that this reversal process began on 12/06/2014 and the SPY has headed down over the last few days, closing today at 203.5. Don't worry (yet) folks, this is the "norm", not an exception.
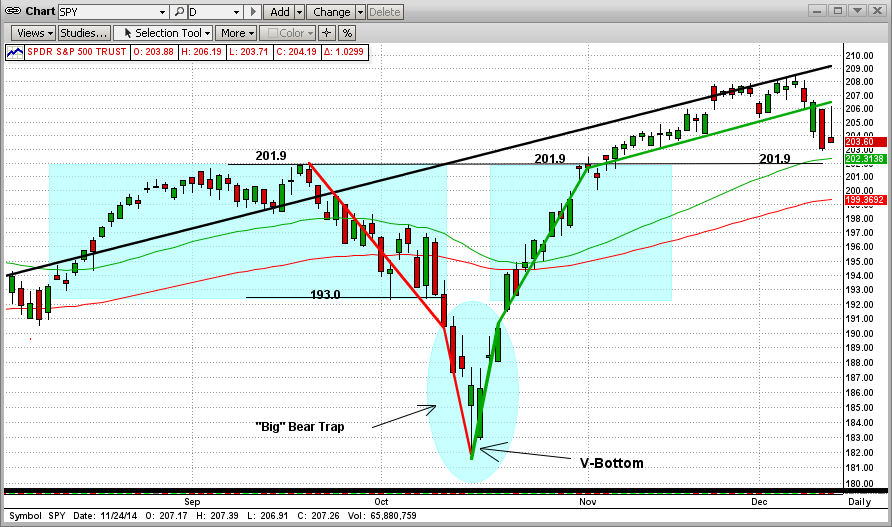
In the graph below, we can see that the "new-high" resistance level at 201.9 is about to coincide with the 50-day EMA (green line). Breaking this level to the downside could spell "double trouble". After that, the next resistance level is the 100-day EMA (red line at 199.3). It would not be good for the SPY to drop below that, but that by itself would not necessarily mean disaster (but it could be the start). Stay tuned!
On the other hand, if the SPY holds above the 201.9 level, we can expect a new uptrend to even higher levels than 208. This is where I would but my bet, if I were betting. But, I'm not betting or sweating; I am depending upon MIPS!!!