We all know that the stock market moves in "cycles", but many people cannot recognize them as such. To many investors, these cycles look like highly-volatile movements, but most really are just normal fluctuations. If you cannot decipher normal cycles as such and no more, you may not sleep well investing in the stock market. I personally learned how to do so over the years and thought that some of my tips may help you.
DAILY VOLATILITY
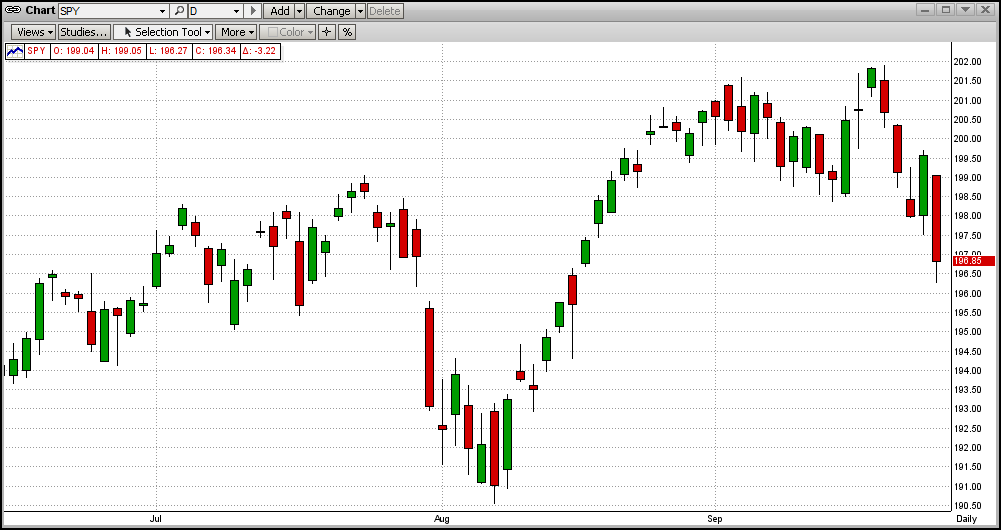
First, let's take a look at the moves in the SPY in the last few months (graph immediately below). The SPY movements in this graph are fairly representative of the last couple of years. Given that these "bars" represent your hard-earned money (retirement stash?), this can be unsettling. But, maybe it should not be. To see this more clearly, you need to step back a bit and look at it from a very different vantage point.
2-YEAR UPTREND
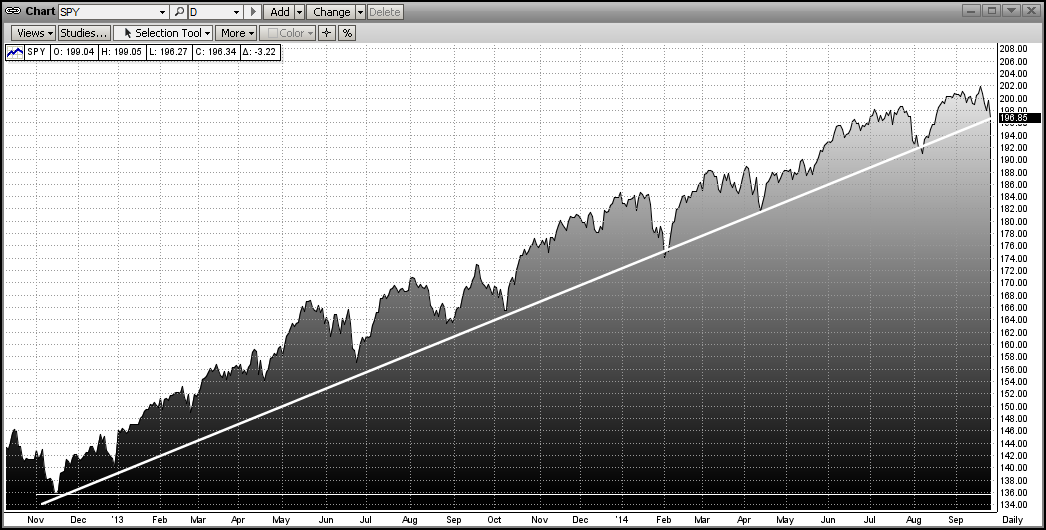
The graph below shows the price of the SPY since mid-Nov 2012 in a very different way (dark part). From this you can see a very definitive uptrend (white line). We all know that uptrends are made of higher-highs and higher-lows. The trendline in an up market is drawn along the bottoms of the higher-lows (just the opposite of being in a downtrend). Following the trend, this graph shows a 47% gain in the SPY (and, of course, in your money). BTW, if you had been trading 1/2 each of SPY/SH and SSO/SH (e.g., 1/2 double leverage on long signals), your gains would have been more like 65-70%.
Now, here is how you can sleep with this volatility: "Always consider the value of your portfolio to be the value on the trendline, no more". That is, do not consider the money above the trendline to be "your money" because the market is going to come back to the trendline over-and-over again until the trend runs its course. [What to do then is another topic in itself, and it entails knowledge and use of the MIPS models.]
MONTHLY GRAPH
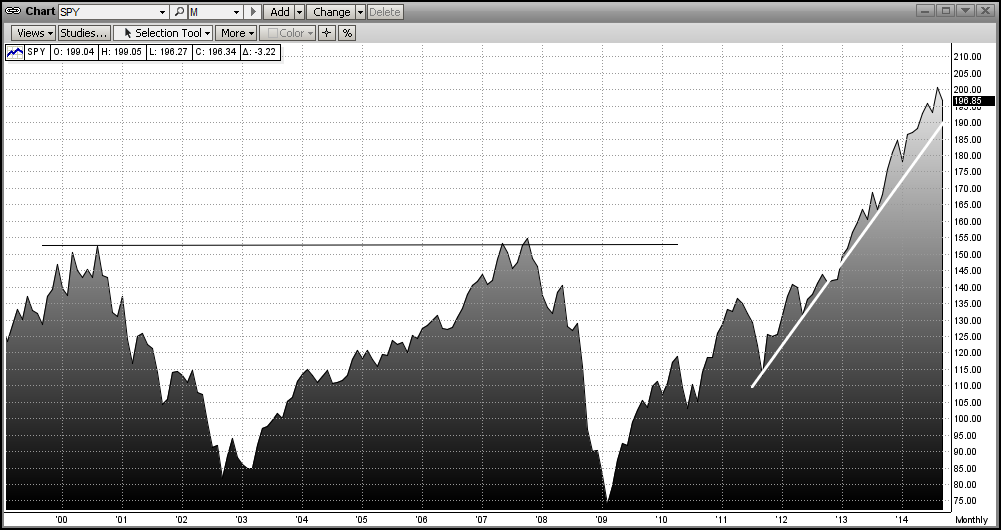
While you are enjoying watching the trend (and MIPS) making you money (or coming to an end), you can also sleep better at night along the way by looking at the same movements of the SPY on a weekly or even monthly basis. See the above trend on a monthly graph below (white trendline). Even if you look very carefully at the monthly graph below, you will NOT even be able to see the market volatility in the first graph above that kept you up at night. So, maybe you have been worrying about nothing !!!
MIPS IN MARKET CRASH OF 2008
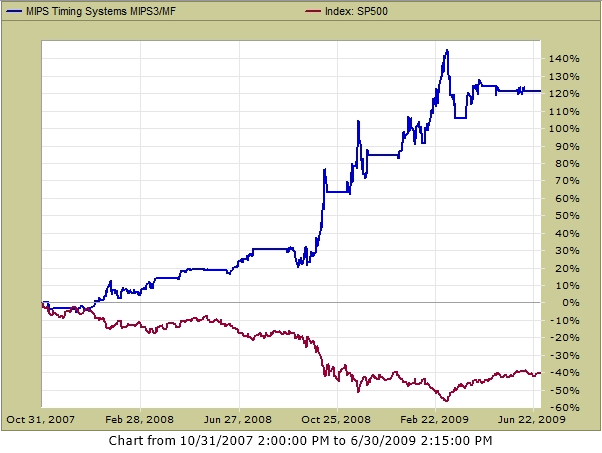
And again, don't be afraid of a market crash. Embrace it. Down markets are where MIPS should really make us big money, as it did in 2008 (see verified graph of MIPS3/MF trading SPY/SH from TimerTrac.com below).