Sunday, November 20 2016
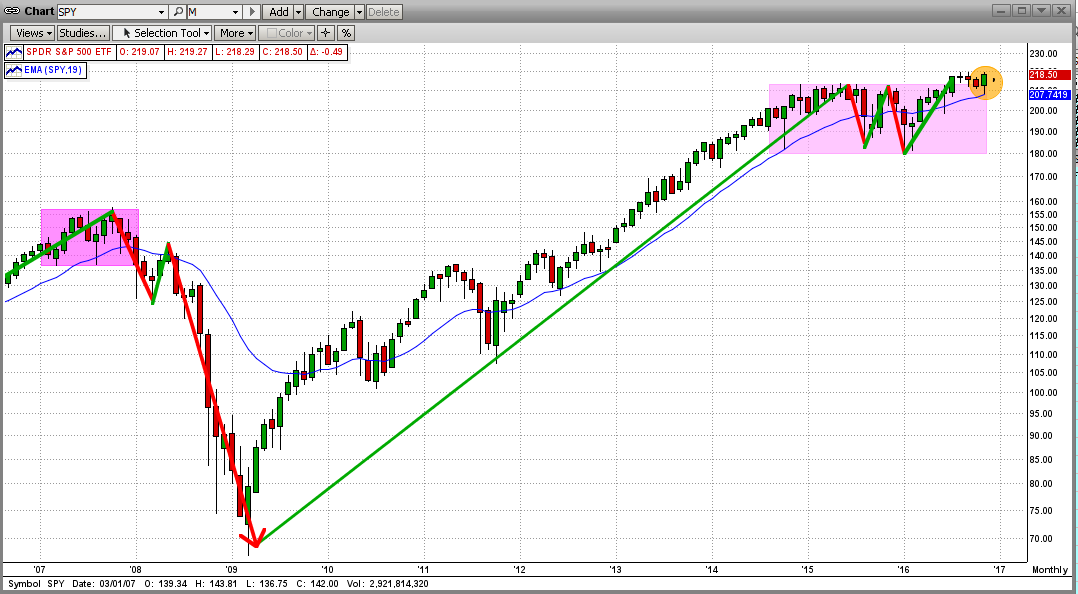
After going sideways for almost two years now, the market could be about to break out to the upside. This is somewhat obvious when we look at the long-term trend in the markets. Keep in mind that the Dow, the NASDAQ, and the Russ2K have already hit new highs. Is the mighty SPY next? Instead of looking at daily graphs now, let's first look at a monthly graph of the SPY (ETF for the S&P500).
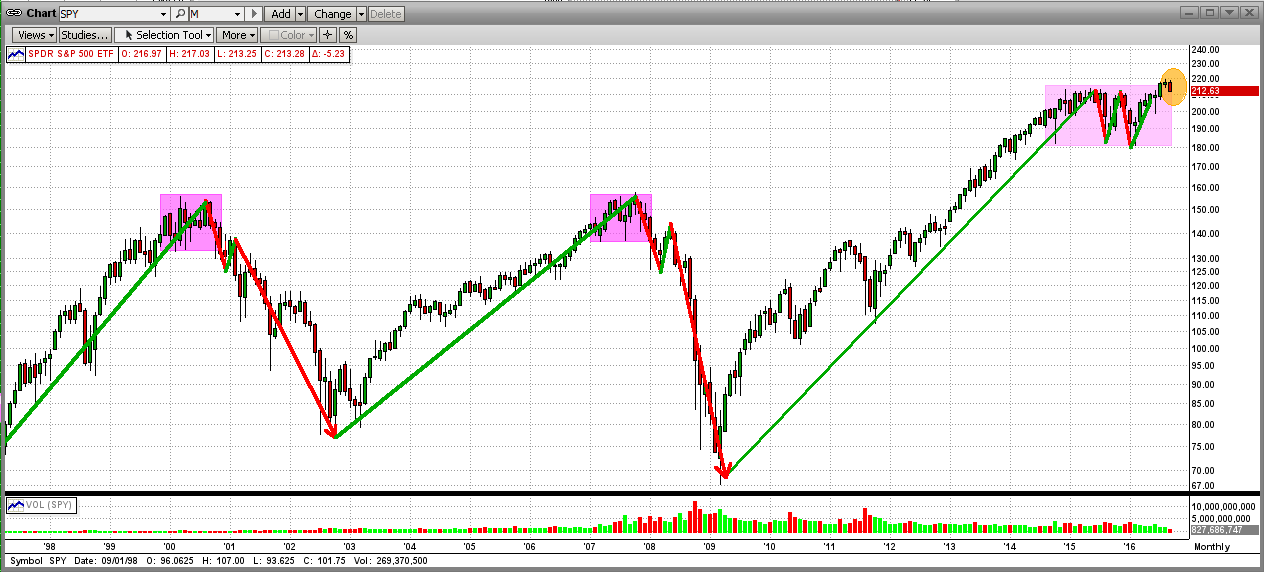
In the graph below, you will see that our long uptrend is still in effect, but the SPY has waffled for 2 years (24 monthly bars up-and-down in a tight range), with a rather weak breakout 4 months ago. Usually when this happens, the SPY is "topping" and a crash is imminent; but not always. For example, if the market gets a catalyst that results in a strong rally at a time like this, the bull market can run higher, at least for a few months. Of course, if whatever caused the catalyst is the "real thing", we could see a strong market for a long time. Read on...
Of course, the "catalyst" this time was the surprising Trump victory in the presidential election ("Trexit"). Because of Trump's bold plans for infrastructure spending, bringing "blue collar" jobs back to the good old USA, etc., the Trump win led big investors to rotate their holdings into industrials (like Caterpillar) and financials (like Goldman Sachs) at the expense of the laggards (like utilities). And, this happened very quickly. So far, the buying has continued.
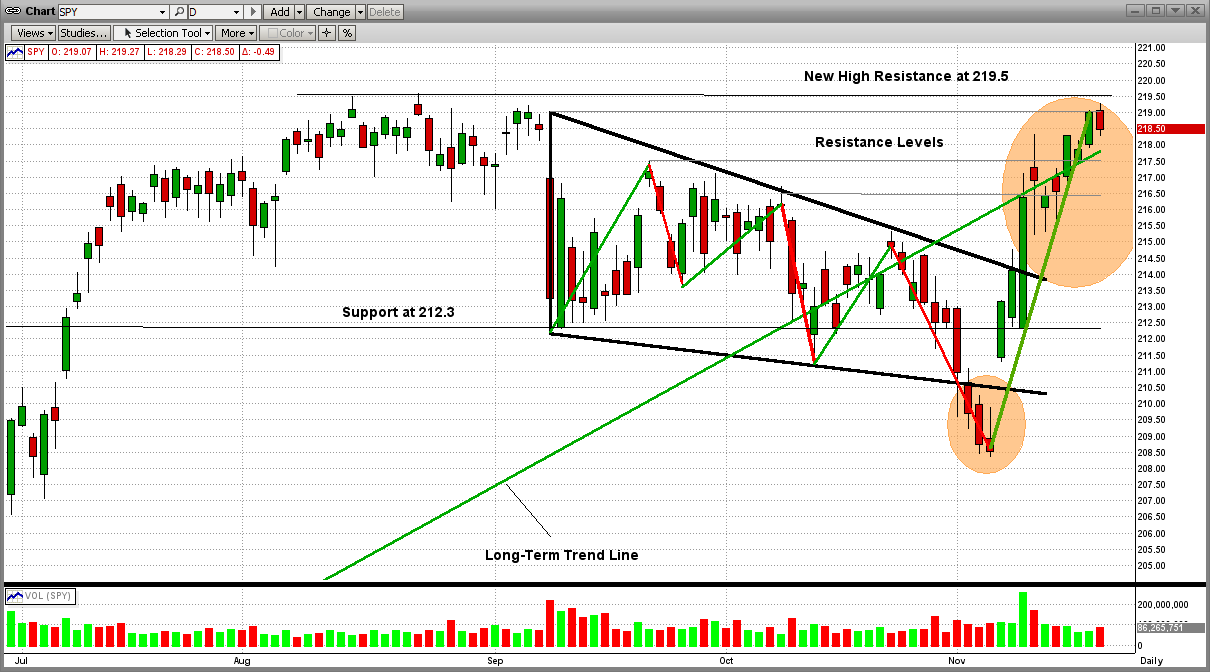
Even with (and maybe because of) the bullish sentiment of, and rally in, the markets in the last few weeks, the market could experience a setback soon. See the next graph below.
The all-time high for the S&P 500 is 2195 (approx 219.5 on the SPY). As you can see, the SPY reached a resistance strong point of 219.0 on Thursday, and got beaten back by the bears lurking there. That was not good, but not overly bearish (yet). Almost surely, the SPY will make another set of "charges" at the strong resistance levels at 219.0-219.5 in the next few days/weeks, and the winner will then be known (bulls or bears).
Keep your eyes fixed on these price levels in the next few days/weeks, while letting MIPS tell you how and when to trade, if at all ... MIPS members can see the current signals for all MIPS models here: http://www.mipstiming.com/current_signals
History has shown that breaking (and staying) in new-high territory is very difficult. On the other hand, if the bulls prevail with a strong break (say on high volume), the sky will be the limit for a while (nice sailing).
Thanks,
Paul Distefano
<<< Contact Info >>>
Paul Distefano, PhD
CEO / Founder
MIPS Timing Systems, LLC
Houston, TX
281-251-MIPS(6477)
Friday, October 28 2016
There was nothing really bullish in the news or in the markets this week except:
1) in total, corporate earnings were better than expected
2) our country's GDP was up, and
3) even after the FBI broke the news today that they will be examining more Hillary emails (and this
turned the markets upside-down), the SPY support gave way as it broke below 2123 but then
it bounced back up above its support to close slightly above 2125 (see graph below).

Stay tuned...
Paul Distefano
-----------------------
Contact Info
Paul Distefano, PhD
CEO / Founder
MIPS Timing Systems. LLC
Houston
281-251-MIPS(6477)
www.mipstiming.com
=============================================================
<<< Previous Blog >>>
MIPS Members:
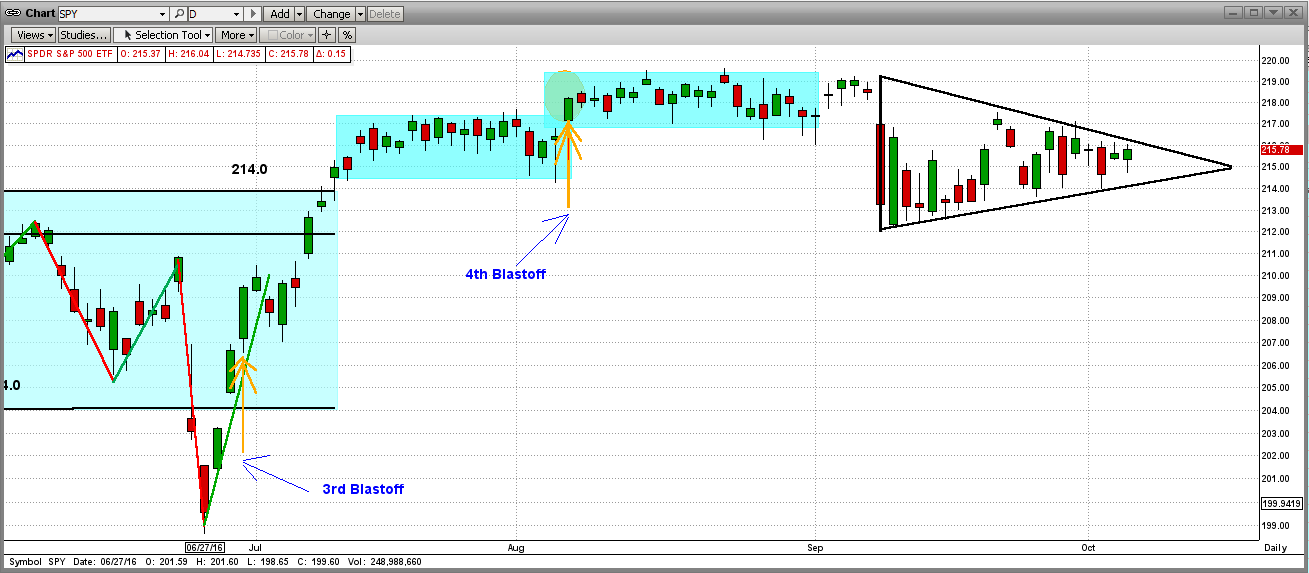
It's times like this when we need a good timing model (like MIPS) to help provide guidance for us in determining the next "big" moves in the market. When I say "big" moves, I mean future 2-6 month's trends, and NOT the 3-8 day "wiggles". Remember, our new Blaster Series algorithms are supposed to keep us away from trading short-term "wiggles".
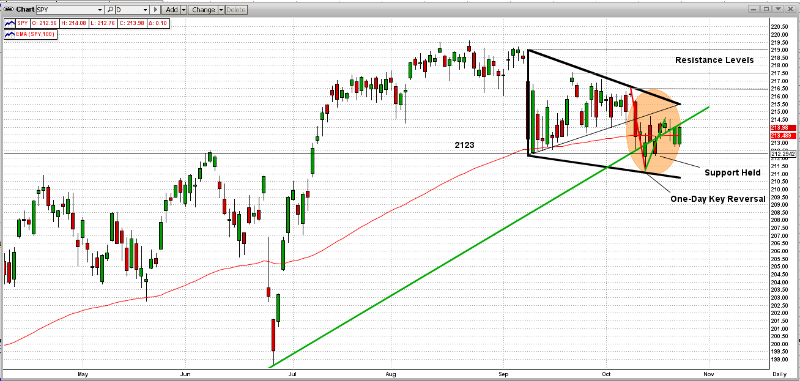
As you can see in the graph below, the market (namely the S&P 500 index, or its ETF the SPY) is basically in a "Standoff", where the market can easily go either way from here.
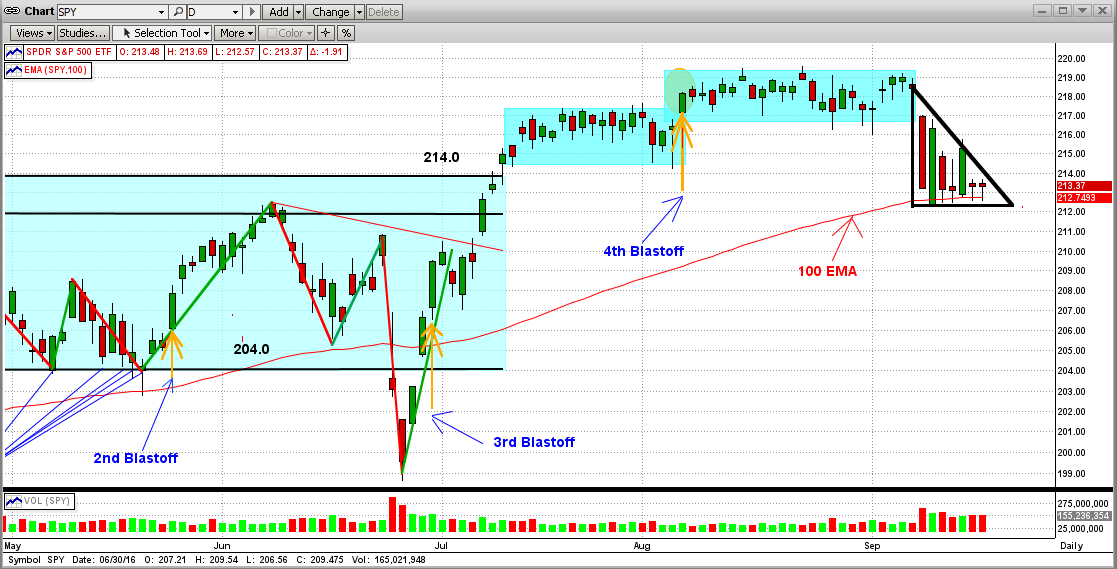
On 10/10/16, the SPY hit the top of the "Triangle" pattern, and was followed by three additional days of drops. Fortunately, on the third trading day (10/13/16), the SPY dropped substantially in early trading and crossed well below its strong support level at 2123 (horizontal black line); but then, the SPY came fighting its way back up (rebounded) and closed way over its support at 2130. This would constitute what is called a "One Day Key Reversal" to the upside, a very bullish move.
After climbing back above the long-term trend line (green line), the market tried but failed to stay well above the LT trend line. Actually, the SPY closed the week basically "ON" the trend line, which is neither bullish or bearish. Or maybe, its just a little bullish since the SPY was facing a sudden downdraft, but somehow managed to "hold the line" right on the LT trend-line (and not below it).
Bearish Bullish
The SPY broke below the triangle pattern The SPY was able to hold above its support of 2123
The SPY gave up its rebound and stopped The SPY closed on or above the LT Trend Line in all of the last 4 days
The SPY was on or above its 100-Day EMA for the last 4 days
Stay tuned...
- All MIPS models are still Long...
Thanks,
Paul Distefano
-----------------------
Contact Info
Paul Distefano, PhD
CEO / Founder
MIPS Timing Systems. LLC
Houston
281-251-MIPS(6477)
www.mipstiming.com
Sunday, October 23 2016
This market remains one that is very difficult to call. There are lots of things going on that influence the direction of the markets; like The Fed, extremely low interest rates, poor corporate earnings, wild Presidential campaigns, weak international economies, etc. It seems like when any one of these "pops" just a little, the market goes crazy. That is why the market is relatively flat, but with high volatility.
From a "technical" standpoint, we have had a really interesting standoff, with the Bulls winning most and the Bears winning a few. However, the Bears have been in charge so far this week, but the Bulls may have pulled off a "turnaround" today. Still too close to call, but let's lay out what we see.
SHORT TERM
From the graph below, we can analyze the pros and cons for each side:
Bears Bulls _ ________ __
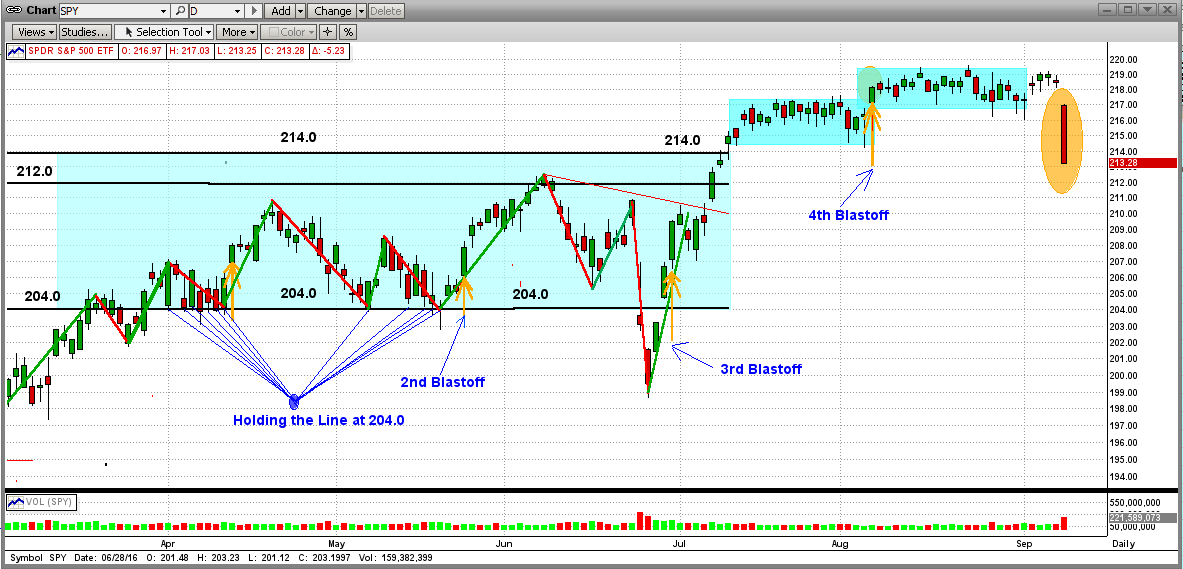
Broke triangle pattern down 3 days ago Today the SPY closed above its support at 212.0
Continued down for the next two days Today's "candle" is in a positive "Hammer" position
The SPY broke it's 100-Day EMA today Today may have been a "One Day Key Reversal"
LONG TERM
From the graph below:
Bears Bulls _ ________ _______
Broke below triangle pattern Market re-bound performed like a "One Day Key Reversal"
Broke just below the Long-Term trend line Rebounded to closed almost on the Long-Term trend line
Broke just below its 200-Day EMA
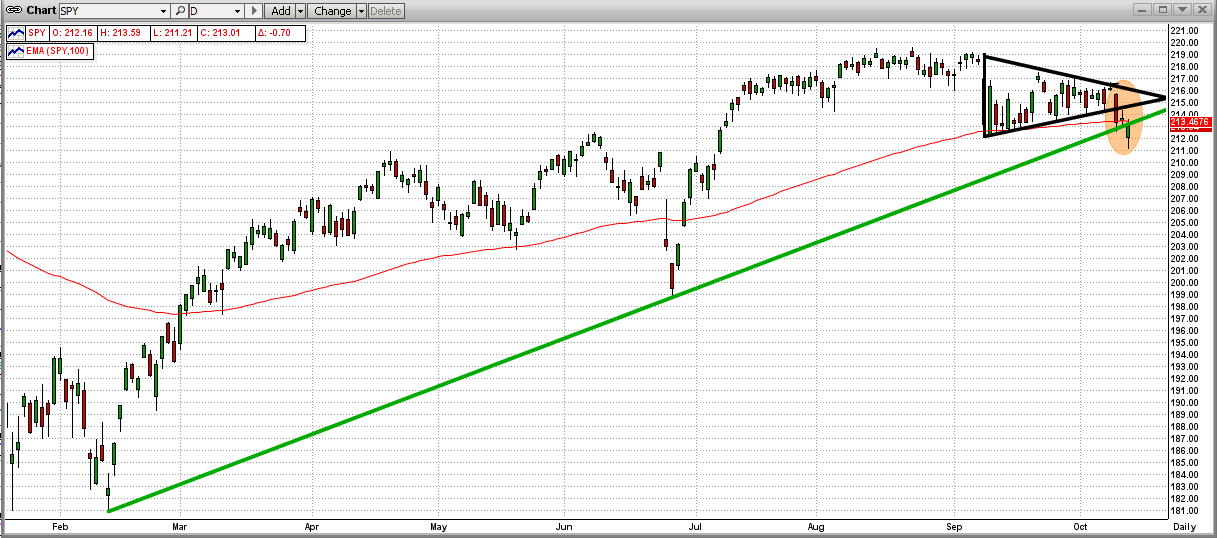
The short-term future of the market is very difficult to call under these conditions. The current MIPS signals are "LONG", so we should hold our long positions for now.
Thanks,
Paul Distefano
----------------------------------
Paul Distefano, PhD
MIPS Timing Systems
Houston, TX
281-251_MIPS(6477)
www.mipstiming.com
Thursday, October 13 2016
This market remains one that is very difficult to call. There are lots of things going on that influence the direction of the markets; like The Fed, extremely low interest rates, poor corporate earnings, wild Presidential campaigns, weak international economies, etc. It seems like when any one of these "pops" just a little, the market goes crazy. That is why the market is relatively flat, but with high volatility.
From a "technical" standpoint, we have had a really interesting standoff, with the Bulls winning most and the Bears winning a few. However, the Bears have been in charge so far this week, but the Bulls may have pulled off a "turnaround" today. Still too close to call, but let's lay out what we see.
SHORT TERM
From the graph below, we can analyze the pros and cons for each side:
Bears Bulls _ ________ __
Broke triangle pattern down 3 days ago Today the SPY closed above its support at 212.0
Continued down for the next two days Today's "candle" is in a positive "Hammer" position
The SPY broke it's 100-Day EMA today Today may have been a "One Day Key Reversal"
LONG TERM
From the graph below:
Bears Bulls _ ________ _______
Broke below triangle pattern Market re-bound performed like a "One Day Key Reversal"
Broke just below the Long-Term trend line Rebounded to closed almost on the Long-Term trend line
Broke just below its 200-Day EMA
The short-term future of the market is very difficult to call under these conditions. The current MIPS signals are "LONG", so we should hold our long positions for now.
Thanks
Paul Distefano
----------------------------------
Paul Distefano, PhD
MIPS Timing Systems
Houston, TX
281-251_MIPS(6477)
www.mipstiming.com
Friday, October 07 2016
Over long periods of time, investors disagree with each other’s views of “what” will happen to the market and what the catalyst will be that causes the “what” to happen. Some of the downside catalysts have been weak economics, poor profits, global unrest, etc.
Now, most all of us agree that the ultimate “catalyst” has been, and for the next 3-6 months will continue to be, Freddy Yellen and her near zero interest rates. No doubt that the Fed’s QE and its interest rate policy is what has kept the market from dropping or even falling apart. Money coming into the markets at a very high rate (as in the last 2 years) moves markets up; and extremely low interest rates is one of the strongest forces of money movement into the markets (round robin).
Freddy Yellen is running out of excuses, but will not raise rates until December of this (election) year. Of course, the fact that this is after the presidential election is just a coincidence, because we all know that the Fed does not let politics affect its decisions. If you believe that, call me about the ocean view property that I have for sale in Arizona.
Because of the above, the market has been moving sideways for almost two years, one of the longest periods in U.S. market history. Multiple trillions have traded hands and the market has been flat for almost two years (see the graph below – weekly bars). You will notice that the “break-out” (if you want to call it that) over the last few weeks was weak and seems to be fading out.
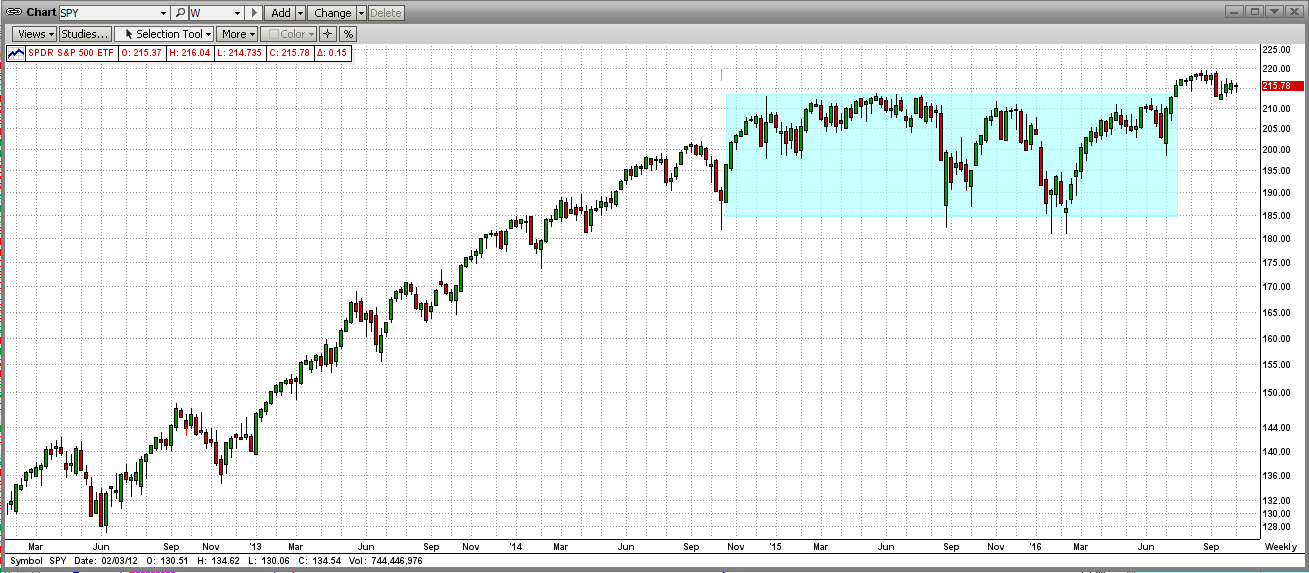
In the past, markets that have been flat at their recent highs for 1-2 years have been in a “topping” pattern, that is, forming a top. The “toppings” in 1999 and 2007 lasted 10-12 months and the topping in 2015-16 has been forming for almost 20 months (see graph below, with monthly bars). Does this mean that the market is ready for the “big drop”? Maybe, but maybe not… read on…
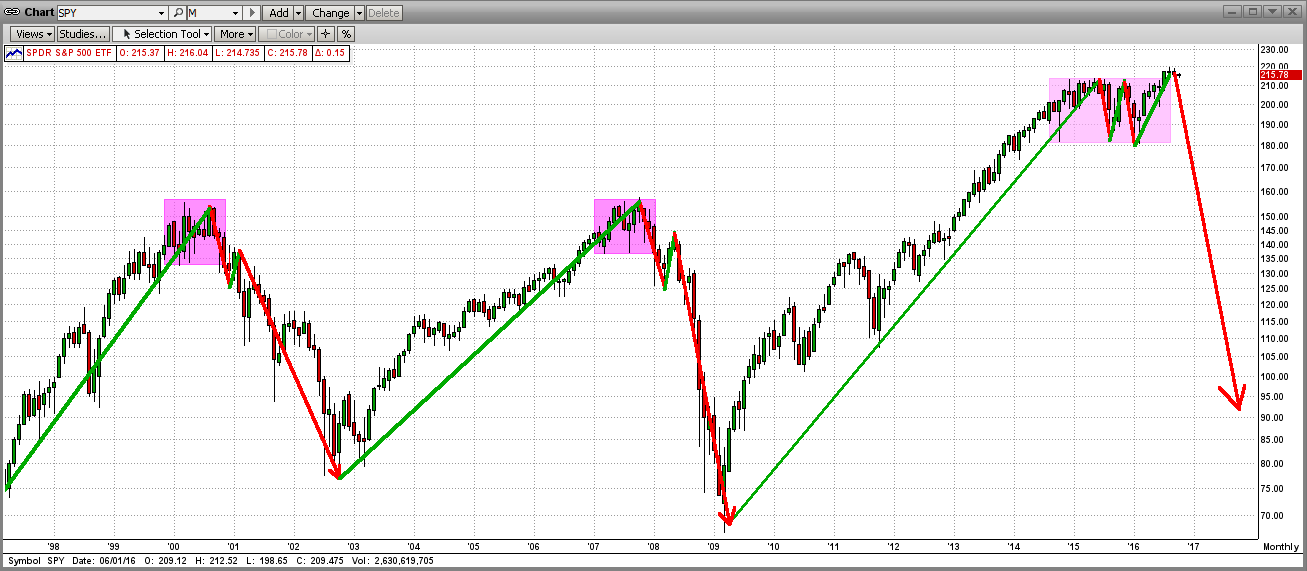
The last stand in the topping process may be happening now. See the “triangle pattern” in the graph below (daily bars). Even though it appears or feels that the market is ready for a dive, any good news for the Fed (like some bad economic or jobs data), could get this market back into the upside breakout mode.
For the last few weeks we have been in this trading triangle, and now this one is coming to an end. In the majority of times, a big market move happens in same the direction as that of the breakout from the triangle pattern itself. Time will tell, and we believe that that time is now upon us. Stay alert…
At the very beginning of this year, we released new versions of our MIPS models (Blaster series) that contain new algorithms that greatly reduce the probability of the models getting whipsawed in flat markets. Instead of trying (and failing) to find new trends in flat “trendless” markets, the models will stop trading in flat markets, and either keep the same signal or go to cash until the market starts moving in a definitive direction again.
This was a major project (9 months) that will undoubtedly provide much better results for the users of our models. The performances of the MIPS models YTD are approximate in sync with the performance of the SPY.
Sunday, September 25 2016
On Wednesday of last week, the Fed's "No Hike" decision overshadowed lots of bad economic and worldwide news, and sent the market up against all odds (see orange "ellipse"). WHAT A SURPRISE !!!
Independent of what fundamental economics indicates or what traditional technical analysis predicts, nothing compares to Ms. Yellen's "Fed Power" to move the market.
Now, let's see how this "break-out" goes from here. Based on all of the negative news that we all know, the market should not go up; but based on extremely low interest rates and lots of free money, it definitely could make new highs from here.
Let's wait for MIPS to tell us what to do ... Stay tuned !!!
Sunday, September 18 2016
The S&P 500 (and its Index ETF, the SPY) have recently formed a very bearish trading pattern, the so-called " Descending Triangle" (sometimes referred to as a "Descending Pennant"). Many times, the market drops through the bottom of this pattern, and heads down from there. See the graph immediately below.
But these are not normal times, like when the market reacts to good news with gains and to bad news with losses. This is a market dominated by a small, but powerful, agency called the Federal Reserve. Of course, most of you know that; and are just as sick and tired of the Fed Chairperson, Janet Yellen, as I am and millions of other investors are. She has lost respect from just about everyone that invests in stocks and bonds, except from the fat kats that benefit greatly from extremely low interest rates. They make $ billions on the money that we (the American people) lend them at ridiculously low rates.
--------------------------------------------------------------------------------------------------------------------------------
For what I think is a good analysis of today's short-term market, read the blog below.
Borrowed from Jack Steiman www.SwingTradeOnline.com
Friday September 16th 2016
The week was wild, but quiet when all was said and done. Last Friday (9/09/16) saw a strong move lower with no follow-through to the down side this week by the bears. Nothing unusual about that. The bears haven't followed through meaningfully in longer than I can remember. That said, this week saw the market move mostly lateral, meaning the bulls didn't just blast things right back up as they usually do with no resistance from the bears. The bears are fighting a little bit. More than we've seen in recent months. The volatility is higher, due to the behavior in the VIX from last week’s down side action. It's not as boring now as it was months prior. At least we're not trading day after day in a very tiny range of one percent or less. Two months of that was enough thankfully. I think folks like the volatility but let's be honest, going nowhere doesn't make trading much easier. One could say a bear flag is forming short-term, but that's irrelevant for one major reason. Fed Yellen.
Here she comes again with yet another “no-rate-hike” statement for our listening pleasure come next Wednesday. The action all of this week was due mostly to the market waiting to hear what fed Yellen will do to the fed market. Nothing matters any longer. Only the fed matters, and that's really sad-but-true statement about our current market. The market is sitting mostly flat as it awaits the good tidings from the mouth of our market leader. Nothing much will happen until she talks, and lets us all know what the future holds in terms of rates. The market on-hold is so boring, but so common now. So, yes, it's all about next Wednesday, so place your Russian roulette bets.
I think I know what Fed Yellen will say Wednesday. I think the market knows what she will say on Wednesday. The market is not expecting a rate hike. It's not going to happen for three simple reasons. ISM Manufacturing Report, ISM Services, and Retail Sales. All three reports were a disaster. Big misses the last week plus, and those misses were all on the most important aspects of our current economy. Everything is slowing, and doing so quite dramatically. We all know how she hates to raise rates when things are going well, so the odds of her raising rates, in my opinion, are zero. I could always be wrong, but that's my thinking.
In Yellen’s mind, a declining economy must be in concert with near zero interest rates. My guess is, she will also mention, once again, about how she will be watching future data on the economy, meaning she's not raising rates this year in all likelihood. She will need to see many consecutive months of improvement in all the key areas, and right now we're going the wrong way. The real question is what the market will do when she says no rate hike and talks about being data dependent. Will the market finally say it doesn't care and start moving towards truth, or will it stay in Disneyland? We'll find out soon enough. History says the market will blast up on the news. I'm not so sure this time, but we'll know on Wednesday.
You really have to wonder how a market can hang in there with news on the economy being so bad. I think the real concern in many ways is away from the economy. The real world says folks are struggling and doing so in a big way. Manufacturing is in a technical recession, based on it being below 50.0. A 49-reading a week is back. Services, which is most of our economy these days, went from 58 down to 51. A scary drop in such a small amount of time. Retail sales went away. The precipitous drop out of the blue has to be very concerning for our economy without any concerns for our few market. What is really going on? Rates have been low forever. There have been endless QE programs. Part of Europe, and all of Japan, is dealing with negative rates, yet nothing is coming alive economically on global level. Nothing seems to be working, so you have to wonder what the fed is thinking. None of her tricks are working. Central bankers around the world just can't get anything to work.
The real concern is to take care of the public, and that seems to be something that's not happening and many are suffering. I have no answers nor does the fed, it seems. That said, we'll see what Wednesday brings and how the market reacts.
Keeping it light here.
Peace,
Jack
Saturday, September 10 2016
Friday was a terrible day for investors worldwide. And yes, it was the Fed again. How the Fed's actions can overshadow market fundamentals (low earnings, over-valued stock prices, faltering economies throughout the world, etc.) is beyond belief. But then again, an extremely low, or negative, interest rate policy is a major incentive.
Friday's drop seems to many as a disaster [see the graph for the S&P 500 ETF (SPY) below]. And, from the big drop in this daily graph (orange ellipse), it sure seems that way. Seems as though the world is coming to an end. When just a suggestion from one Fed official (not even Yellen) can move the market to that extent, this means to me that large investors and traders are sitting with their fingers on the sell button. Remember, these guys can push a market way down and then way back up like nothing happened.
So, just how bad was Friday's drop and how likely is it to continue? For a clue, examine the monthly graph immediately below. Look at (or even look "for") Friday's disaster. What looked like a disaster on the daily graph looks like a "blip" on the monthly graph (orange ellipse). This kind of "puts things in perspective". The point is that, even though Friday was a very bad day, there is no strong indication that the drop will continue (even though the up-trend has been damaged). And, our MIPS models DID NOT ascertain a trend change from Friday's action.
Things can change on a dime, so
Stay Tuned...
|
Monday, August 01 2016
There is a lot of excitement in the stock market because of recent new highs, the Fed's soft approach to interest rate hikes, European and Japanese new financial incentives, etc. Are we "jumping the gun"?
DAILY VIEW
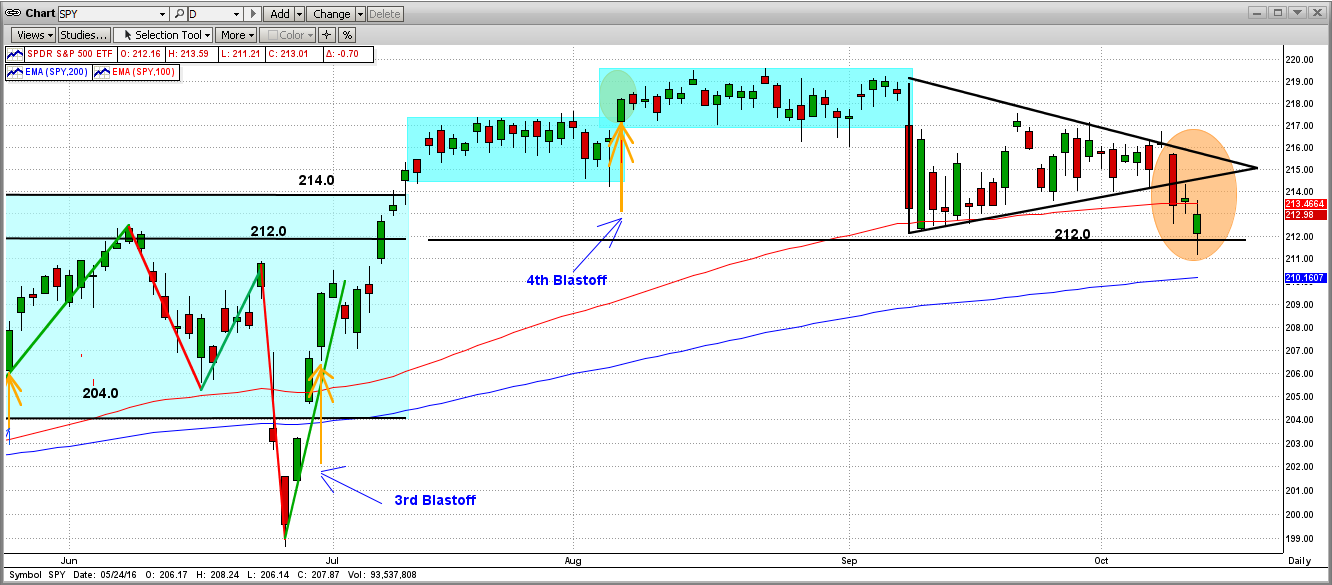
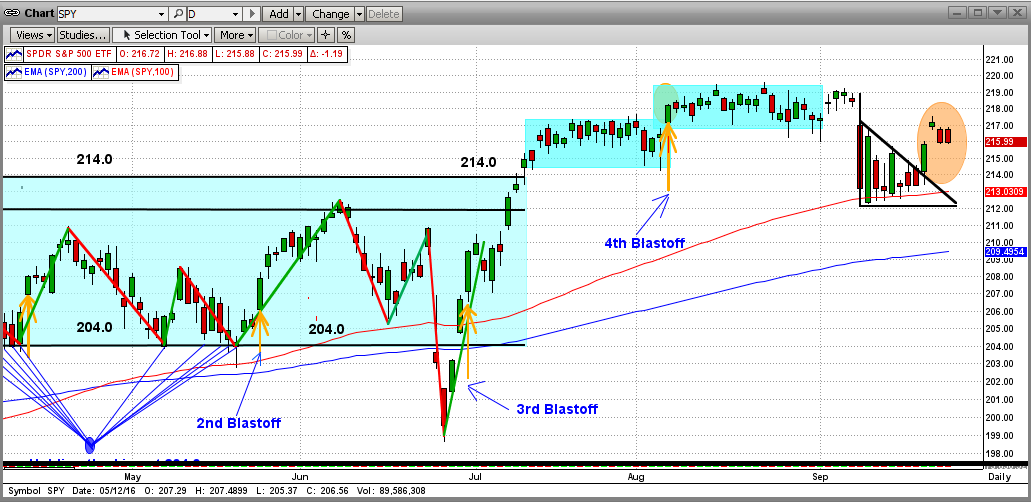
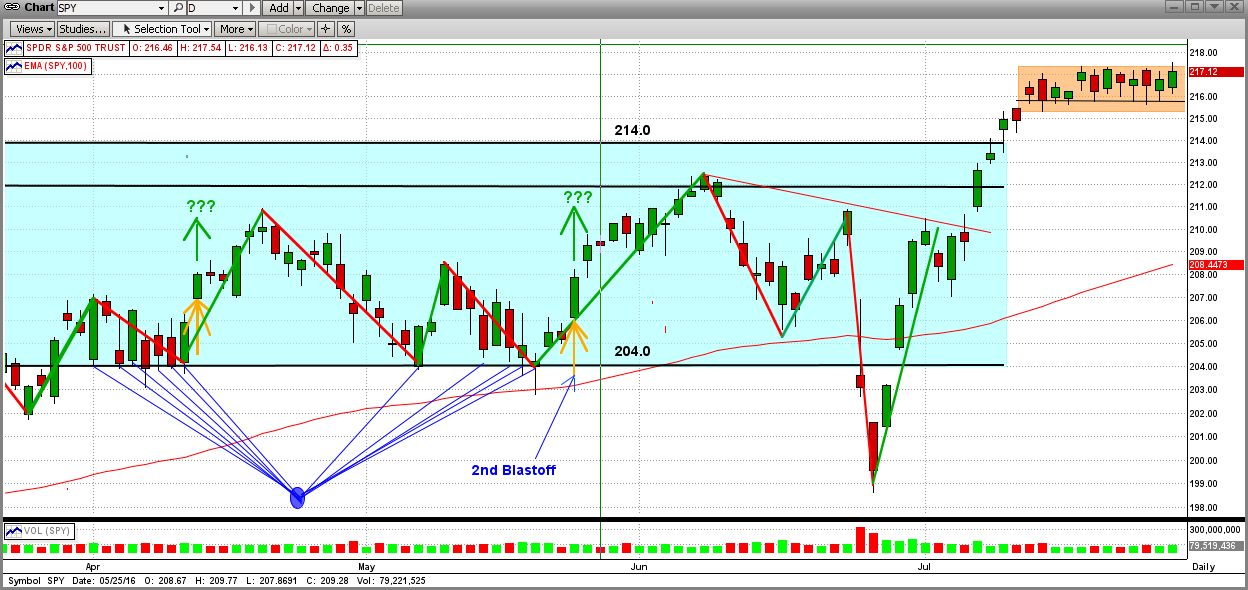
In the graph below you can see that the downside support of the SPY at 204.0 was rock solid and it "fended off" ten attempts from the Bears to drive the market lower. But, after a short bounce up, the market got hit big by the "Brexit" vote in the UK on 6/24/2016, and that drove the SPY down about 6% in just two days!
After a short V-Bottom, the SPY rocketed back up, and on 7/12/2016 it passed its all-time high of 213.5 (2135 on the S&P 500). Usually this would mean strong sailing ahead, at least for a few months. But no... without much time for celebration (two trading days later), the SPY went back into one of its beloved "extremely-tight, sideways trading patterns" at less than 2% above its previous all-time high. This is not good, but most probably temporary.
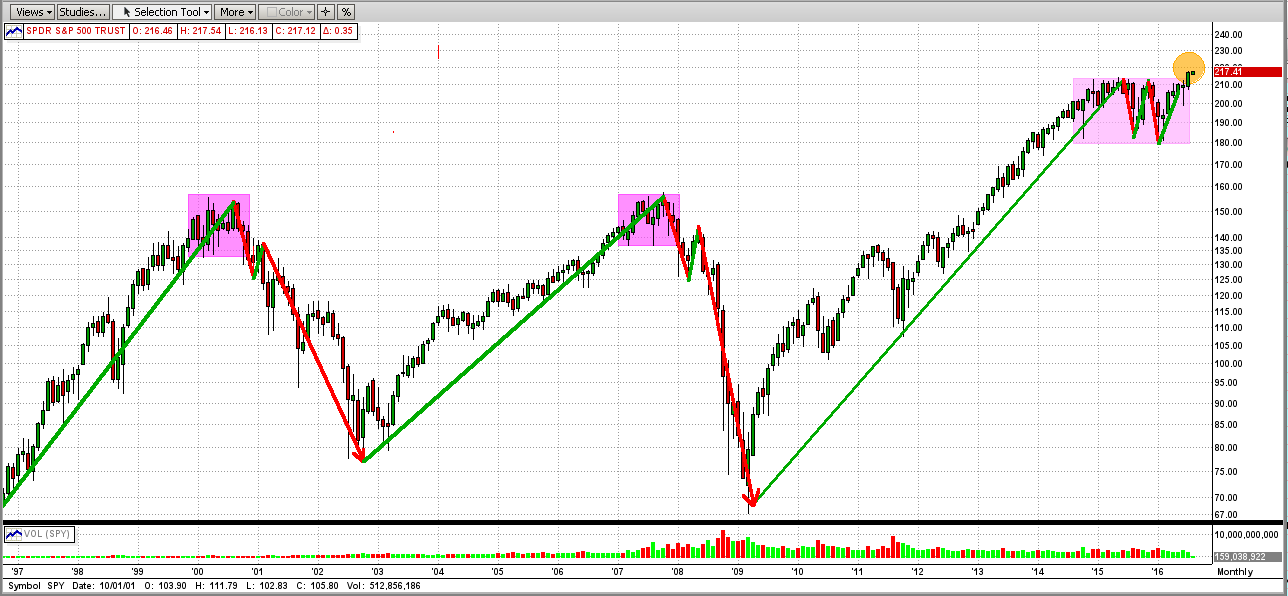
Monthly VIEW
Another way to look at this is from a distance. See the monthly chart below. There has been a lot of hoopla about the new all-time highs in the market in the last two weeks, but from another view we can see that it is way too early to celebrate. From a monthly viewpoint, the "new highs" (orange circle on the top right) are barely noticeable. Of course, a new bull run has to begin somewhere, but let's not throw caution to the wind just yet.
In spite on my "caution" tone above, the MIPS models are all Long, but let's proceed with care. The market looks like it is headed up from here, but let's follow what MIPS tells us what to do.
Stay tuned ...
Monday, July 11 2016
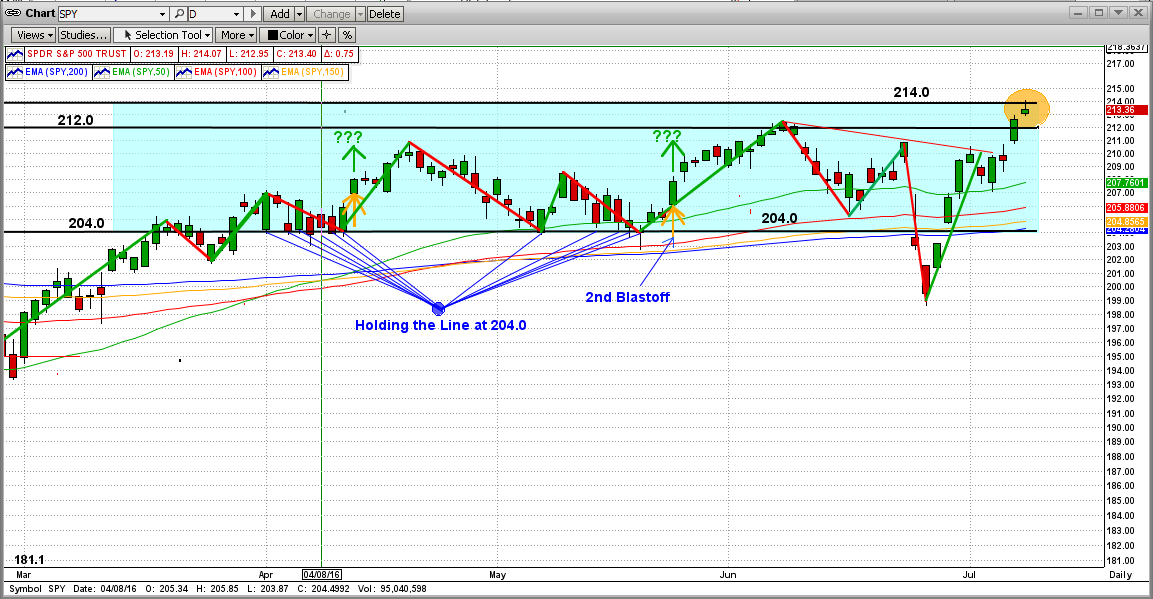
The market (S&P 500 and SPY) has been moving up nicely for the last two weeks. The objectives are, of course, for the market: (a) to move out of its exhausting 15-month sideways trading pattern, (b) to break above its all-time highs, and (c) to follow with a strong upward move. The all-time "closing high" for the S&P 500 is 2135 (approx, 213.5 for the SPY), and its all-time "intraday high" is 2140 (approx. 214.0 for the SPY). The SPY has come close to or hit 214.0 about 10 times in the last 15 months, and has failed to break above it each and every time (fierce Bear counter attacks).
Today's market action did nothing to make investors feel confident that this is the time that the SPY will see both closing and intraday highs. The SPY did hit and trade slightly above 214.0 intraday today; but when it penetrated the Bears "front line" at 214.0, the Bulls got forced back to close below both the SPY's closing and intraday highs (orange circle in the graph below). Also, the SPY is still in the notorious 15-month sideways trading pattern.
The Bears "held the line" today. Not a good sign, but this is almost certainly NOT the Bulls' last try at breaking above the all-time highs and heading for the sky. If the Bulls do succeed, it will not be without a fight from the Bears. No definitive winner yet !!!
This is not a time to be too aggressive, because the near-term outcome is not easily predictable.
Sit tight and wait for MIPS to tell you what to do...
|


