There was nothing really bullish in the news or in the markets this week except:
1) in total, corporate earnings were better than expected
2) our country's GDP was up, and
3) even after the FBI broke the news today that they will be examining more Hillary emails (and this
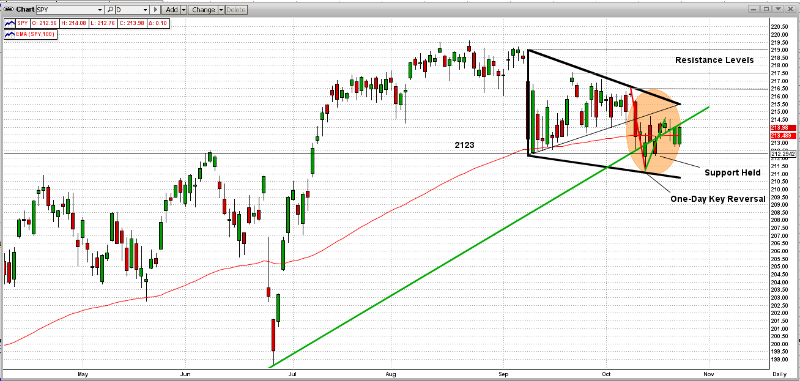
turned the markets upside-down), the SPY support gave way as it broke below 2123 but then
it bounced back up above its support to close slightly above 2125 (see graph below).

Stay tuned...
Paul Distefano
-----------------------
Contact Info
Paul Distefano, PhD
CEO / Founder
MIPS Timing Systems. LLC
Houston
281-251-MIPS(6477)
www.mipstiming.com
=============================================================
<<< Previous Blog >>>
MIPS Members:
It's times like this when we need a good timing model (like MIPS) to help provide guidance for us in determining the next "big" moves in the market. When I say "big" moves, I mean future 2-6 month's trends, and NOT the 3-8 day "wiggles". Remember, our new Blaster Series algorithms are supposed to keep us away from trading short-term "wiggles".
As you can see in the graph below, the market (namely the S&P 500 index, or its ETF the SPY) is basically in a "Standoff", where the market can easily go either way from here.
On 10/10/16, the SPY hit the top of the "Triangle" pattern, and was followed by three additional days of drops. Fortunately, on the third trading day (10/13/16), the SPY dropped substantially in early trading and crossed well below its strong support level at 2123 (horizontal black line); but then, the SPY came fighting its way back up (rebounded) and closed way over its support at 2130. This would constitute what is called a "One Day Key Reversal" to the upside, a very bullish move.
After climbing back above the long-term trend line (green line), the market tried but failed to stay well above the LT trend line. Actually, the SPY closed the week basically "ON" the trend line, which is neither bullish or bearish. Or maybe, its just a little bullish since the SPY was facing a sudden downdraft, but somehow managed to "hold the line" right on the LT trend-line (and not below it).
Bearish Bullish
The SPY broke below the triangle pattern The SPY was able to hold above its support of 2123
The SPY gave up its rebound and stopped The SPY closed on or above the LT Trend Line in all of the last 4 days
The SPY was on or above its 100-Day EMA for the last 4 days
Stay tuned...
- All MIPS models are still Long...
Thanks,
Paul Distefano
-----------------------
Contact Info
Paul Distefano, PhD
CEO / Founder
MIPS Timing Systems. LLC
Houston
281-251-MIPS(6477)
www.mipstiming.com


