There is a lot of excitement in the stock market because of recent new highs, the Fed's soft approach to interest rate hikes, European and Japanese new financial incentives, etc. Are we "jumping the gun"?
DAILY VIEW
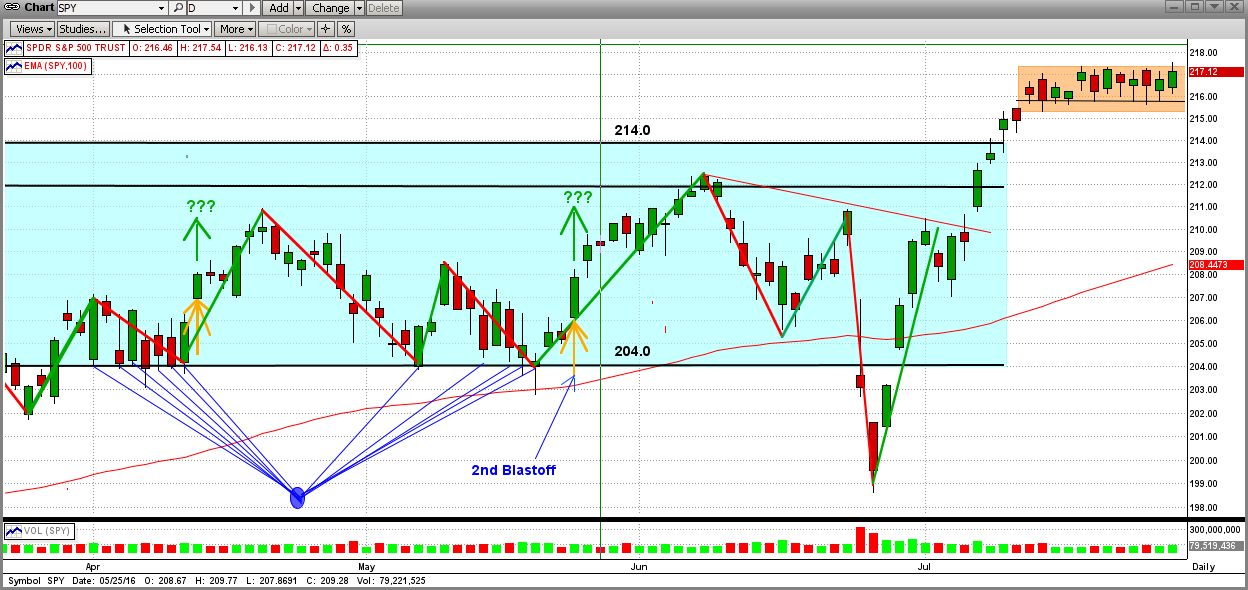
In the graph below you can see that the downside support of the SPY at 204.0 was rock solid and it "fended off" ten attempts from the Bears to drive the market lower. But, after a short bounce up, the market got hit big by the "Brexit" vote in the UK on 6/24/2016, and that drove the SPY down about 6% in just two days!
After a short V-Bottom, the SPY rocketed back up, and on 7/12/2016 it passed its all-time high of 213.5 (2135 on the S&P 500). Usually this would mean strong sailing ahead, at least for a few months. But no... without much time for celebration (two trading days later), the SPY went back into one of its beloved "extremely-tight, sideways trading patterns" at less than 2% above its previous all-time high. This is not good, but most probably temporary.

Monthly VIEW
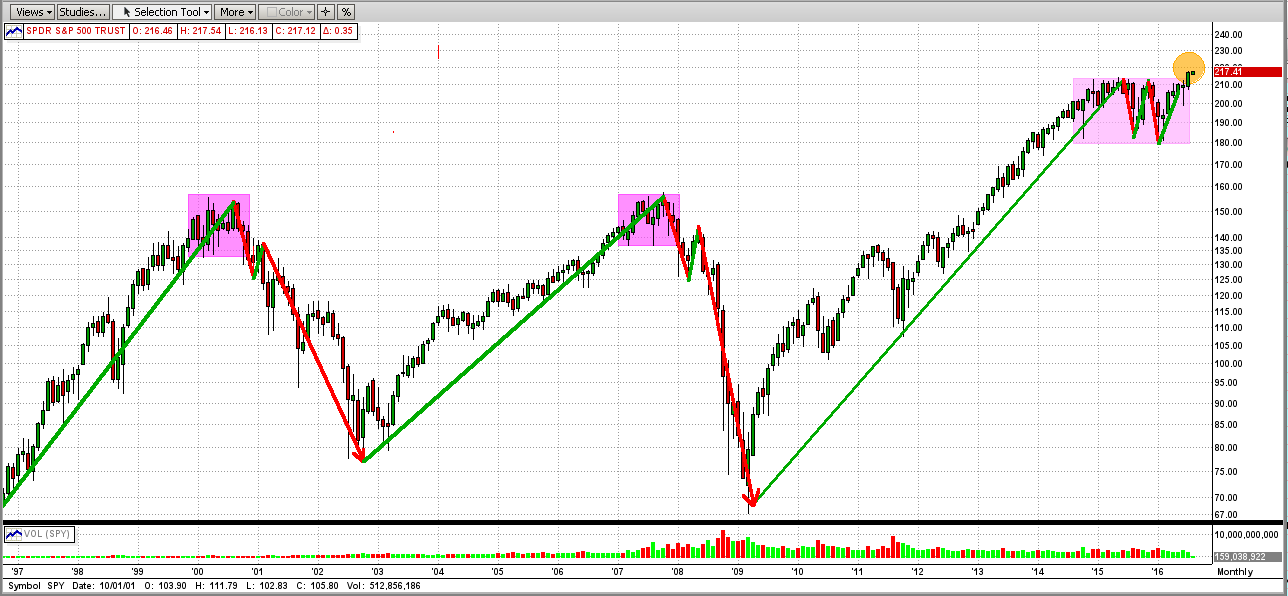
Another way to look at this is from a distance. See the monthly chart below. There has been a lot of hoopla about the new all-time highs in the market in the last two weeks, but from another view we can see that it is way too early to celebrate. From a monthly viewpoint, the "new highs" (orange circle on the top right) are barely noticeable. Of course, a new bull run has to begin somewhere, but let's not throw caution to the wind just yet.

In spite on my "caution" tone above, the MIPS models are all Long, but let's proceed with care. The market looks like it is headed up from here, but let's follow what MIPS tells us what to do.
Stay tuned ...