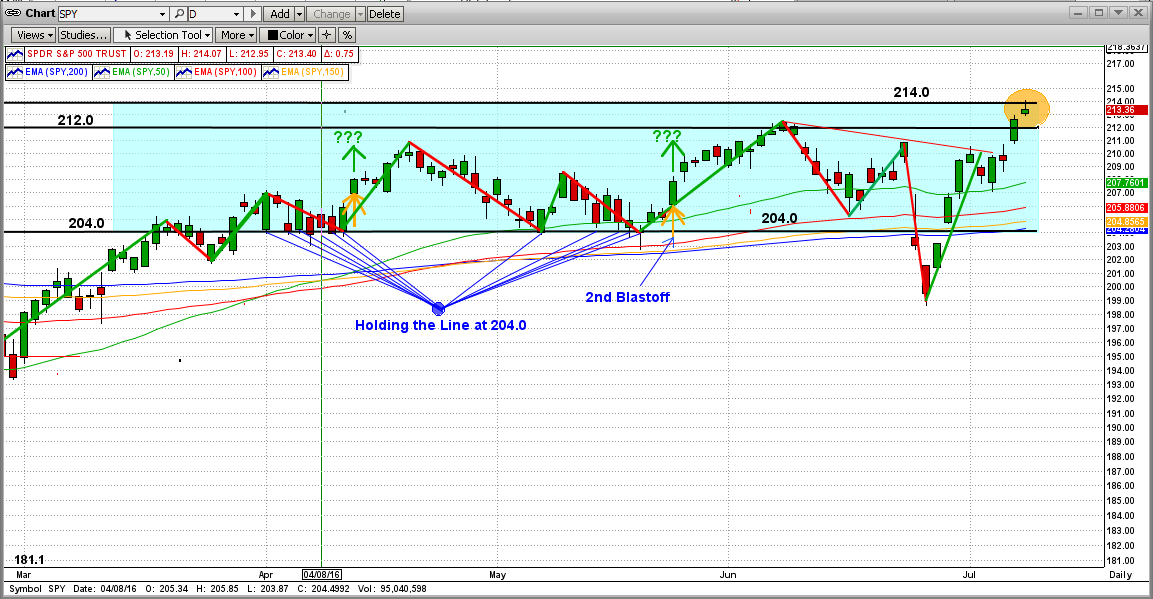
The market (S&P 500 and SPY) has been moving up nicely for the last two weeks. The objectives are, of course, for the market: (a) to move out of its exhausting 15-month sideways trading pattern, (b) to break above its all-time highs, and (c) to follow with a strong upward move. The all-time "closing high" for the S&P 500 is 2135 (approx, 213.5 for the SPY), and its all-time "intraday high" is 2140 (approx. 214.0 for the SPY). The SPY has come close to or hit 214.0 about 10 times in the last 15 months, and has failed to break above it each and every time (fierce Bear counter attacks).
Today's market action did nothing to make investors feel confident that this is the time that the SPY will see both closing and intraday highs. The SPY did hit and trade slightly above 214.0 intraday today; but when it penetrated the Bears "front line" at 214.0, the Bulls got forced back to close below both the SPY's closing and intraday highs (orange circle in the graph below). Also, the SPY is still in the notorious 15-month sideways trading pattern.
The Bears "held the line" today. Not a good sign, but this is almost certainly NOT the Bulls' last try at breaking above the all-time highs and heading for the sky. If the Bulls do succeed, it will not be without a fight from the Bears. No definitive winner yet !!!
This is not a time to be too aggressive, because the near-term outcome is not easily predictable.
Sit tight and wait for MIPS to tell you what to do...