It would be foolish for us to say anything other than "our MIPS models have not performed well in 2015" !
- but, we have gone through these types of markets before (like 2011) and have experienced really good gains
from the MIPS models before and after those times.
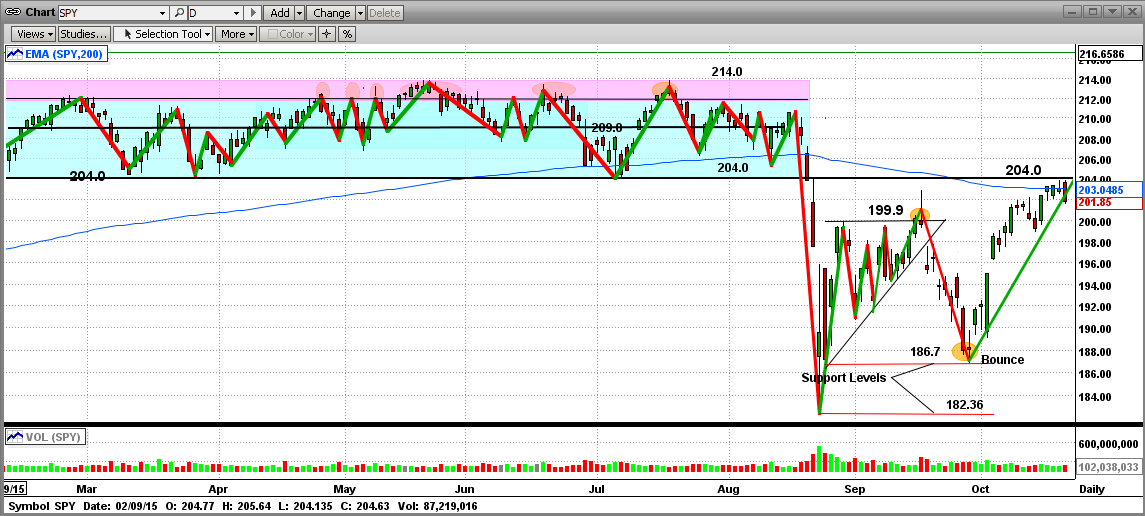
In 2015, one of our worst nightmares came to light, and that is an extended, flat market that changed direction
every few days. Trend following models can "break down" in these types of markets. We experienced a similar
market in 2011, so we developed and built into the MIPS models several new algorithms that would "take the place" of trend following algorithms in these types of markets, and we really thought that we had solved the "entire" flat-market problem.
Then, along came 2015, where the Indices (Dow, SP500, etc.) set records for:
(a) the duration of a tight, flat trading range,
(b) the number of directional changes in 8 months of any year in the Dow's history,
(c) the market changing direction over-and-over in very few days (like 3-6 days) for months on end, and
(d) one of the largest one-day drops for the Dow in the last 50 years.
Needless to say, our "flat market" algorithms from 2011 were not enough to prevent getting whipsawed in 2015.
So, we have recently gone back to the drawing board and developed new proprietary algorithms that:
(a) track and calculate the "frequency" of the directional changes, and
(b) when the directional change frequency is only a few days several times back-to-back, the models will
"shut down" (go to cash) until the volatility dies down.
We have started using a preliminary version of the final release at these new algorithms at this time.

OUR PERFORMANCE BETWEEN 2008-2015
The goals that most intermediate-term model developers follow are to:
1) Do as well or better than the Index they are following (in our case the S&P500) in up markets and beat the market soundly in down markets. Of course, in up markets, the only ways to beat the markett (i.e., to beat the index you are trading) are to:
- identify and trade "intermediate-term" opportunities (trade-able dips, 20% "corrections", etc.), and/or to
- trade with some leverage (e.g., 1.33x leverage by trading 2/3 SPY and 1/3 SSO on long signals)
- we do not use leverage on shorts, so we either short the SPY (recommended) or buy the inverse SH.
2) Beat the market soundly in down markets ("crashes"). Our minimum goal is that we "gain" at least 1/2 of the total percentage that the market "loses" in a crash (e.g., market down 50%, MIPS up at least 25%).
- all of the MIPS models did way better than that in 2008.
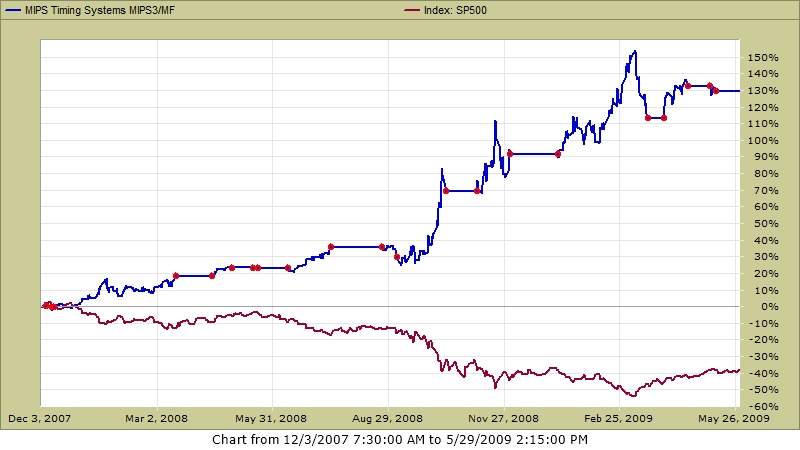
- MIPS3 was live then and its "gains" were verified by TimerTrac.com (see the Graph #2 below).
BTW, everyone that has been in the market for 10-20+ years would have had unbelievable performance if they had somehow just "avoided" every market crash, and started their up-trend ("recovery") where these markets "peaked" rather than where they "bottomed" (i.e., no losses in the crash). A good timing system would do even better by just "keeping up" in up markets and making some money during market crashes. It is not difficult to calculate how much money you would have if you just "avoided" the two market crashes since 2000; and, of course, you would have made even more if you had been short at the right times in the "big falls" (as MIPS3 did in Graph #2 below).
Note: When we show performance results from the "MIPS models" we normally use MIPS3/MF because that model has been in use and verified by TimerTrac.com since 11/04/2005. But, please be aware that MIPS4 is a much better model than MIPS3, but it does not have as long a verified track record as MIPS3
- in 2007-mid'2015, MIPS3 was up about 380% and MIPS4 was up 880%, when the SPY was up only 90%.
Exactly what does TimerTrac.com say about the MIPS3 performance since since 2008...
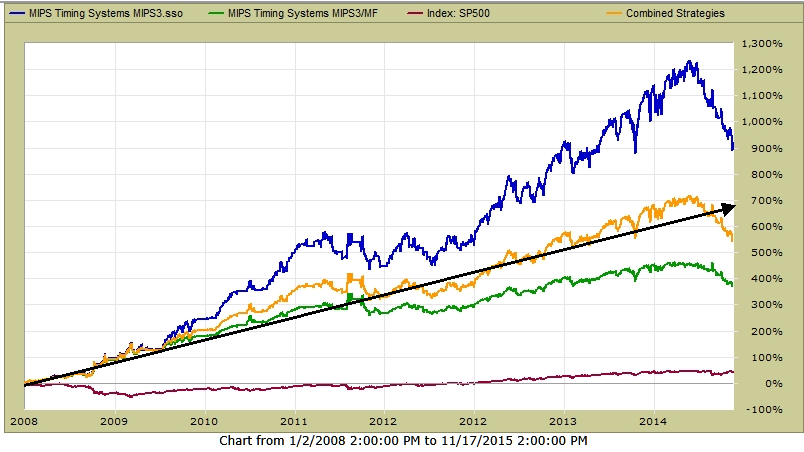
Please refer to the graphs below from TimerTrac.com (with 1.0x, 1.33x, and 1.5x leverage), where:
Graph #1 - MIPS3 in 2008-Nov'15 trading 1.33x leverage on Long signals and 1.0x on Shorts (Gold line)
- Note that the Green line in the graph is with 1.0s (no leverage)
Sure we have had somewhat bad periods in 2011 and 2015, but MIPS3 recovered after 2011, and should after 2015
- even with its not-so-good 2015, MIPS3 is still ranked #1 by TimerTrac.com from 2008-2015, and it is way ahead
of the 2nd ranked model.
GRAPH #1 2008-15 SPY = +124% MIPS3 w/1.0 leverage +380% MIPS3 w/1.33x leverage = +550%

Graph #2 - MIPS3 in 2008 -May'09
- trading the 2008 market crash , with no leverage
- red "dots" on graph show "trades"
SPY = -40% (yes, -40%) MIPS3 = +130%

Going Forward into 2016 ...
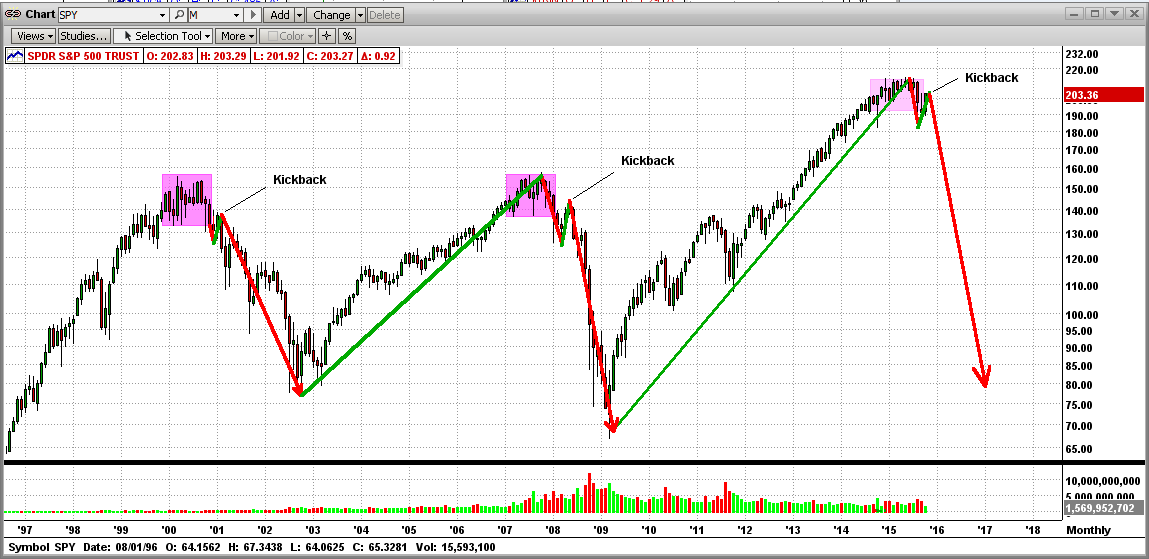
We still believe that this market could be "topping" now, thereby signaling a big crash before the end of 2016.
- this is why every individual investor needs a tried-and-proven timing model to help them avoid a 50% market crash.
- see the graph below to see the "topping" processes in the 2000 and 2008 market crashes (not the "kickbacks").
Stay Tuned...

Hope this helps...