Many MIPS members are asking us if we think that this market in 2015 is headed for "A Crash or A Correction". My answer, of course, is that nobody knows for sure.
From an economic viewpoint, things look "bleak". The US economy is not in good shape (barely growing at all); the Fed is getting ready to mess things up again; China is in deep trouble as its growth rate is slowing dramatically and its stock market is about to collapse; Japan is stagnant; Greece is still waffling; etc.
From the view of technical analysis, things are just as bad! Different charts show different outcomes (more below). And, even if all of the charts in the world agreed today, that DOES NOT mean that they can predict the direction of the market next week or longer.
What this equates to is that the only hope we have to determine the intermediate-term direction of the market is a good mechanical, mathematical timing model that can interpret the near-term directional changes in market trends as they develop (not daily, and not for 6 months from now, but more like the weekly/monthly trend). And, of course, that is what the MIPS models do, and do well.
Back to technical analysis of the market price movements and charts... Of course, technical analysis would not still be around if it did not as least show us the "probable" moves of the market and when certain directions are highly possible. However, many times there are contradictory views, and that is where I think we are now. See a brief explanation of this below.
The Case For a Market Crash
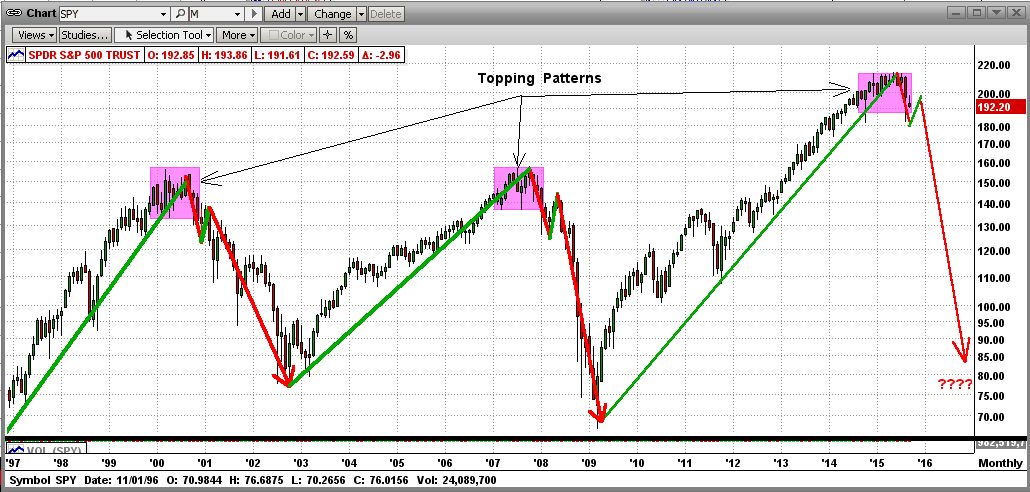
Without going through the details, many chartists think that the market is in a "Topping Pattern", where the big guys (institutional investors) are dumping heavily to prepare for a big market crash (one that they are basically causing). That happened both in 2000 and 2008 (and probably preceding all market crashes).
The chart below is what is driving this belief of most chartists today. See the graph immediately below. Does the market behavior today look very close (i.e., almost identical) to the markets in 2000 and 2008, when the fat kats took away 40-55% of our hard-earned money in two big crashes? If so, why not just go to cash now and wait out the drop? Read on...
The Case for a Market Correction
We do not have to simply bet on this "big drop" now, and possibly be wrong and lose big $bucks$. It is possible that the markets now may NOT be heading toward a "Crash" (like in 2000 and 2009), but merely to a "Correction" (like in 2011). The "chartist" evidence for a Correction below is almost as compelling as the evidence for a Crash, as above
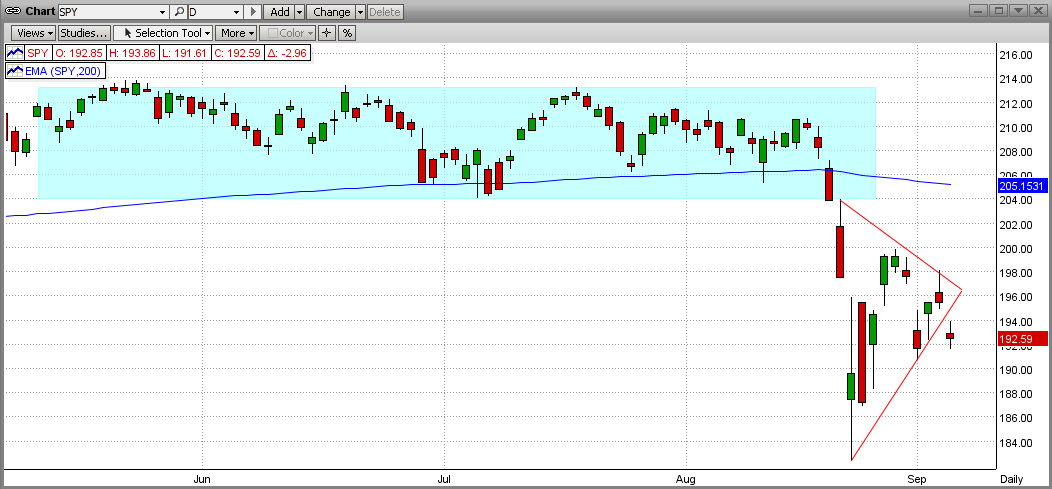
The Market in 2015
The Market in 2011
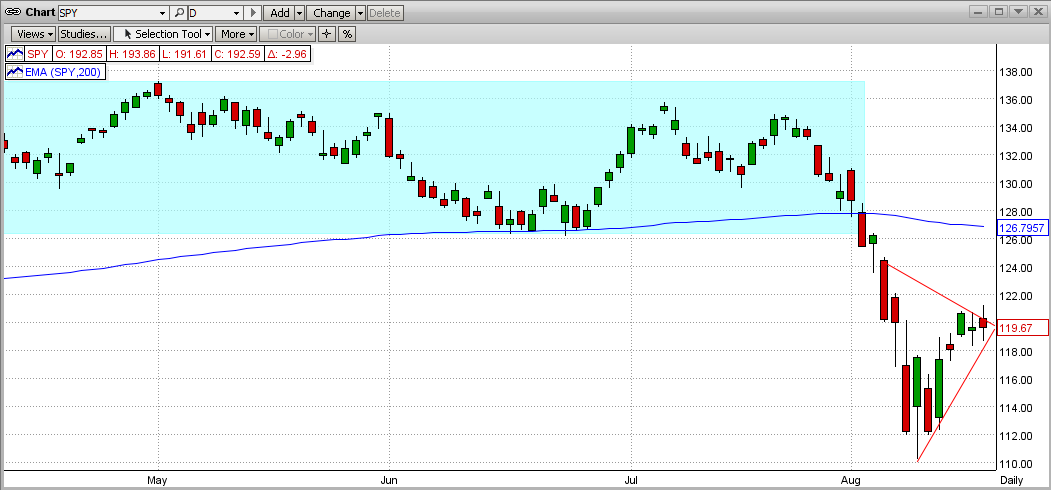
Compare the last two graphs above (2015 vs 2011). Do they look similar (or almost dead on)? Did the market in 2011 lead to a full blown market "Crash" as it did in 2000 and 2008? Read on...
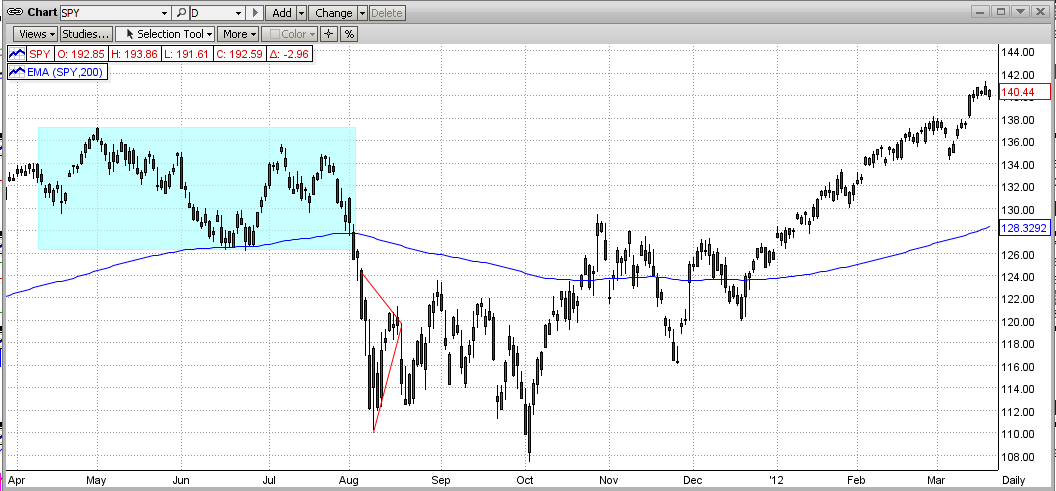
The Market After 2011
Sorry, the drop in 2011 did not lead to a 40-50% "Crash", as you can see below in 2011-early 2012. The 2011 market suffered through a Correction and recovered to new highs over the next 3 years, before "flattening out" again in 2015. See graph immediately below.
So, you see that trying to predict the market behavior beyond the scope of what you can see now is very dangerous. It's better to wait for MIPS to "drive us" in the right direction. After each "topping" process the market drops, and then seems to waffle for a relatively short while (like weeks) before it "breaks", and heads back up or continues down. This is a critical "trend change", and that is where MIPS shines (and what it is developed to do).
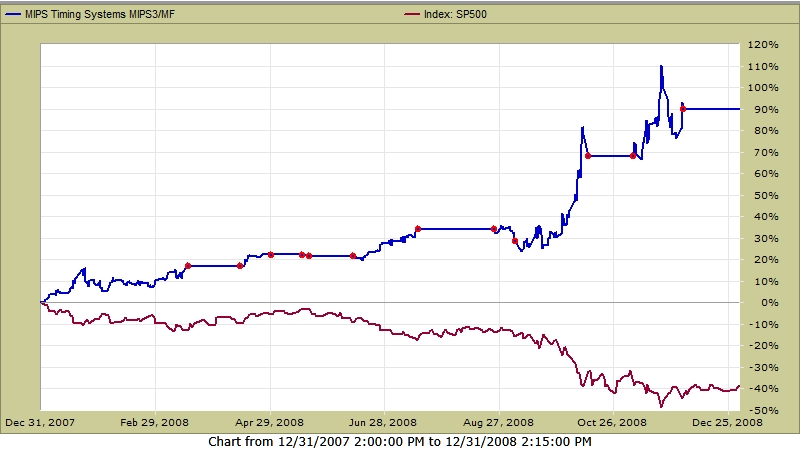
MIPS in 2008
it is easy for a market developer (like me) to "claim" that their model will do well in any type of market (like in a big bear market), but our MIPS3 model was "live" in 2008 and "tracked" by TimerTrac.com. And, remember, MIPS3 is also the "core" of all of our newer models, like MIPS4 and MIPS/Nitro.
So, see the graph below for how MIPS3 did in 2008... MIPS +90% SPY -40%.
(The red dots are trades.)