Thursday, May 11 2017
MIPS members who have been with us for a while know that I call large "Institutional Investors" the "Fat Kats" and/or the "Big Guys". Institutional investors include giant financial companies like Goldman Sachs, Morgan Stanley, BlackRock, State Street Global, PIMCO, etc.
How big are the Big Guys? Well there are less than 2000 Fat Kats in the US markets, but they "control" over 65% of the shares on the New York stock exchange (and most of this is controlled by the top 100). "Little Guys", like you and me and other "multi-millionaires" (haha) from all over the world that own stocks in the US markets (200 million of us), only control 35%. So, when the Fat Kats decide to get in or out of the market many of them often do so at the same time; and hence, their high volumes "move the markets". Us 200 million Little Guys, on the other hand, are not trading all day, every day like the Big Guys. This is because us Little Guys have other things to do than to "trade" - lawyers are in court, surgeons are removing someone's gizzards, engineers are launching missiles, etc. And even if a large number of us Little Guys would trade on the same day, we do not own enough shares to significantly "move the entire market".
Therefore, the Fat Kats leave a "footprint" (their daily volume). When the market goes up on high volume, we know who bought; and when the market tanks on high volume, we know who sold. They may as well send out emails saying "The Big Guys are buying" and/or "The Big Guys are selling".
For this reason, we at MIPS "adjust" the market data depending on volume. We call this Volume Adjusted Data (or VAD). Therefore, on high volume a 1% gain in the market (like in the S&P 500) may be looked upon within MIPS as a 1.5-2.0% gain; and vice versa on low volume. BTW, for the above reason, the Fat Kats wish that the total daily market volume was not published (they can't hide).
This brings us to the purpose of this Blog.
The Title is... Where and Why are the "Big Guys" Hiding?
Before we answer that, we need to explain how we know that the Big Guys are hiding and then explain why that is important.
The market has had a remarkable run to the upside since the Presidential election on Nov 11, 2017. That run was on relatively high volume. Then, the market took a break and meandered down a little until Friday, April 21st.
Now, see the relatively weak up-trend since Monday, April 24th in the graph below (blue lines).
This is NOT a good sign, because:
(a) the new up-trend is weak,
(b) the trading range is very narrow,
(c) the volatility is almost non-existent (meaning very little involvement from Fat Kats, and
(d) worst of all, the volume has tapered off to about 1/2 of its prior level, as of today (May 11th).
Read on...
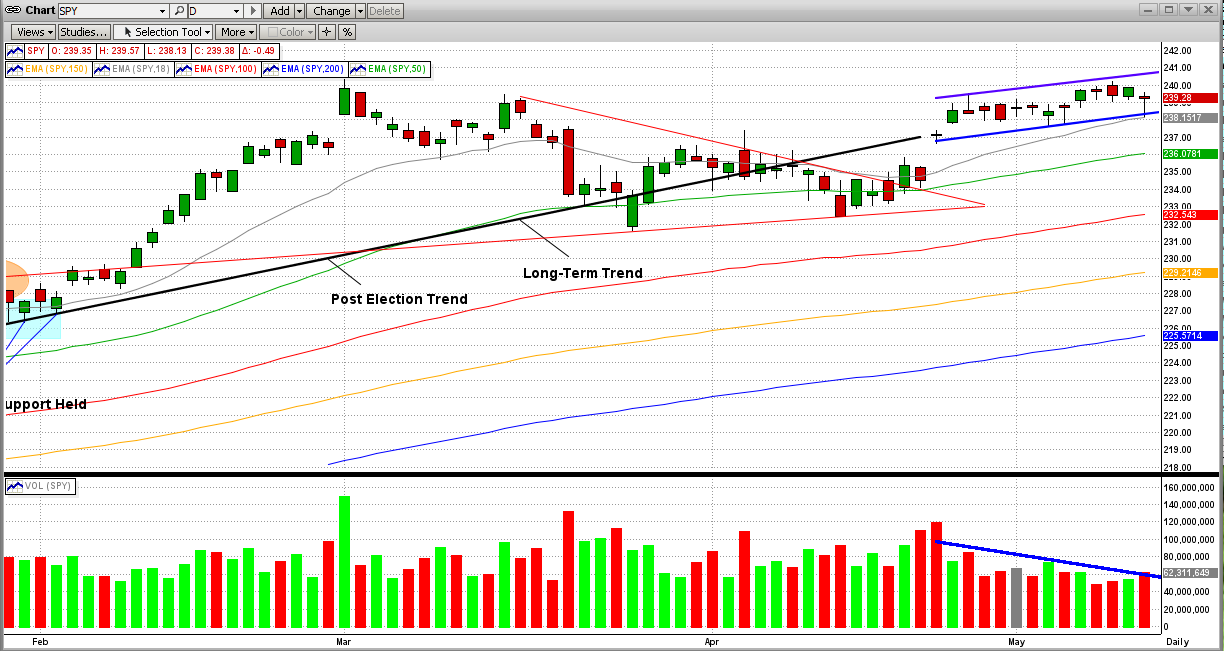
The conclusion from above is that, since the volume has basically collapsed, the Big Guys are "Hiding" on the sidelines. When markets experience very tight trading patterns on basically dried-up volume, the next move usually happens fast and moves even faster. Believe me, the Fat Kats have not packed up and gone away. The Bulls are sitting around ready to buy-in big-time at the first sign of good news; and the Bears have their fingers on the sell button, ready to sell on the first sign of bad news. In other words, the Fats Kats are playing it safe.
As you might expect, MIPS is still Long and all signs see it staying that way as long as the trend stays to the upside ("Don't fight the trend"). But, of course, that can change in a few days. Stay tuned...
Paul Distefano, PhD
MIPS Timing Systems, LLC
Houston, TX
281-251-MIPS(6477)
Wednesday, April 26 2017
Whereas MIPS members who have been with us for years have seen this before, lots of "newer" MIPS members are wondering if the most recent MIPS signal (7/11/2016) is our longest ever, or maybe even if the MIPS models ever trade. Of course, they know better, but it can feel that way when a MIPS signal has a long "signal life" (like this 9-month, approximate 180 trading-day signal). {To set the record straight, the current signal is NOT the MIPS signal with the longest signal life . In the past, some have lasted well over a year. And, the MIPS3, MIPS4, and Nitro models trade an average of 12-15 times/year.}
Our previous Blog below explains why and how the MIPS signals can last for a long time (long signal life), and what causes them to change position ("trigger"). The Blog below was meant to be a general explanation, but in this blog, we would like to concentrate on the "current "signal.
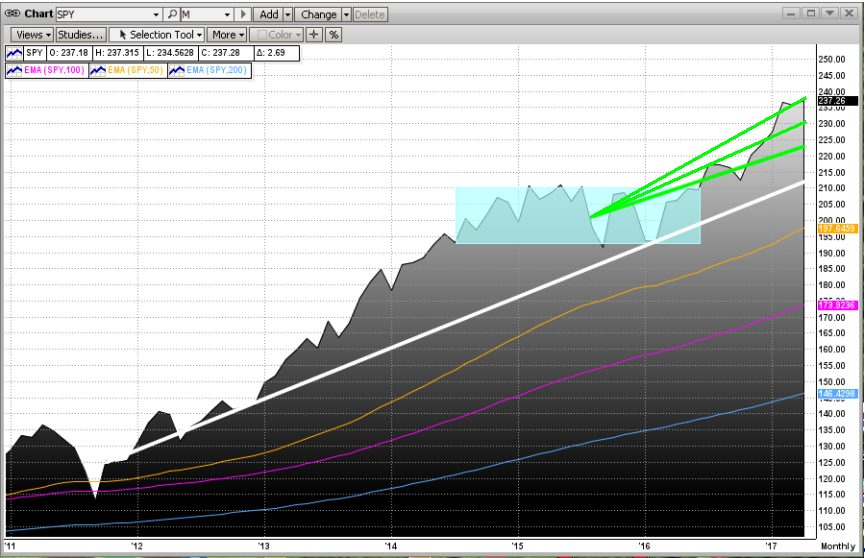
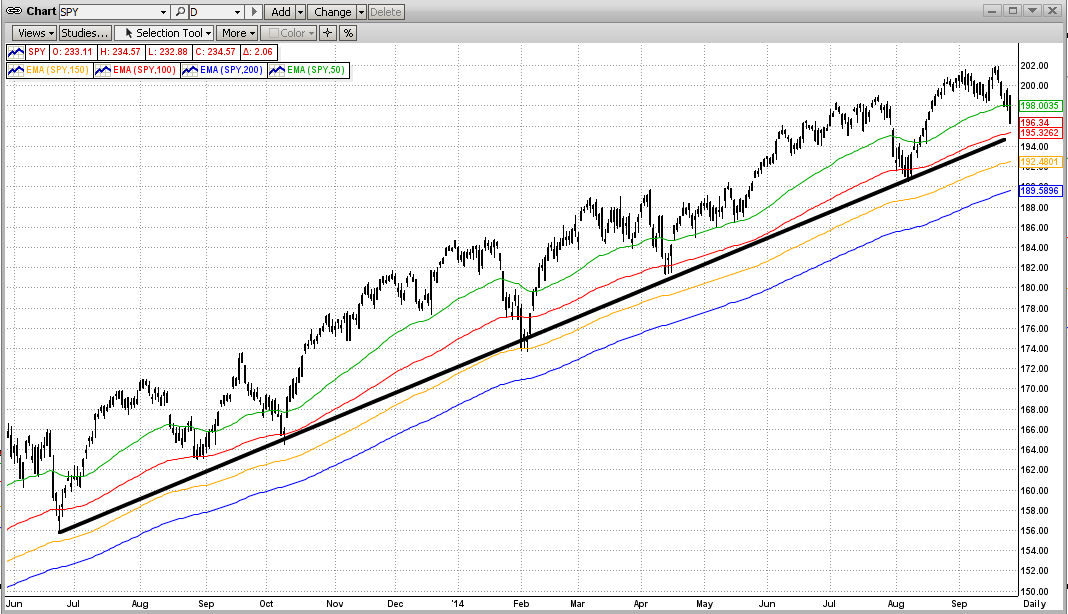
To start, let's analyze the graph below.
- the white trend line shows the strength of the long-term trend (since 2012)
- the orange, pink, and blue lines show the 50-day, 100-day, and the 200-day EMA's
- the green trendlines ("fans") show the strength of the trend since our last signal (7/11/2016)
The trends of the current signal (green "fans") are as strong or stronger than the long-term trend, and the EMAs are going up nicely and are well spread-out as they should be in a typical, strong up-market. BTW, these EMAs will "bunch up" (i.e., get real close to each other) when the market finally "rolls over".
No wonder MIPS is staying Long and not going Short (or to Cash). But, not all models are like MIPS. Many short-term models tried to trade the ups-and-downs in the flat trading range below (blue box), and got whipsawed.
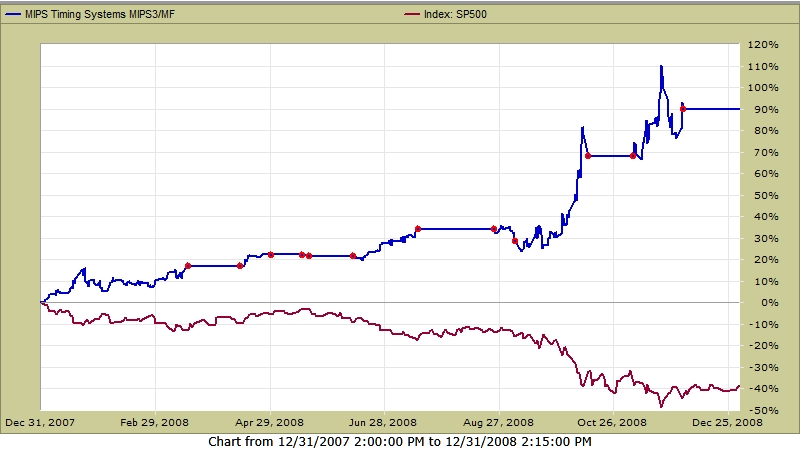
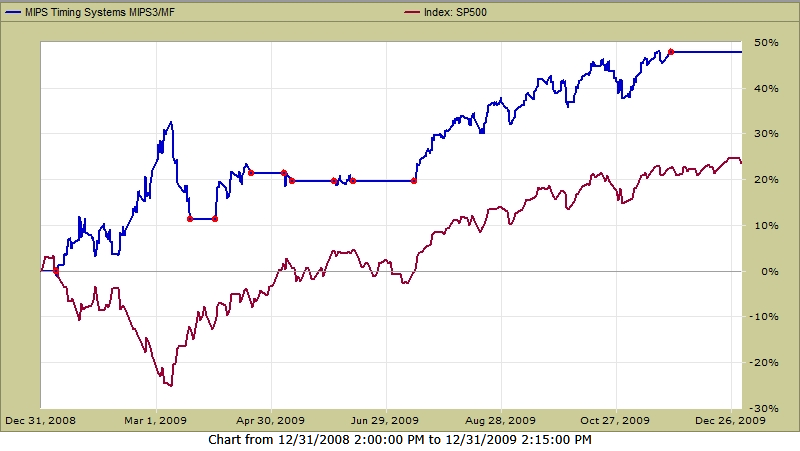
Actual Trades in 2008 and 2009
Just to support our claim that the MIPS models "trade when they should" and don't just "trade to trade", look at the actual, verified trades that the MIPS3 model issued in 2008 and 2009. Of course, this led to great gains (70% and 45%), in these two years respectively. PS - the red dots are actual trade dates.
Actual Trades in 2008 (from TimerTrac.com)
Actual Trades in 2009 (from TimerTrac.com)
And, look at the MIPS3 Performance in 2016-2017 ytd (from TimerTrac.com)
Green - MIPS3 trading SPY 1.0x Long / 1.0x Short
Blue - MIPS3 trading SPY 1.5x Long / 0.5x Short
Red - SPY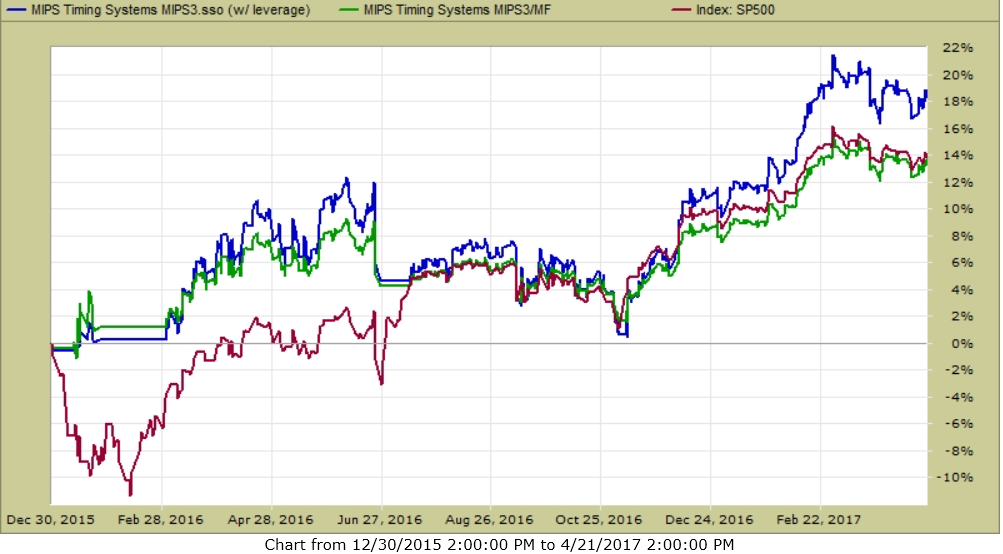
Please feel free to email or call us with questions...
Thanks,
Paul Distefano, PhD
MIPS Timing Systems, LLC
Houston, TX
281-251-MIPS(6477)
support@mipstiming.com
<<< Previous Blog >>>
April 19, 2017
Subj: MIPS - What Makes MIPS "Trigger" a Signal Change?
MIPS Members:
At almost any time, lots of MIPS members ask questions like:
1) Is MIPS getting ready to issue a new signal?
2) What makes MIPS issue a new signal?
3) How much does the market have to drop before a MIPS model issues a "Short Signal" ?
etc, etc, etc.
To understand the answer, one has to understand the concepts of some of the underlying algorithms in the MIPS models. Most "timing models" on the market today are what we would call "Linear Models", which means they basically do the same thing every time a "similar" event happens (like the SPY crossing its 200-day EMA), without regard to different external circumstances.
The MIPS models are much more "self-learning and self-predicting", which means that the MIPS models not only want to know where an indicator stands (like the SPY being above or below its 200-day EMA), but how it got there and where might it go from where it is now. A simple example of this is, if the SPY is 1% below its 200-day EMA, most models would rate this as "negative". But, the way that MIPS would look at this is, if the SPY is 1% below its 200-day EMA and it got there by falling from 6-8% above the 200-day EMA in the last 30 days or so, MIPS would look at this as negative. On the other hand, if the SPY is 1% below its 200-day EMA, BUT it got there by climbing up from 6-8% below the 200-day EMA in the last 30 days, MIPS would look at this as positive (because the "slope" or direction of the SPY is pointing up strongly).
Another, a more pertinent example of MIPS being "adaptive" and not simply doing the same thing every time a "similar" event happens, is that sometimes it takes a 5-6% move in the SPY for MIPS to trigger a new signal (like from Long to Short); but at other times, MIPS could "trigger" a new signal with a move of just 2-3%. This decision is made inside the MIPS models, and it depends upon the "relativity" of the most recent, short-term "move" in the SPY compared to the longer-term behavior of the market.
Examples
Graph #1
The MIPS models would most likely NOT go short on 4-6% drops in the SPY if the market has moved up 12-25% on a strong trend of intermediate-term cycles in the previous several months (kind of like now).
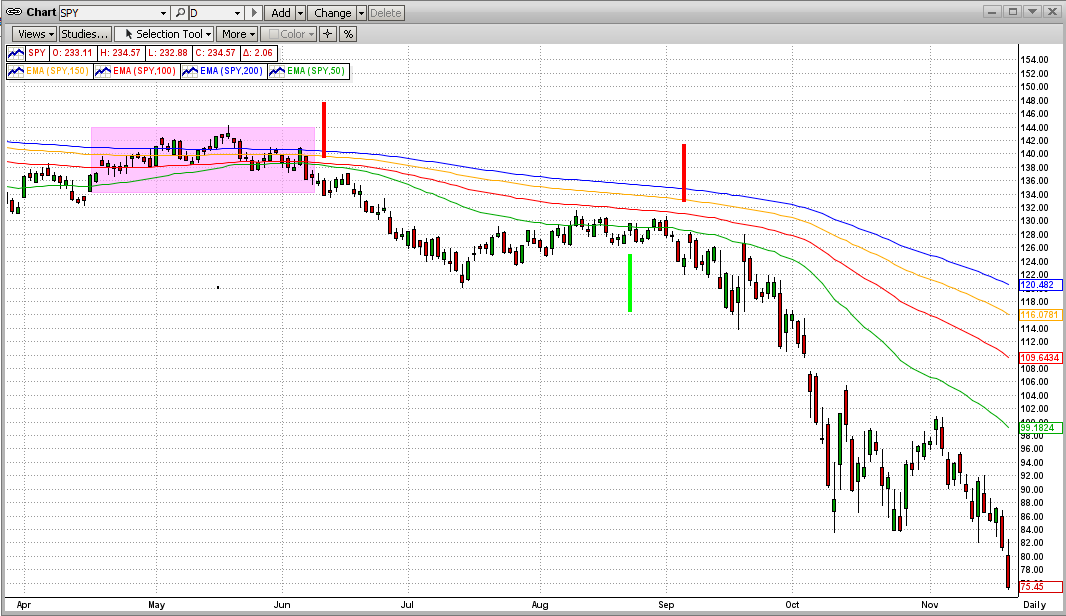
Graph #2
The MIPS models could go short on just a 2-3% drop in the SPY if the market trading range in the previous 3-4 months has been relatively flat; because a 2-3% drop is "significant" relative to the up/down volatility in a flat market. This is a very positive trait of the MIPS models because long-term market trends do not simply change direction instantly, but rather they "waffle" at the top or bottom for a several months (up to 12-15 months) before completely changing direction (called "Topping"). Note - the red and green vertical lines in the graph below show "actual" short and long signals from the MIPS3 model near the beginning of the 2008 Market Crash.
Also, please remember that the MIPS models are designed with higher-level math, pattern recognition, artificial intelligence and well over 100 standard market indicators. And, each of these have a certain "weight" in the final vote (long/short/cash). Through our "self-learning" algorithms, the "weight" of each of the above change over time, depending how accurate their "votes" were in the past. This works great for improving the performance of the MIPS models, but it makes it almost impossible for any "human" to predict the actual time or final cause of a MIPS signal change.
On average, the MIPS3 and MIPS4 models issue an average of 12-14 signals per year. The actual number of signal changes in any given year depends upon the number of times that the intermediate-term cycles change direction (as determined by the models). The MIPS models have traded 18-20 times in some years and only 3-4 times in other years. Some trends tend to go on forever (like now). Our current "Long" MIPS signal has been in effect for over 9 months now (a new record). Our main goal, of course, is making money, not just trading to be trading. Mission accomplished !!!
Please feel free to email or call us with questions...
Thanks,
Paul Distefano, PhD
MIPS Timing Systems, LLC
Houston, TX
281-251-MIPS(6477)
support@mipstiming.com
Wednesday, April 19 2017
At almost any time, lots of MIPS members ask questions like:
1) Is MIPS getting ready to issue a new signal?
2) What makes MIPS issue a new signal?
3) How much does the market have to drop before a MIPS model issues a "Short Signal" ?
etc, etc, etc.
To understand the answer, one has to understand the concepts of some of the underlying algorithms in the MIPS models. Most "timing models" on the market today are what we would call "Linear Models", which means they basically do the same thing every time a "similar" event happens (like the SPY crossing its 200-day EMA), without regard to different external circumstances.
The MIPS models are much more "self-learning and self-predicting", which means that the MIPS models not only want to know where an indicator stands (like the SPY being above or below its 200-day EMA), but how it got there and where might it go from where it is now. A simple example of this is, if the SPY is 1% below its 200-day EMA, most models would rate this as "negative". But, the way that MIPS would look at this is, if the SPY is 1% below its 200-day EMA and it got there by falling from 6-8% above the 200-day EMA in the last 30 days or so, MIPS would look at this as negative. On the other hand, if the SPY is 1% below its 200-day EMA, BUT it got there by climbing up from 6-8% below the 200-day EMA in the last 30 days, MIPS would look at this as positive (because the "slope" or direction of the SPY is pointing up strongly).
Another, a more pertinent example of MIPS being "adaptive" and not simply doing the same thing every time a "similar" event happens, is that sometimes it takes a 5-6% move in the SPY for MIPS to trigger a new signal (like from Long to Short); but at other times, MIPS could "trigger" a new signal with a move of just 2-3%. This decision is made inside the MIPS models, and it depends upon the "relativity" of the most recent, short-term "move" in the SPY compared to the longer-term behavior of the market.
Examples
Graph #1
The MIPS models would most likely NOT go short on 4-6% drops in the SPY if the market has moved up 12-25% on a strong trend of intermediate-term cycles in the previous several months (kind of like now).
Graph #2
The MIPS models could go short on just a 2-3% drop in the SPY if the market trading range in the previous 3-4 months has been relatively flat; because a 2-3% drop is "significant" relative to the up/down volatility in a flat market. This is a very positive trait of the MIPS models because long-term market trends do not simply change direction instantly, but rather they "waffle" at the top or bottom for a several months (up to 12-15 months) before completely changing direction (called "Topping"). Note - the red and green vertical lines in the graph below show "actual" short and long signals from the MIPS3 model near the beginning of the 2008 Market Crash.
Also, please remember that the MIPS models are designed with higher-level math, pattern recognition, artificial intelligence and well over 100 standard market indicators. And, each of these have a certain "weight" in the final vote (long/short/cash). Through our "self-learning" algorithms, the "weight" of each of the above change over time, depending how accurate their "votes" were in the past. This works great for improving the performance of the MIPS models, but it makes it almost impossible for any "human" to predict the actual time or final cause of a MIPS signal change.
On average, the MIPS3 and MIPS4 models issue an average of 12-14 signals per year. The actual number of signal changes in any given year depends upon the number of times that the intermediate-term cycles change direction (as determined by the models). The MIPS models have traded 18-20 times in some years and only 3-4 times in other years. Some trends tend to go on forever (like now). Our current "Long" MIPS signal has been in effect for over 9 months now (a new record). Our main goal, of course, is making money, not just trading to be trading. Mission accomplished !!!
Please feel free to email or call us with questions...
Thanks,
Paul Distefano, PhD
MIPS Timing Systems, LLC
Houston, TX
281-251-MIPS(6477)
support@mipstiming.com
Sunday, March 19 2017
We sent out the email below at 1:24am today. Since then, we have been inundated by MIPS members asking us to show the "backtested" performance results from the newest MIPS3 and MIPS4 "Blaster" models that we referred to in the last sentence in the last paragraph in the previous email below.
I.) Original - That last sentence in the last paragraph read:
"Backtesting shows that the current MIPS3 and MIPS4 "Blaster Series" models would have produced results more than three times better than the results below from our original model. And, the maximum drawdowns would have been much smaller (14% vs. 20%)"
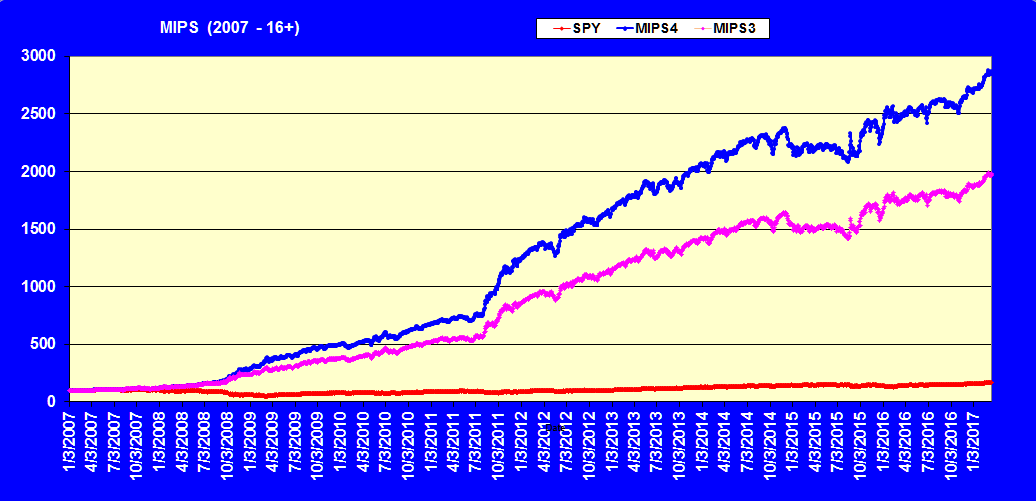
II.) Update - As you can see in the graph immediately below, the last sentence should have read:
"Backtesting shows that the current MIPS3 and MIPS4 "Blaster Series" models would have produced results of 4 times and 5 times better (20 and 28 times their money, respectively) than the results below from our original model. And, the maximum drawdowns would have been much smaller (10% vs 20%)"
MIPS3 and MIPS4 "Blaster" from 2007 - 03/17/2017 (Bacltested)
--------------------------------------------------------------------------------------------------------------------------------
Sent: Sun, 19 Mar 2017 01:24:24 -0500
MIPS Members:
As most of you know, MIPS is basically a Trend Following model, where a market "Trend" is defined as a market that either moves up over time with higher-highs and higher-lows (Up Trend), or moves down over time with lower-highs and lower-lows (Down Trend).
Technical analysts have discovered 27 cycles where identifiable trends occur. Many of these are for "Day Traders" who may trade 6-15 times a day to active traders who may trade 3-5 times a week. These would be identified as very-high-frequency traders.
We will concentrate herein on explaining the three most common (and broad) cycles that most individual analytical investors use; namely Short-Term Cycles (days-weeks), Intermediate-Term Cycles (weeks-months), and Long-Term Cycles (quarters-years). The MIPS models identify each of these trends, and trade mainly on the behavior of intermediate-term cycles (but will yield to short-term or long-term when the trend is extra strong and compelling).
Remember, the MIPS models trade between 6-15 times/year on average. But, no matter how often or how seldom a model trades, good models will almost never go against the trend (as in "Don't Fight the Trend"). So, some years the models could trade 18 times, and other years maybe only 2-4 times.
Also, please be aware that the MIPS models contain algorithms that will force themselves to abandon trend following analysis under certain conditions; such as flat-markets (trendless), compellingly over-bought or over-sold conditions (reversion to the mean), and VERY short-term cycles (to prevent getting whipsawed).
To bring this into our current conditions, please refer to the graph below. The time frame for this graph is between the market bottom in March 2009 and today. Therein, the short-term trend lines are the black ups-and-downs, the intermediate-term trend lines are green and red, and the very long-term term trend line (secular trend) is blue.
From the graph below, you can see with your own eyes that investors that stayed long the entire time from valley to peak (blue trend line) would have done well, as in 3.15 times their money from 75 to 237 in these eight years.
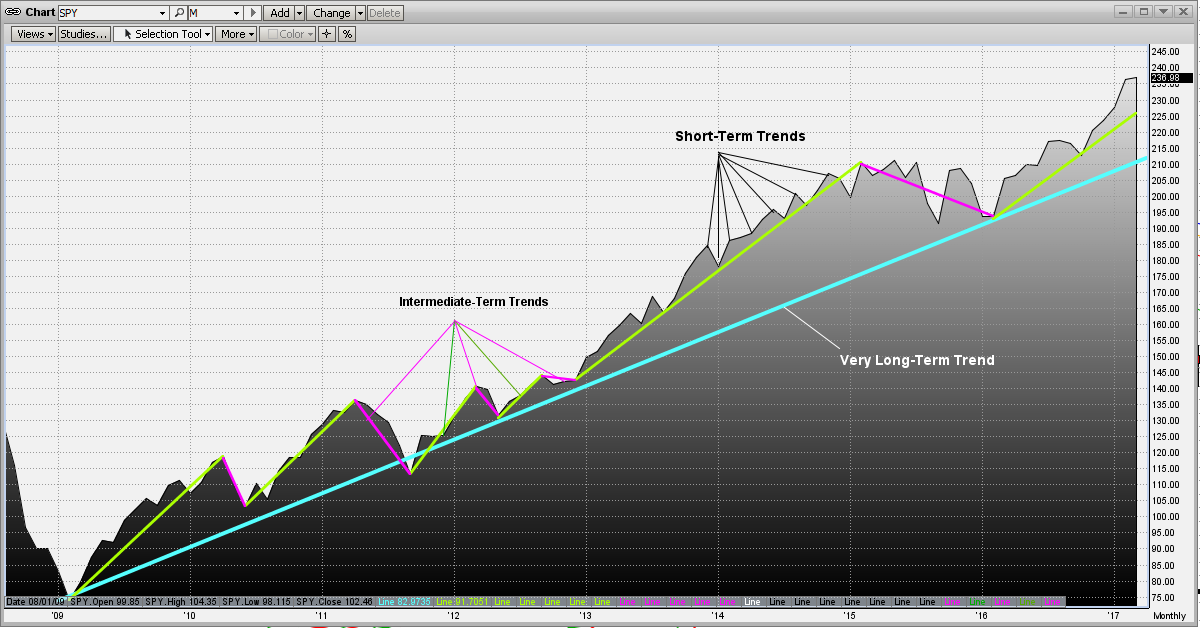
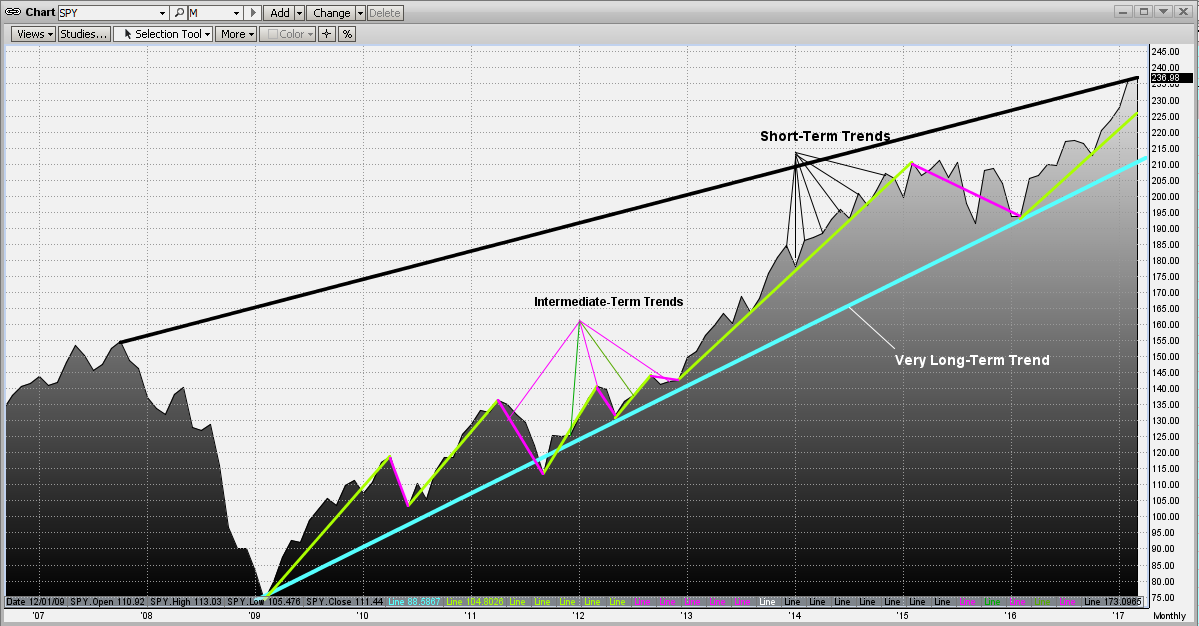
However, it is unlikely that many buy-and-hold investors would have been lucky enough to buy in at the very bottom in March 2008. Most buy-and-hold investors would have been in for a while, so how would they have done from the peak in October 2007 until now (March 2017)? For that, we will see the answer in the black trend line in the graph below. From this, it can be seen that investors would have 1.53 times their money from 155 to 237 (this is only about 1/2 of the growth from valley to peak above).
We will never know what would have happened with the short-term strategy, but we can say if the model was correct a large percent of the time, the returns would have been much higher that that above. But if the accuracy was only mediocre, investors would have gotten whipsawed and risked a large part of their portfolio.
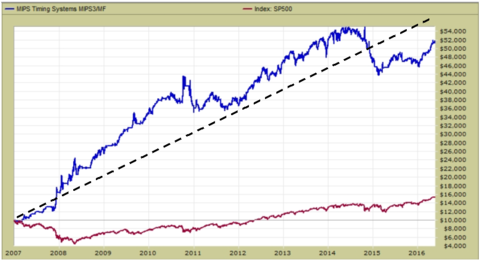
The good news is we can show you verified results of how our "original" intermediate-term model (MIPS3) would have performed in the Oct 2007 to March 2009 time frame. For that, see the graph below from TimerTrac.com (the largest and most respected 3rd party model "tracking" company in the USA).
Investors that followed MIPS3 would have enjoyed gains of 5.20 times their money (much, much better than the 1.53 times their money from buy-and-hold). PS - Even better, these are the results from our original MIPS3 model, because it is the only one of our models that was live all the way back to 2007 (and hence has "verified" results). Backtesting shows that the current MIPS3 and MIPS4 "Blaster Series" models would have produced results more than three times better than the results below from our original model. And, the maximum drawdowns would have been much smaller (14% vs 20%)
We are very proud of our MIPS models and their performances.
Paul Distefano, PhD
CEO / Founder
MIPS Timing Systems, LLC
Houston, TX
281-251-MIPS(6477)
Sunday, March 19 2017
As most of you know, MIPS is basically a Trend Following model, where a market "Trend" is defined as a market that either moves up over time with higher-highs and higher-lows (Up Trend), or moves down over time with lower-highs and lower-lows (Down Trend).
Technical analysts have discovered 27 cycles where identifiable trends occur. Many of these are for "Day Traders" who may trade 6-15 times a day to active traders who may trade 3-5 times a week. These would be identified as very-high-frequency traders.
We will concentrate herein on explaining the three most common (and broad) cycles that most individual analytical investors use; namely Short-Term Cycles (days-weeks), Intermediate-Term Cycles (weeks-months), and Long-Term Cycles (quarters-years). The MIPS models identify each of these trends, and trade mainly on the behavior of intermediate-term cycles (but will yield to short-term or long-term when the trend is extra strong and compelling).
Remember, the MIPS models trade between 6-15 times/year on average. But, no matter how often or how seldom a model trades, good models will almost never go against the trend (as in "Don't Fight the Trend"). So, some years the models could trade 18 times, and other years maybe only 2-4 times.
Also, please be aware that the MIPS models contain alogrithms that will force themselves to abandon trend following analysis under certain conditions; such as flat-markets (trendless), compellingly over-bought or over-sold conditions (reversion to the mean), and VERY short-term cycles (to prevent getting whipsawed).
To bring this into our current conditions, please refer to the graph below. The time frame for this graph is between the market bottom in March 2009 and today. Therein, the short-term trend lines are the black ups-and-downs, the intermediate-term trend lines are green and red, and the very long-term term trend line (secular trend) is blue.
From the graph below, you can see with your own eyes that investors that stayed long the entire time from valley to peak (blue trend line) would have done well, as in 3.15 times their money from 75 to 237 in these eight years.
However, it is unlikely that many buy-and-hold investors would have been lucky enough to buy in at the very bottom in March 2008. Most buy-and-hold investors would have been in for a while, so how would they have done from the peak in October 2007 until now (March 2017)? For that, we will see the answer in the black trend line in the graph below. From this, it can be seen that investors would have 1.53 times their money from 155 to 237 (this is only about 1/2 of the growth from valley to peak above).
We will never know what would have happened with the short-term strategy, but we can say if the model was correct a large percent of the time, the returns would have been much higher that that above. But if the accuracy was only mediocre, investors would have gotten whipsawed and risked a large part of their portfolio.
The good news is we can show you verified results of how our "original" intermediate-term model (MIPS3) would have performed in the Oct 2007 to March 2009 time frame. For that, see the graph below from TimerTrac.com (the largest and most respected 3rd party model "tracking" company in the USA).
Investors that followed MIPS3 would have enjoyed gains of 5.20 times their money (much, much better than the 1.53 times their money from buy-and-hold). PS - Even better, these are the results from our original MIPS3 model, because it is the only one of our models that was live all the way back to 2007 (and hence has "verified" results). Backtesting shows that the current MIPS3 and MIPS4 "Blaster Series" models would have produced results more than three times better than the results below from our original model. And, the maximum drawdowns would have been much smaller (14% vs 20%)
We are very proud of our MIPS models and their performances.
Paul Distefano, PhD
CEO / Founder
MIPS Timing Systems, LLC
Houston, TX
281-251-MIPS(6477)
Saturday, February 25 2017
A money manager (RIA) customer of mine uses our MIPS models along with models from other developers to trade his various strategies. He recently mentioned to me that he received an email from one of his other model developers that sounded almost apologetic for being in a Long Signal for so long (not to mention that his users have done very well in the last 12 months).
That sounds like MIPS. Our current "Long Signal" from 7/12/2016 now has the longest signal life in MIPS' 11-year history. As most of you know, I personally use a little leverage (but less than 1.5x), in order to "beat the market" some in extended uptrend periods (but almost never any leverage on short signals). That keeps me interested instead of getting bored.
BTW - With ETFs, you can effectively generate 1.5x leverage by buying 50% of the 2x SSO and 50% of the 1x SPY. Or, you can attain 1.25x leverage with 25% SSO and 75% SPY, and so forth. You trade 0.5x when you buy SPY with 50% of your investment money and leave the rest in cash (but ready to trade with on any day). With mutual funds, Rydex offers at least one 1.5x S&P 500 fund.
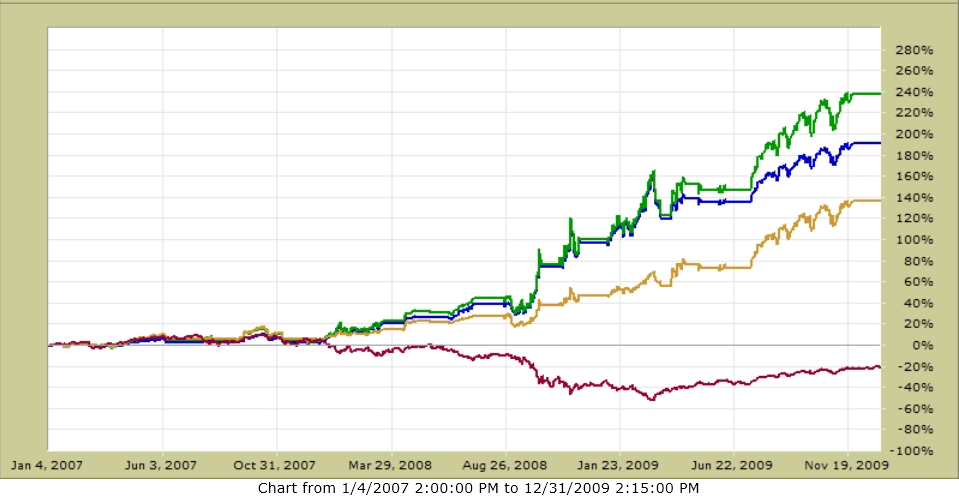
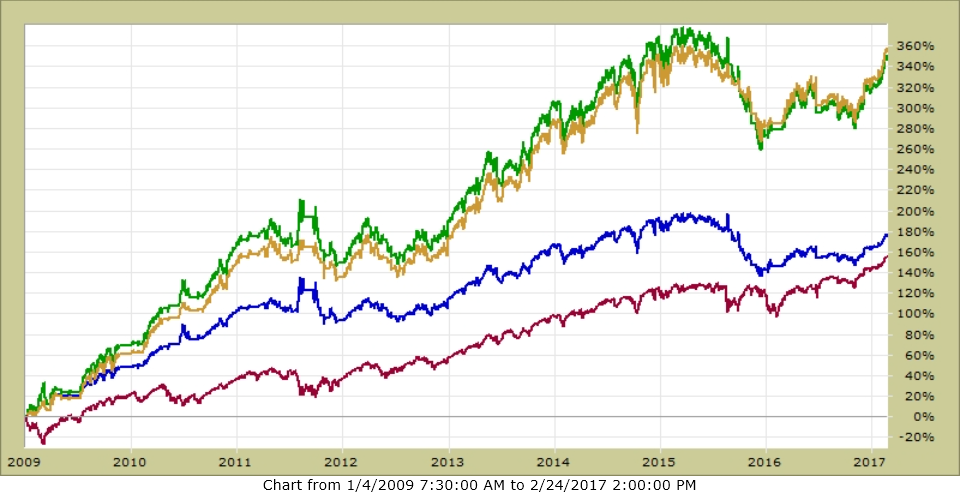
We will show you how MIPS3 would have behaved with these various trading profiles. The graphs below are MIPS3 trading SPY using verified signal data from TimerTrac.com. Let's look at the 10+ year period between 2007 and 2017 YTD in three views, namely:
I.) for the period 2007-2017 YTD (up and down markets),
II.) for the period 2007-2009 (mostly down market), and
III.) for the period 2009-2016 YTD (mostly up market).
The 3 lines on each graph below are with MIPS:
Green Line - Trading SPY with 1.5x Long and 1.0x Short - Aggressive
Gold Line - Trading SPY with 1.5x Long and 0.5x Short - Moderate
Blue Line - Trading SPY with 1.0x Long and 1.0x Short - Conservative
I. - For the period 2007-2017 ytd (up and down markets)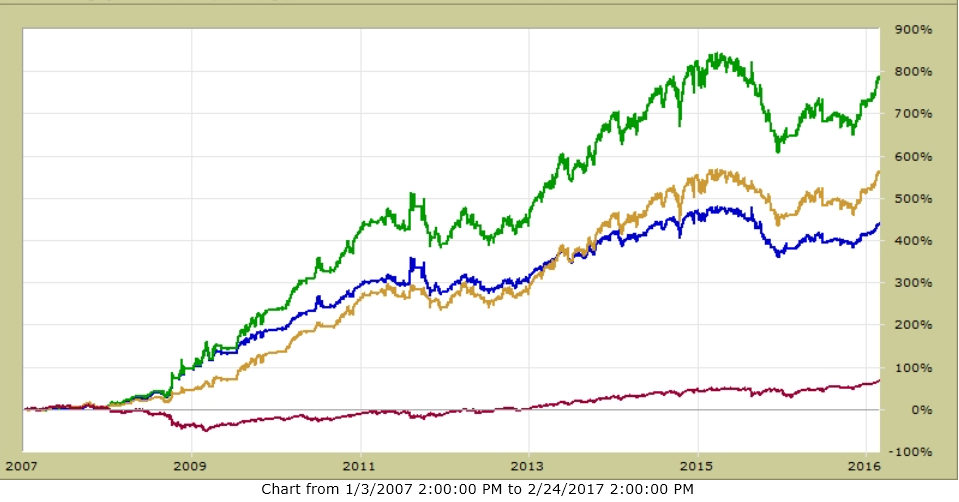
II - For the period 2007-2009 (mostly down market)
III - For the period 2009-2016 ytd (mostly up market)
Note: The above is from our original MIPS3 model which has verified signals on TimerTrac.com going back to Nov 4, 2005. MIPS3 is still a very good model (ranked #1 on TimerTrac.com since 2006). MIPS4 is a better model, but it only has verified signals since Sept 2013.
No one can tell you which of these is best for you, it depends upon your risk/reward temperament; that is, can you take higher risk (bigger drawdowns) for higher rewards; or would rather minimize your risk and be willing to give up some performance.
Most good investors get a little more aggressive in up markets (to a point of the market being way too "overbought") and cut back on risk in shakier markets (like sideways waffling). Remember, you do not have to marry any of the above strategies, but do not switch them every time the market makes a little move up or down ("wiggles").
Let's enjoy this ride while it lasts. Some time this year I will most likely be explaining to you why MIPS is trading so often. That's all part of the success.
Stay tuned...
Paul Distefano, PhD
President/CEO
MIPS Timing Systems, LLC
Houston
281-251-MIPS(6477)
Tuesday, January 31 2017
The market pundits are citing things like the Trump rally has run its course and that February is NOT normally a good month in the stock market. As "proof" they point out that, in the last 40 years, in the "good months" between November-April (where they all go when they come back from "sell in May"), February has average gains of only 0.06% (yes, that's six 100ths of a percent). Furthermore, in the February's following presidential election years, the market has dropped an average of -1.85%.
So, what are the last few days in the market telling us from a technical standpoint.
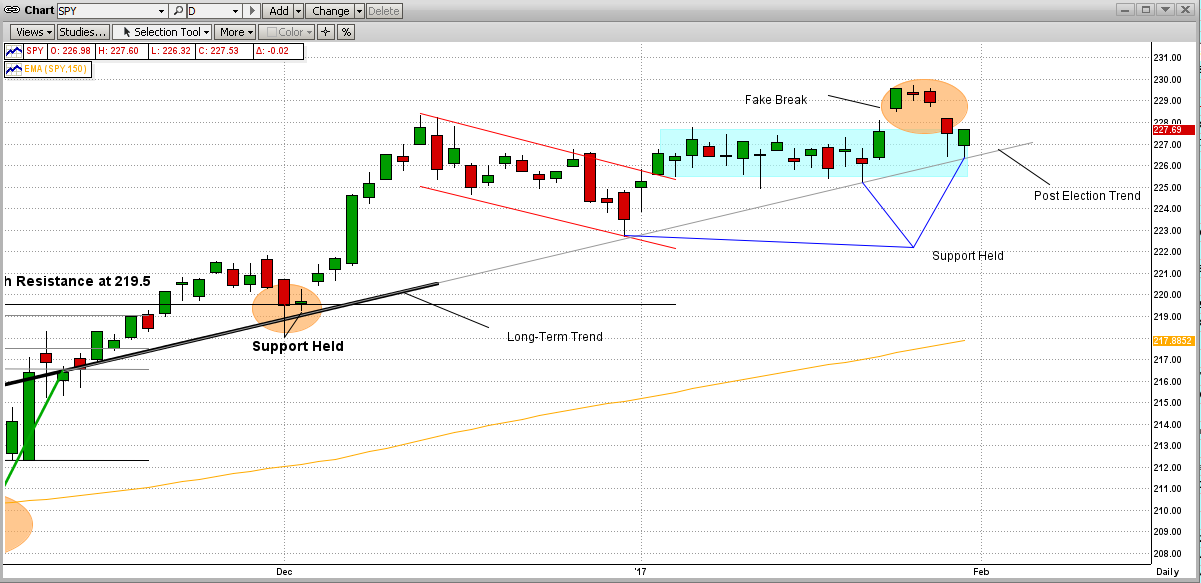
See the graph below:
1) the bold black trend line on the left is the "Long-Term Trend",
2) the light gray trend line extension is what I have called the Post Election Trend Line, but it really
is just a natural continuation of the long-term trend line.
3) the orange circle on the top right is a "fake break" to the upside,
4) the blue lines point out where the SPY has dipped to its trend line, hit it, and bounced back up
(in technical terms, the support level "held its ground" each time, which is bullish).
5) For our hard-core technical MIPS members, let us not ignore another bullish technical indicator.
Today (Tuesday) the SP500 "candlestick bar" formed a near-perfect "up hammer", by opening down
(-7 on SP500), falling another -7 point segment during the day (-14 total), and then bouncing back
up to close +12 points above its low-point (-2 for the day). PS - The graph below is for the SPY,
not the SP500; but of course, the similarity is there.
Of course, today's action is not why MIPS has stayed in a long position for so long (read previous blog for why that is). It is mainly because a good trend following model will rarely go short when the market is above its trend. But, good trend following models (like MIPS) will have algorithms that will take themselves short or to cash with a relatively big drop above the trend line [e.g., reversion-to-the-mean algorithms in overbought (or oversold) markets].
Overall, by following the trend, the MIPS models have done well in the recent market (see graph below).
- from TimerTrac.com
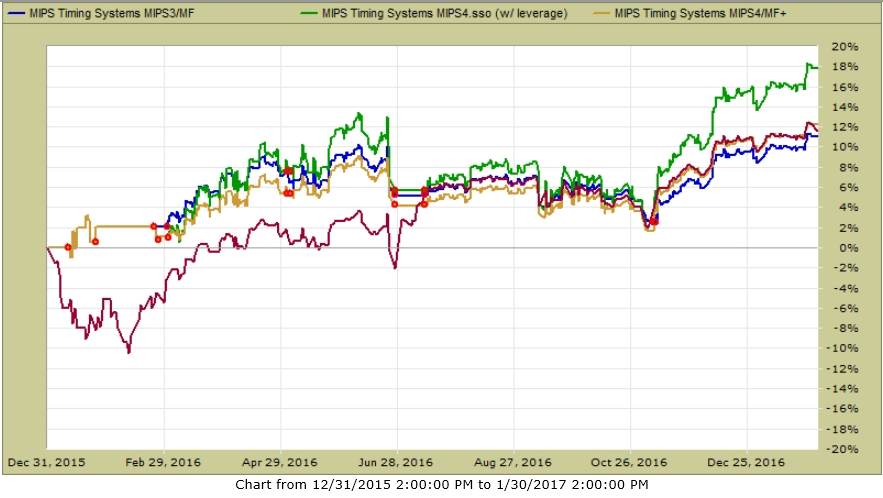
In the above, you can see the following results for the time period of Jan'16-Jan'17:
Red Line - S&P 500 = +11.9%
Blue Line - MIPS3 trading SPY 1.0x Long and 1.0x short = +11.1%
Gold Line - MIPS4 trading SPY 1.0x Long and 1.0x short = +12.2%
Green Line - MIPS4 trading SPY 15.x long and 1.0x short = +17.9% *
* note: 1.5 leverage on long positions
Stay tuned...
It appears that the market will continue to the upside, but let's wait for MIPS to provide us with more "good guidance" going forward !!!
Paul Distefano, PhD
President/CEO
MIPS Timing Systems, LLC
Houston
251-281-MIPS(6477)
Sunday, January 29 2017
Trading frequency is a very important part of the performance of timing models. If you look on TimerTrac.com, you will find long/short timing models that trade between 10-80 times/year. If you use a long/short model, these "trades" are basically "round trip trades", which require two actual trades on every "signal change". For example, a new long signal would require that you: (1) cover your existing short position, and then (2) buy your new long position. At $10/trade, a model that trades 50 times a year (50 round trips) requires 100 actual trades (lots of work) and costs $1,000/year in trading fees. Whereas, a model that trades 12 times/year requires 24 trades/year and would cost $240/year at $10/trade.
As most of you know, the MIPS2 model trades about 8 times/year and the MIPS3 and MIPS4 models trade between 12-14 times/year. Since MIPS3 and MIPS4 are better models, we recommend that you use them even though they trade a little more often. Please remember that the trades/year are "averages" and could mean that in some years the MIPS3/4 models could trade 4-6 times/year and in other years they may trade 16-18 times/year.
What determines how many times/year a model trades is 90-100% dependent upon how long the market trends in that year last (other trades may come about from reversion-to-the-mean in overbought/oversold markets, etc.). The MIPS models were developed to follow "Intermediate-Term" trends (weeks/months); and not "Short-Term" trends (days) nor "Long-Term" trends (months/years).
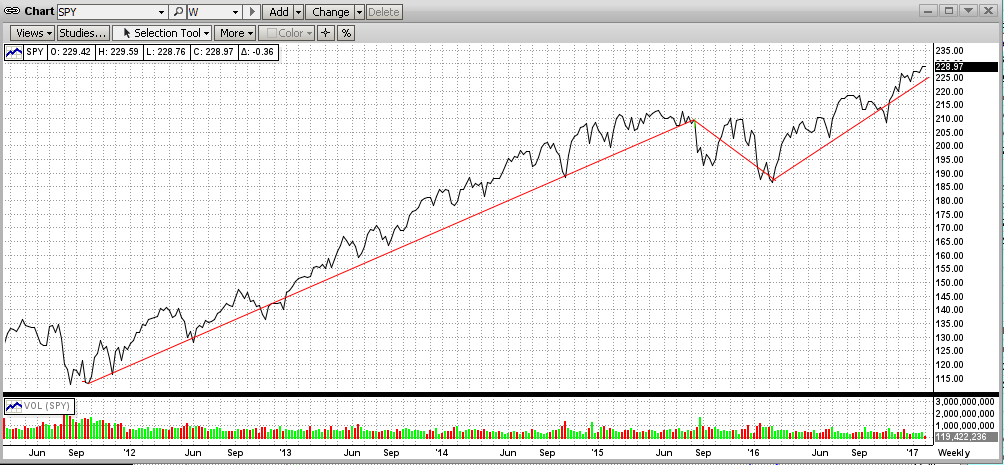
In the last 5-6 years, the market has trended up somewhat consistently. However, in the graph below, you will see that the market in 4Q'15 trended down. But, before and after 4Q'15, the SPY trended up in a relatively tight pattern. So, after 4Q'15, models that were "long" more often than "short" should have matched or beat SPY (especially with like 1.5x leverage on long signals).
Getting closer to home, we all know that MIPS4 has been Long since 07/12/2016 (135 days)!
- [MIPS3 did basically the same, but with a one-day cash position on 11/04/2016].
Incidentally, in the 14 years since 2003, MIPS3 has had 11 signals that lasted longer than 3 months (90 days), with the longest signal lasting one year (361 days). All 11 of these signals were winning signals (even a short signal in 2008). The average gain from these 11 signals was 9.90% each. [This would have been higher with 1.5x leverage, see the last graph.]
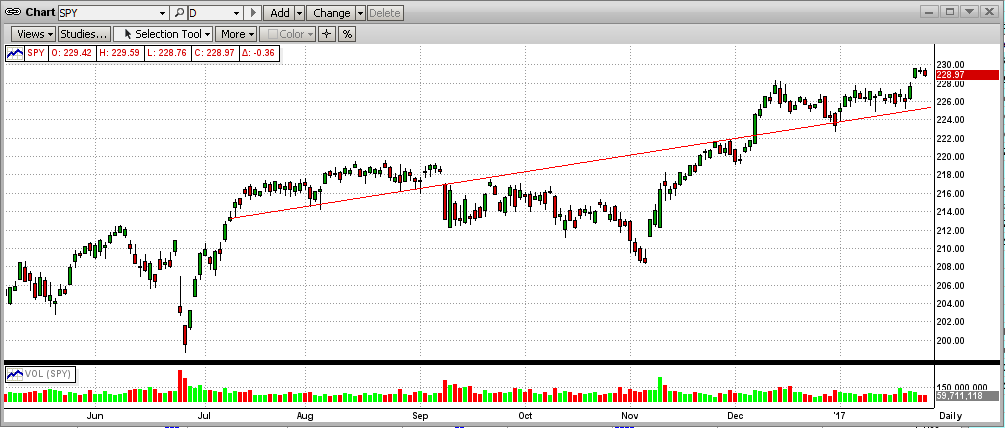
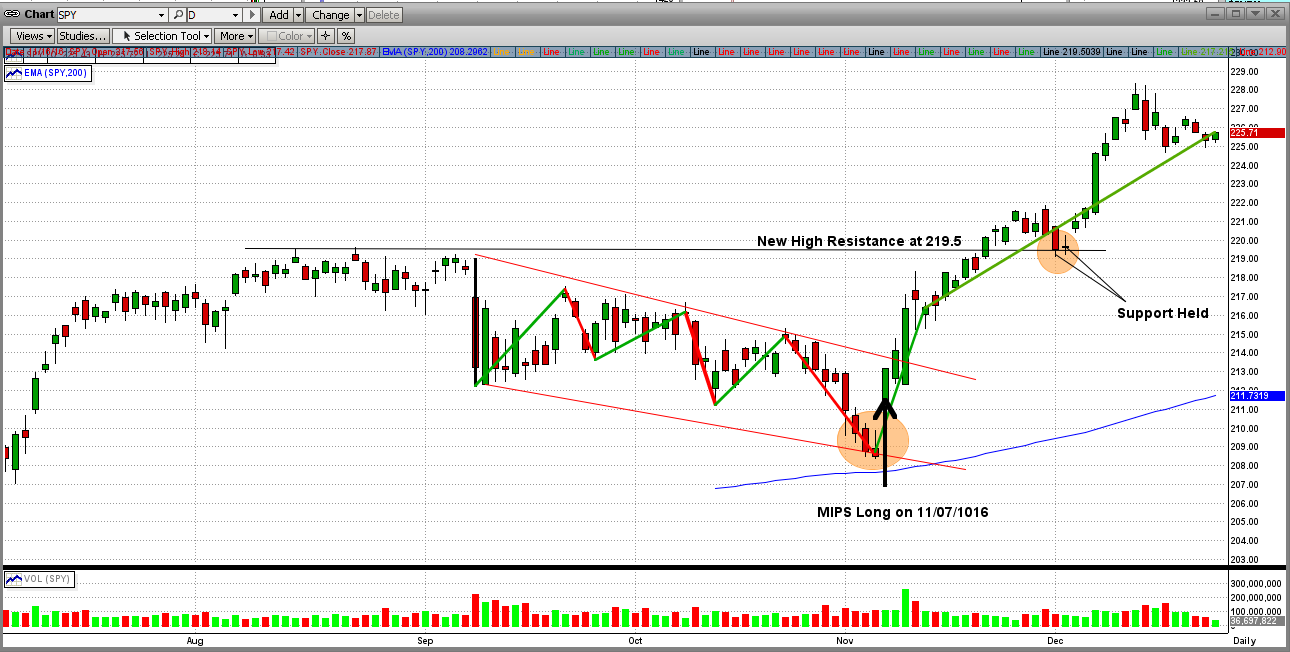
See the graph below to follow the trend of the SPY since 07/12/2016. As you can see, the SPY trend was up most of the time, except for a dip in early November. BTW, in a strong up market like this, it takes a bigger dip than that for MIPS to change direction. And, chasing ralatively small dips can lead to getting whipsawed. Remember, our Blaster Series algos in 1Q'16 greatly lessen the chance of the MIPS models from getting whipsawed !!!
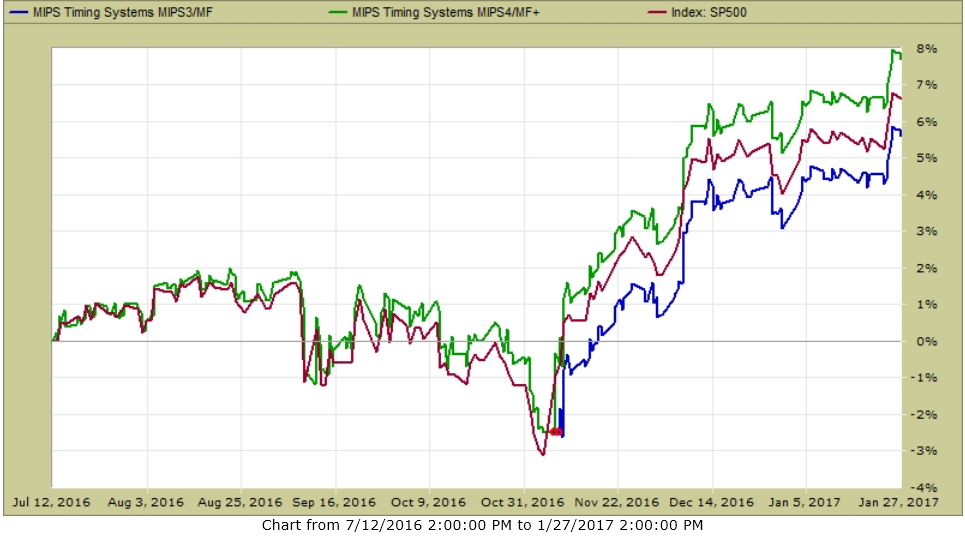
So, how did this 135-day long signal since 07/12/2016 perform. The graph below shows MIPS4 with a 7.9% gain and MIPS3 with a 5.8% gain, both trading SPY with no leverage.
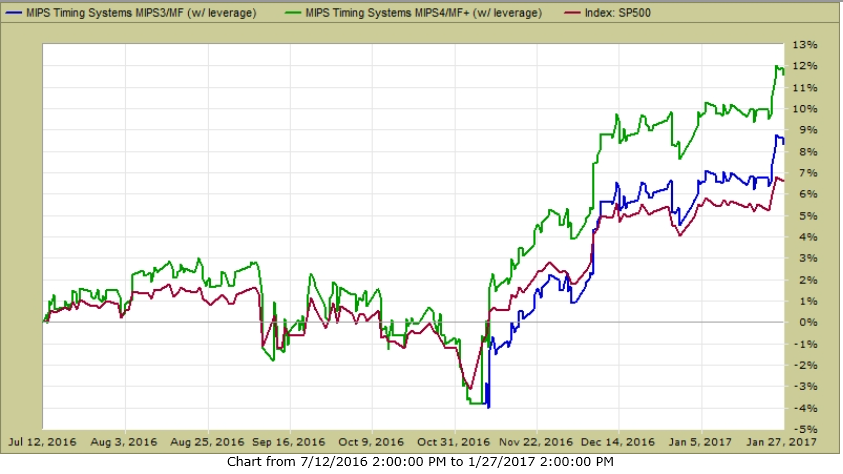
With 1.5x Leverage
The graph below from TimerTrac.com shows how MIPS3/4 would have performed trading SPY with 1.5x leverage on long signals and 1.0x leverage on short signals (MIPS4 +11.8%; MIPS3 +8.6%).
Paul Distefano, PhD
MIPS Timing Systems, LLC
Houston, TX
281-251-MIPS(6477)
www.mipstiming.com
Monday, December 26 2016
Santa Claus Rally, December Rally, Trump Rally... what difference does it make... a rally is a rally !!!
Traditionally the Santa Claus Rally in December is believed to result from:
(1) Mutual funds, etc., "dressing up" their portfolio by selling all of their losers and buying winning
stocks that have done well during the year. This way, all stocks in their year-end portfolios look
really good (show gains), even though the fund did not actually participate in these gains. Some
fund's year-end portfolio may show 90% of the stocks up 10-30% in 2016, when in actuality
the fund was actually up only 2-3% for the year. Sounds like "cheating" doesn't it? At its best,
this very misleading.
(2) In the last half of December, the pros have done their dirty deeds and have left on vacation
for the rest of the year. Usually, the market sentiment is high from the runup in the first half
of December. And then, in the last half, the "little guys" come in and push the market even
higher on relatively low volume.
(3) In 2016, all of the above have been aided by the Trump rally.
So, according to the above, December should finish with a nice gain (see graph below).
BTW:
- all MIPS models went long on 7/11/2016.
- MIPS4 was still long on 11/07/2016 (as was MIPS3, after it got called back to cash for a few days).
We MIPS members will wait for MIPS to tell use what to do next...
Stay tuned...
Paul Distefano, PhD
CEO / Founder
MIPS Timing Systems, Inc.
Houston, TX
281-251-MIPS(6477)
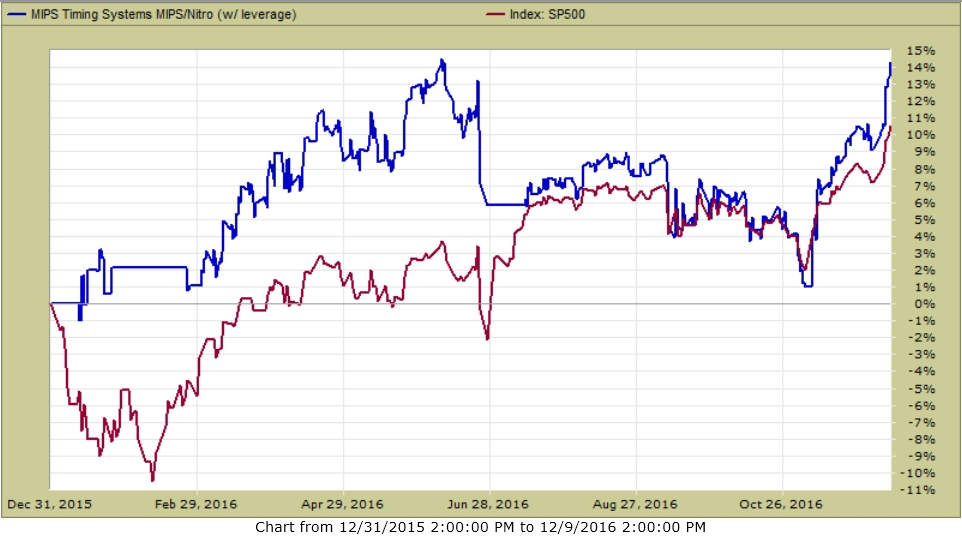
Sunday, December 11 2016
From the MIPS website at:
http://www.mipstiming.com/rias___nitro1
MIPS/Nitro up 14.3% thru 12/09/2016 (1.5x leverage long, 1.0x SH short)
Paul Distefano
--
--- Contact Info ---
Paul Distefano, PhD
CEO/Founder
MIPS Timing Systems, LLC
Houston, TX
281-251-MIPS(6477)

www.mipstiming.com
pdistefano@mipstiming.com
|


