The market pundits are citing things like the Trump rally has run its course and that February is NOT normally a good month in the stock market. As "proof" they point out that, in the last 40 years, in the "good months" between November-April (where they all go when they come back from "sell in May"), February has average gains of only 0.06% (yes, that's six 100ths of a percent). Furthermore, in the February's following presidential election years, the market has dropped an average of -1.85%.
So, what are the last few days in the market telling us from a technical standpoint.
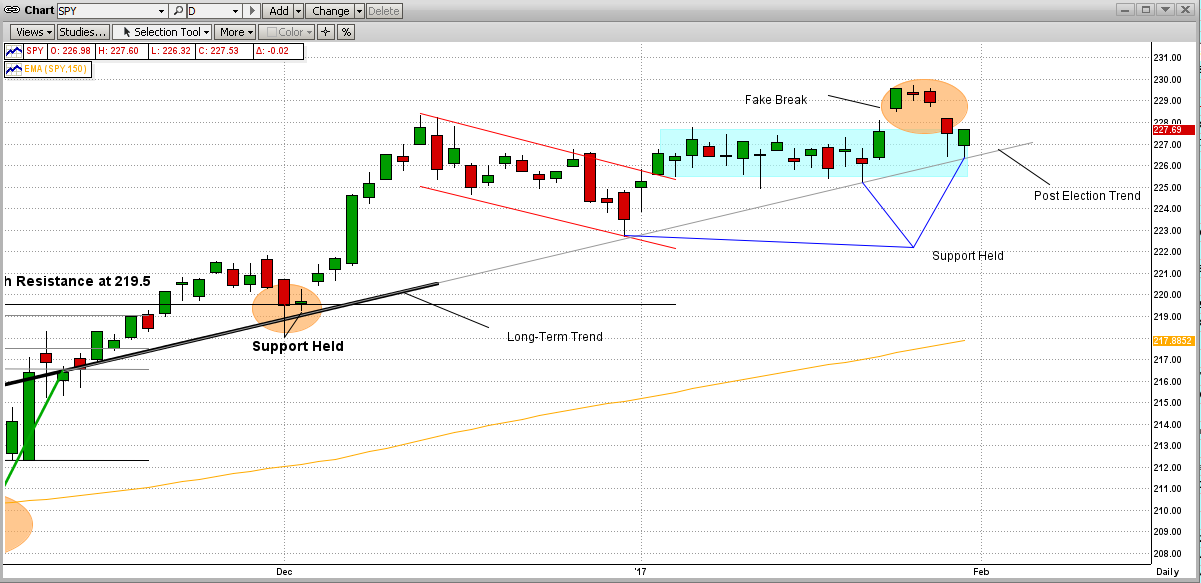
See the graph below:
1) the bold black trend line on the left is the "Long-Term Trend",
2) the light gray trend line extension is what I have called the Post Election Trend Line, but it really
is just a natural continuation of the long-term trend line.
3) the orange circle on the top right is a "fake break" to the upside,
4) the blue lines point out where the SPY has dipped to its trend line, hit it, and bounced back up
(in technical terms, the support level "held its ground" each time, which is bullish).
5) For our hard-core technical MIPS members, let us not ignore another bullish technical indicator.
Today (Tuesday) the SP500 "candlestick bar" formed a near-perfect "up hammer", by opening down
(-7 on SP500), falling another -7 point segment during the day (-14 total), and then bouncing back
up to close +12 points above its low-point (-2 for the day). PS - The graph below is for the SPY,
not the SP500; but of course, the similarity is there.
Of course, today's action is not why MIPS has stayed in a long position for so long (read previous blog for why that is). It is mainly because a good trend following model will rarely go short when the market is above its trend. But, good trend following models (like MIPS) will have algorithms that will take themselves short or to cash with a relatively big drop above the trend line [e.g., reversion-to-the-mean algorithms in overbought (or oversold) markets].
Overall, by following the trend, the MIPS models have done well in the recent market (see graph below).
- from TimerTrac.com
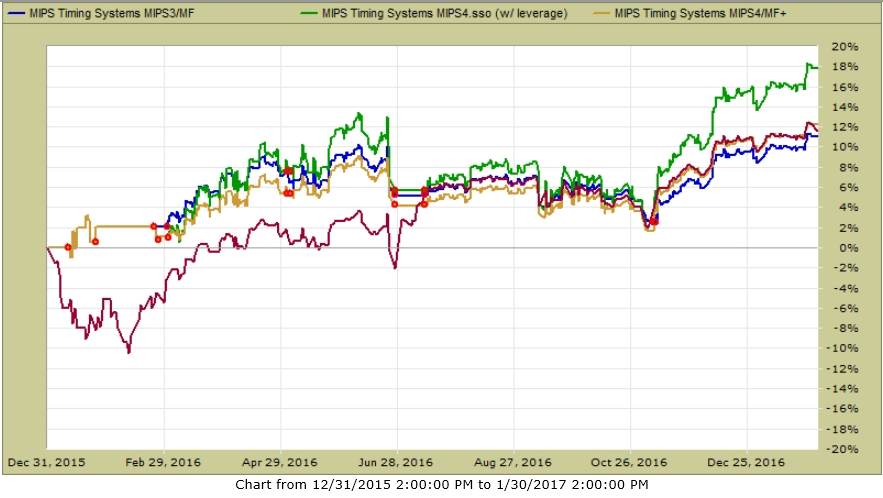
In the above, you can see the following results for the time period of Jan'16-Jan'17:
Red Line - S&P 500 = +11.9%
Blue Line - MIPS3 trading SPY 1.0x Long and 1.0x short = +11.1%
Gold Line - MIPS4 trading SPY 1.0x Long and 1.0x short = +12.2%
Green Line - MIPS4 trading SPY 15.x long and 1.0x short = +17.9% *
* note: 1.5 leverage on long positions
Stay tuned...
It appears that the market will continue to the upside, but let's wait for MIPS to provide us with more "good guidance" going forward !!!
Paul Distefano, PhD
President/CEO
MIPS Timing Systems, LLC
Houston
251-281-MIPS(6477)


