A money manager (RIA) customer of mine uses our MIPS models along with models from other developers to trade his various strategies. He recently mentioned to me that he received an email from one of his other model developers that sounded almost apologetic for being in a Long Signal for so long (not to mention that his users have done very well in the last 12 months).
That sounds like MIPS. Our current "Long Signal" from 7/12/2016 now has the longest signal life in MIPS' 11-year history. As most of you know, I personally use a little leverage (but less than 1.5x), in order to "beat the market" some in extended uptrend periods (but almost never any leverage on short signals). That keeps me interested instead of getting bored.
BTW - With ETFs, you can effectively generate 1.5x leverage by buying 50% of the 2x SSO and 50% of the 1x SPY. Or, you can attain 1.25x leverage with 25% SSO and 75% SPY, and so forth. You trade 0.5x when you buy SPY with 50% of your investment money and leave the rest in cash (but ready to trade with on any day). With mutual funds, Rydex offers at least one 1.5x S&P 500 fund.
We will show you how MIPS3 would have behaved with these various trading profiles. The graphs below are MIPS3 trading SPY using verified signal data from TimerTrac.com. Let's look at the 10+ year period between 2007 and 2017 YTD in three views, namely:
I.) for the period 2007-2017 YTD (up and down markets),
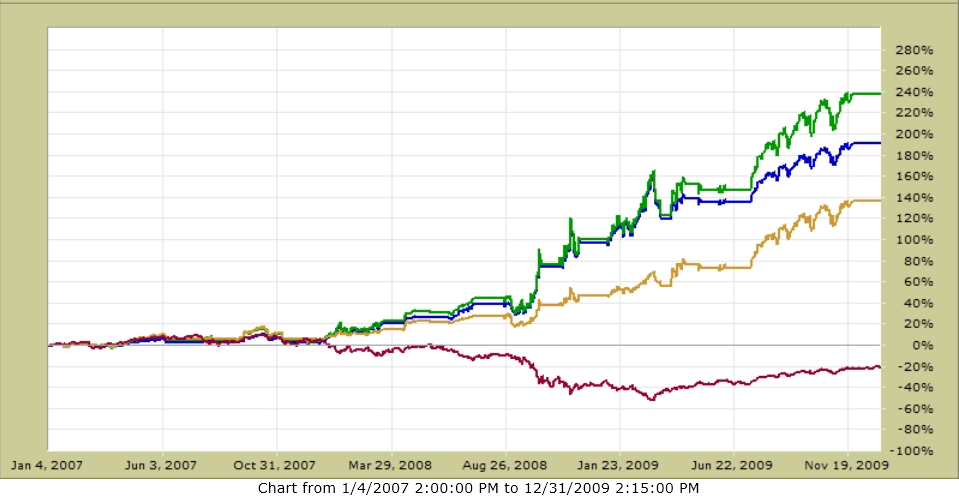
II.) for the period 2007-2009 (mostly down market), and
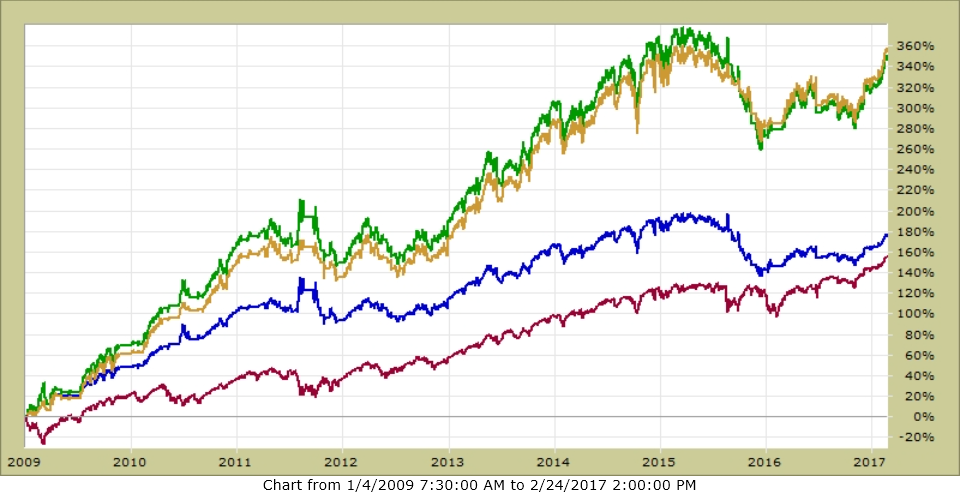
III.) for the period 2009-2016 YTD (mostly up market).
The 3 lines on each graph below are with MIPS:
Green Line - Trading SPY with 1.5x Long and 1.0x Short - Aggressive
Gold Line - Trading SPY with 1.5x Long and 0.5x Short - Moderate
Blue Line - Trading SPY with 1.0x Long and 1.0x Short - Conservative
I. - For the period 2007-2017 ytd (up and down markets)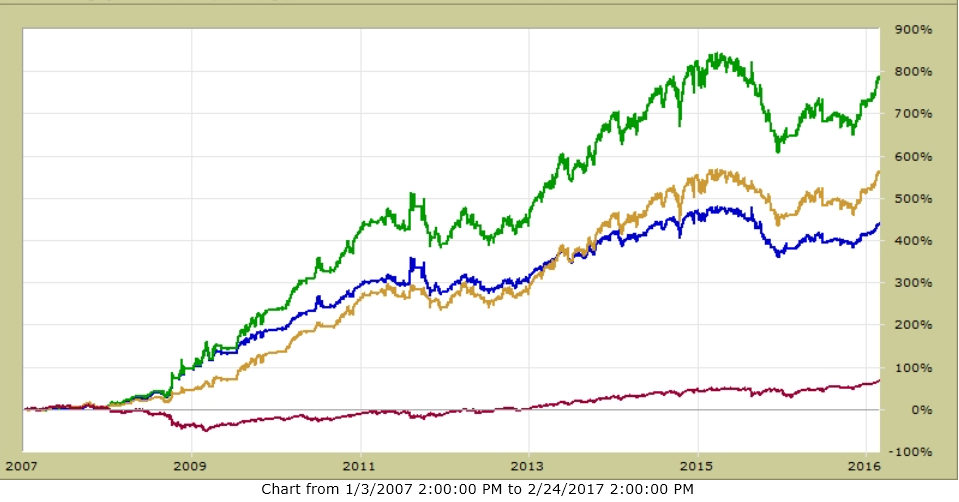
II - For the period 2007-2009 (mostly down market)
III - For the period 2009-2016 ytd (mostly up market)
Note: The above is from our original MIPS3 model which has verified signals on TimerTrac.com going back to Nov 4, 2005. MIPS3 is still a very good model (ranked #1 on TimerTrac.com since 2006). MIPS4 is a better model, but it only has verified signals since Sept 2013.
No one can tell you which of these is best for you, it depends upon your risk/reward temperament; that is, can you take higher risk (bigger drawdowns) for higher rewards; or would rather minimize your risk and be willing to give up some performance.
Most good investors get a little more aggressive in up markets (to a point of the market being way too "overbought") and cut back on risk in shakier markets (like sideways waffling). Remember, you do not have to marry any of the above strategies, but do not switch them every time the market makes a little move up or down ("wiggles").
Let's enjoy this ride while it lasts. Some time this year I will most likely be explaining to you why MIPS is trading so often. That's all part of the success.
Stay tuned...
Paul Distefano, PhD
President/CEO
MIPS Timing Systems, LLC
Houston
281-251-MIPS(6477)


