The MIPS3, MIPS4, and MIPS/Nitro models issued two “signal changes” (trades) in just three days last week, after being in a Long signal position for over 15 months. Lots of MIPS members have asked us for an explanation.
The MIPS models are very complex models that use more of our own proprietary mathematical algorithms (applied math, pattern recognition, artificial intelligence, etc.) than simple tactical indicators. In total, however, “votes” from over 150+ technical indicators and market behavior algorithms decide in which direction “the market” is moving (for us, “the market” is the S&P 500 Index, or SPY).
OFFENSIVE SIGNALS
Please understand that we run the MIPS models each and every day from scratch. When a MIPS model indicates, with a strong degree of confidence, that the direction of the market has changed, it will issue a “signal change” and this goes out in an email to MIPS members (and is updated on the MIPS website immediately thereafter). Of course, if the model does not identify a new change in the market direction with high confidence that day, it will keep the same position (Long, Short, or Cash). And, this can go on as long as the market keeps growing (or declining) as in the last 15+ months. In all of the above cases, we call these signals “Offensive Signals”, and over 80-90% of our signals are Offensive (see Defensive Signals below).
Now, things get interesting (and pseudo confidential for all recipients). To understand this Blog from here on, please take a second to “study” the table below (from the Home page on our website).
DEFENSIVE SIGNALS
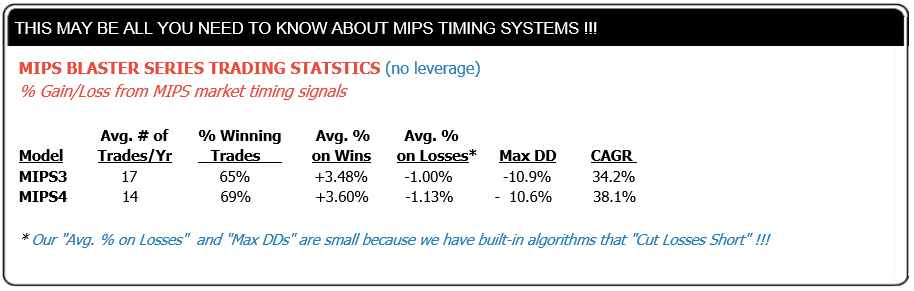
MIPS3 has been tracked and its signals have been verified since Nov 2005. MIPS4 is a more recent model and is slightly better than MIPS3. So, let’s concentrate on MIPS4 for this blog. BTW, the results in the table above result from the MIPS models with the Blaster Series algorithms.
What is obvious in the above table is that, on average, the MIPS4 models traded a little over one time per month, the trades were winners almost 70% of the time, the CAGR was almost 40%, and the maximum drawdown was just a little over -10%.
The stats above are all great, but there is “one thing” that all MIPS members should be aware of and be happy about. I am sorry to say that we have been publishing this chart for years, and we have gotten very few questions about one important entity in it. If one digs a little deeper, they would realize that this “one thing” that makes such a huge improvement in performance is that the average GAIN on winning trades is +3.5%, but the average LOSS on losing trades is only -1.1%. That is pretty good proof that a timing model that is programmed to automatically “cut its losses short” is working with darn near perfection.
This is NOT a Coincidence!!!
The much lower average LOSS above does not “just happen”, but rather it results from highly effective “stops” that we designed and built into the MIPS models. The MIPS very low average LOSS is only about 1/3 of the size of its average GAIN. If we had done nothing in the MIPS models to cut LOSSES, instead of the average loss being -1.1% as it is now, it is highly likely that the average loss would be close to the opposite of the average gain (or about -3.5%). The reason that we defined our “stops” with quotation marks is that our “stops” are NOT derived simply from a designated loss from the last actual initial trade or from a trailing high. Our "stops" are designed so that, as a MIPS model “learns” about its most recent bad performance (e.g., it losses 3-4 days in a row, or it losses 4 days out of 5, and many more), other algorithms take over and either reverse the current signal or takes the model to a Cash position.
We have many of these proprietary “stops” built into all MIPS models, and they can either take a new Long or Short signal that is not working well to Cash, or they can take a Cash signal that is being left behind in performance to a new Long or Short position !!!
The MIPS models are more likely to issue both offensive and defensive signals quickly in relatively flat, horizontal market patterns than in markets with a strong up or down trend with low volatility; but it can happen at any time. The Defensive signal algorithms In our MIPS models work exceptionally well, and this is one reason why our average losses are so low.
LAST WEEK and 2018 YTD
The MIPS3, MIPS4, MIPS/Nitro models that had been long for over 15 months issued two trade signals last week (a Cash signal on 4/3/18 and a Long signal on 4/5/18). Since 4/2/18, all of the MIPS models are up approximately +1.5% as of the close on 4/10/18; but the MIPS models are down -4.6% for the year.
Good Trading !!!
Paul Distefano, PhD
CEO / Founder
MIPS Timing Systems, LLC
Houston, TX
281-251-MIPS(6477)


