What a surprise !!!
After an almost straight up market since the presidential election in Nov’16, the market kind of “exploded” in 1Q’18.
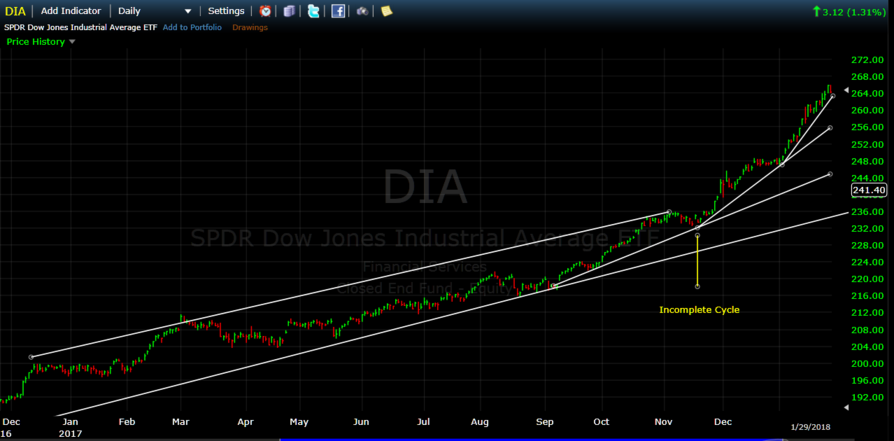
However, it should not have been such a big surprise if one had only paid attention to the market performance several months before the explosion. For example, it can be seen in the graph immediately below that, instead of the market completing its normal up-down cycle in the channel below in November 2017, it "blasted off" like a cannon ball until all indices were greatly overbought by the end of January 2018.
2nd Graph
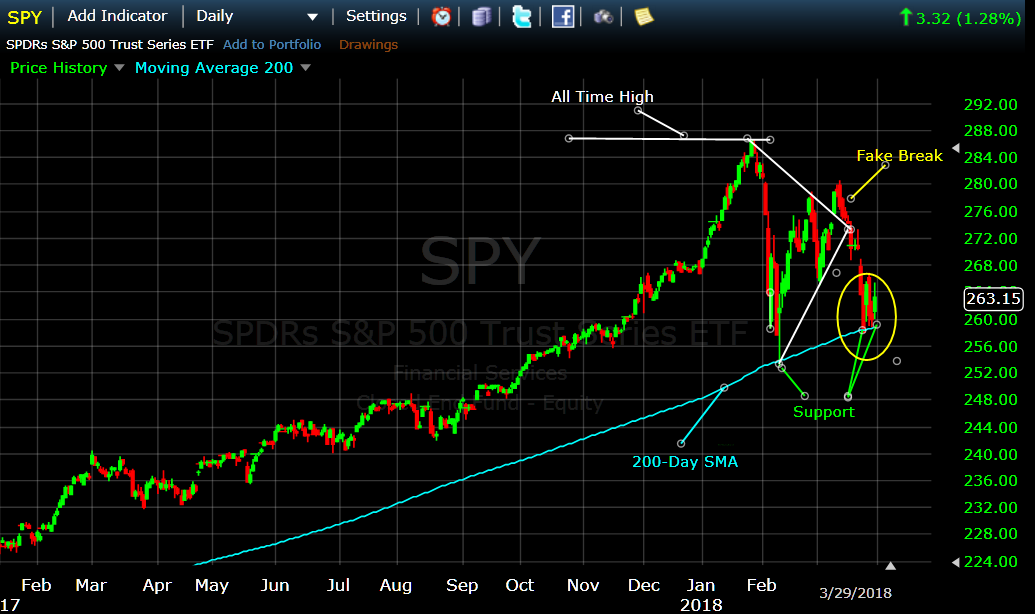
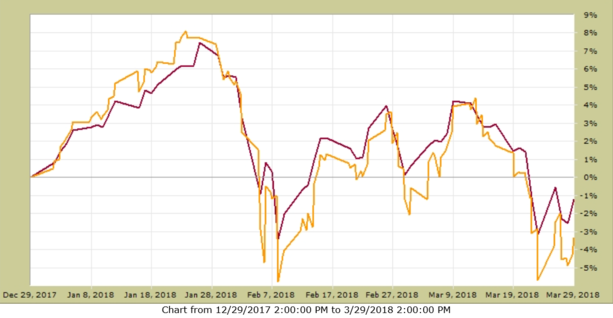
In an overbought situation like this, it usually does not take a big catalyst to start the market spiraling down. In this case, it was things like Trump’s tariffs, talk of trade wars, uncertainty with North Korea, investigation of Russian collusion, etc. For whatever reason, it happened and the results were not pretty. Since there are no free lunches in the stock market, after the big 4th quarter 2017 run up it seems like all professional traders decided to dump their winners and “take profits” on the first bad news in 2018. Of course, this action indeed prompted the market to explode (see graph below). If this continues, things could really get ugly.
On the other hand, it is now at least some form of comfort that the market (SPY) tested its Support Level (200-Day SMA) five trading days in a row, and it bounce back up on Thursday, March 29th (see the very last 5 bars at the “Support Level” on the right-hand side in the chart below).
It seems that the SPY got high enough above its trend line that “reversion-to-the-mean” mentality took over and drove the market back down to its 200-day SMA support level. Hopefully (and most likely) the market will continue up after testing the support level and having the bulls win (i.e., the market may have drained the overbought swamp).
Graph #3
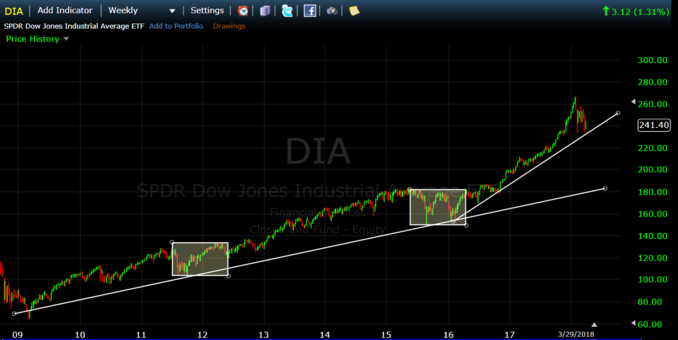
If we step back and look at the steep, steady growth in the market since 2009 (graph below), and if we compare the last 2 years’ performance to the prior 8-year uptrend, it is easy to see why the MIPS models have traded only a few times since the beginning of 2016. In most cases, models that chased every “dip” in the market over the last 10 years ended up getting whipsawed at least a few times along the way. More trades DO NOT automatically lead to better performance as many people think (and in most cases the opposite is true).
BTW, when one looks at the “explosion” in February 2018 from a long-term perspective as in the graph below, it can be seen that relative to the prior growth in the market, the drawdown in 1Q’18 does not seem so “damaging” after all. From a mathematical standpoint, the MIPS models have a form of “relativity” built in. This means that algorithms that could signal a “sell or short” with a dip of 3-4% in a flat or slow growth market, might ignore a dip of 8-9% in a very high growth market (as in the last 2 years).
First Quarter of 2018
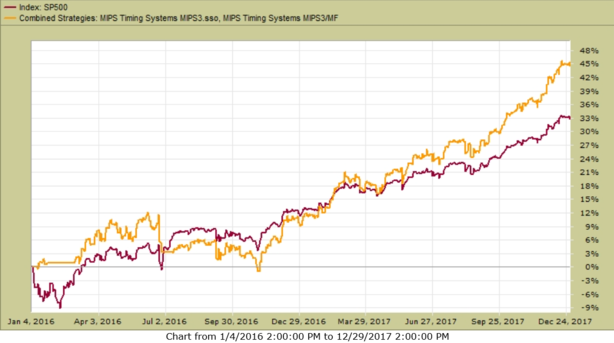
Even with the great degree of volatility in the market in 1Q’18 and the big drop in the SPY from its highs, the MIPS3 (and MIPS4) models performed exceptionally well in 2007-2017, and only lost back -3.5% in 1Q'18.
MIPS3 Model
Trading SPY with 1.5x Leverage Long and 0.5x Short
The MIPS3 model gained +45% in 2016-2017 and it only lost back -3.5% in 1Q’18
2016-2017
1Q'18
PS – Lots of analyzing (and guessing) going on here, and that is why we use MIPS to tell us what to do with a MUCH GREATER degree of accuracy.
Good Trading…
Paul Distefano, PhD
CEO / Founder
MIPS Timing Systems, LLC
Houston, TX
281-251-MIPS(6477)


