Sunday, May 27 2012
Many people ask us how can they beat the SPY in up markets when they are trading the SPY itself. That is, how in the heck do you beat the performance of the index fund that you are trading? Needless to say, you absolutely cannot do this with a buy and hold strategy.
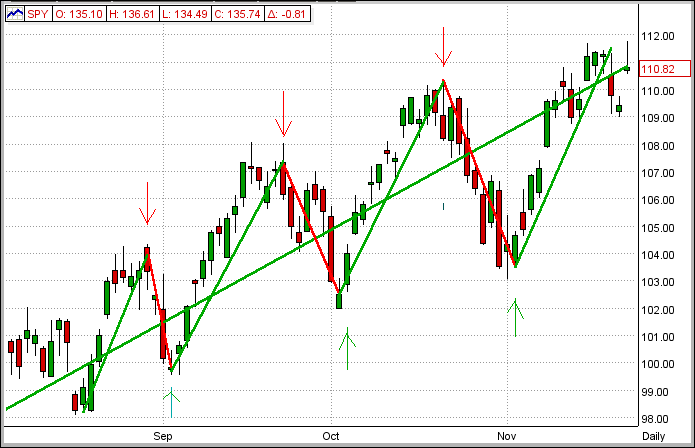
Let's assume that you are using a timing system that tracks the SPY to determine up-trends and down-trends, and that this timing system is deadly accurate. Then if you are trading SPY, the only way that this system can beat the SPY in up markets is by being short when, and if, this up market contains some intermediate downdrafts during its ascent. See the graph immediately below.
Now, if the market ascent has only small or relatively few downdrafts (as happens in many slow-growing up markets), the model will keep you long and you will simply follow the SPY upwards. So, if the SPY goes up 20% over some period of time, your money will also go up 20% in this period, but your performance will be equal to that of the SPY. In other words, even though you are making money in this market, your performance will be basically the same as that of the SPY.
[PS - This is not usually the case with fast-growing up markets since there is almost always enough volatility in these markets for MIPS to take advantage of some of its larger, inevitable downdrafts by being short.]
Of course, in down markets we don't have this problem because, when our timing model gets us into short positions in down markets, we not only make money, but our performance ratchets up as the market goes down. So, in a similar example as above, if the SPY goes down 20% in a certain period of time, since our timing model will have us short in this time period, our performance will be +20%. The net effect, of course, is that our performance would have been +20% when the SPY was -20%.
Ok, got it. But, the initial question has still not been answered.
"How Can We Beat the SPY in Up Markets"?
Independent of whether the market is going up or down (i.e., the SPY is going up or down), the simplest way to beat the SPY is to trade index funds that:
(a) correlate well with the SPY (i.e., changes direction at the same time), and
(b) have higher volatility than the SPY (goes up and down more than the SPY).
Although there are very many ETF and mutual fund indices that fit this criteria, we believe that the two best ETF candidates for this are the Russell 2000 (IWM) and the NASDAQ (QQQ).
Trading IWM and QQQ to Beat the SPY in Up Markets
- the following is a detailed analysis of this suggestion.
FIRST (the period of 2003-10)
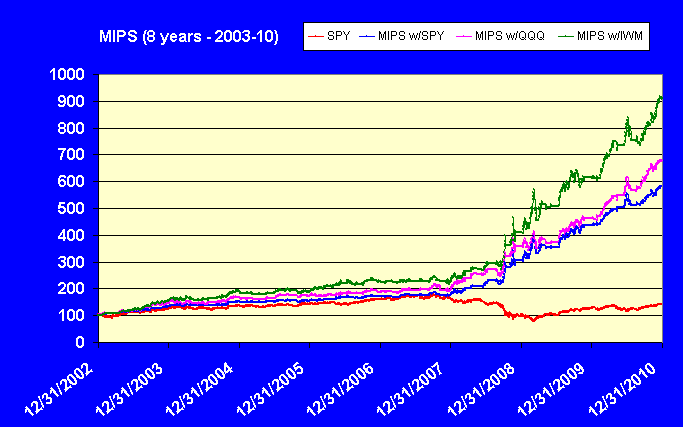
On our website (www.mipstiming.com), if you click the "Performance" tab on the main menu on our homepage, and then click the "Study VI" button on the top left of the Performance page, you will see the MIPS3/MF performance from trading the SPY, QQQ, and IWM relative to buy/hold SPY in the 8-year-period of 2003-10. To save time and effort, a copy of that page is shown immediately below.
From the table/graph below, you can see that:
1) trading the SPY with MIPS3/MF signals soundly beats buy/hold SPY over the entire time period
(+481% vs +43%),
2) trading the QQQ (+574%) and the IWM (+808%) with MIPS3 signals did much better than just trading the
SPY with MIPS3 signals.
As a consequence of this, I usually trade SPY, QQQ, IWM using MIPS3/MF signals with a mix of 1/3 of each or
1/2 SPY, 1/4 QQQ, 1/4 IWM
Study VI. 2003-10 (SPY/QQQ/IWM)
· MIPS3/MF Model; Buy/Short
Buy/Hld Buy/Sht Buy/Sht Buy/Sht
SPY SPY QQQ IWM
43% 481% 574% 808%
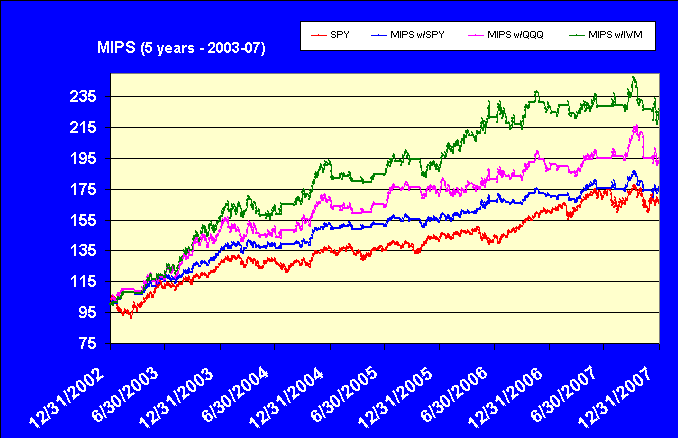
SECOND (the period of 2003-07)
To be more illustrative, we have included below an "expanded" view of the performance of MIPS3/MF trading
SPY, QQQ, IWM during the "slow-growing" up market in 2003-07
- from this graph, you can see the importance of trading ETFs other than SPY in slow up markets
SPY MIPS3 MIPS3 MIPS3
Buy/Hld w/SPY w/QQQ w/IWM
65% 75% 95% 125%
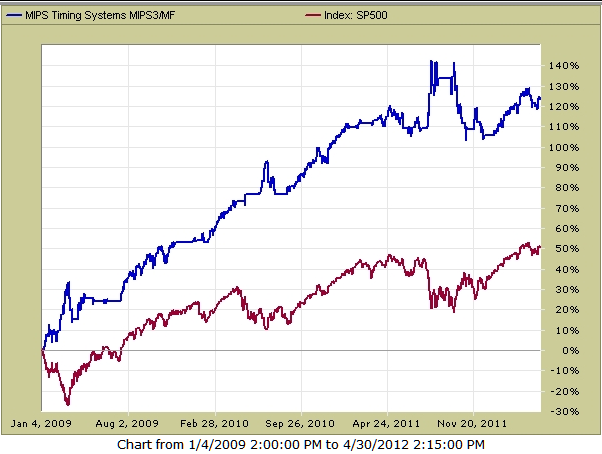
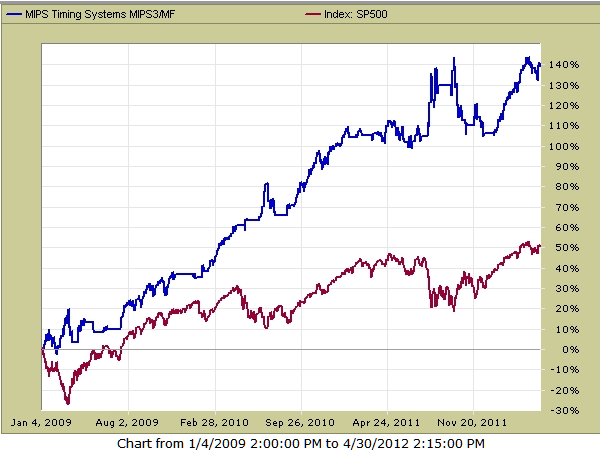
THIRD (the period of 2009-12 YTD)
The performance of MIPS3/MF trading SPY, QQQ, IWM in the very fast-growing up market in the time frame from
2009-2012 YTD is shown below (graphs from TimerTrac.com).
SPY MIPS3 MIPS3 MIPS3
Buy/Hld w/SPY w/QQQ w/IWM
50% 125% 140% 165%
Graphs for each of the above follow:
SPY (+50%) - MIPS3/MF Trading SPY (+140%)
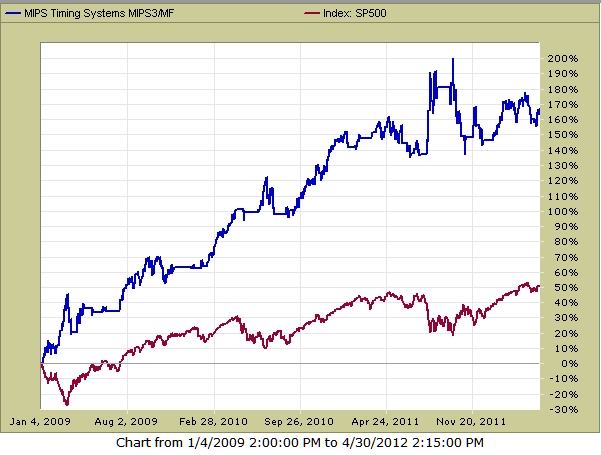
SPY (+50%) - MIPS3/MF Trading QQQ (+140%)
SPY (+50%) - MIPS3/MF Trading IWM (+165%)
Hope this helps ...
Paul Distefano
Founder/CEO
MIPS Timing Systems, LLC
Houston, TX
281-251-MIPS(6477)
Saturday, March 24 2012
MIPS Members:
The stock market is now in relatively new, uncharted waters (as least for newcomers). Said another way, the SPY has not been in the “territory” above $145/share since 2008.
So, where do we go from here and how do we get there ?
Intermediate-Term Cycles
We all know that MIPS3/MF identifies intermediate-term cycles (weekly/monthly cycles) in the market, and not short-term cycles (daily cycles) nor long-term cycles (annual cycles). For example, in graph #1 below, the black line would be indicative of a very long-term cycle (5-year trend), and the red lines would be indicative of intermediate-term cycles (monthly/quarterly trends). Of course, any timing model that could accurately identify intermediate cycles, and trade the resulting trends long and short, would produce much better results than just “riding the long-term wave”. This is what MIPS2/LF and MIPS3/MF do, and they do it well. And, these are he models that we follow. [BTW – MIPS1/VLF tracks long-term (annual) cycles and trades an average of only 1 time per year.]
BUT, IS THERE ANYTHING THAT WE CAN LEARN FROM LONG-TERM CYCLES. The answer is yes, so lets go to graphs #2/3 below to see what we can learn.
Graph #1
Graphs #2/3 – Long-Term Cycles
Everyone knows (or should know) that over the last 50 years, the market has a long history of repeating the same pattern (or cycle) over-and over. This cycle goes up for roughly 4-6 years and then drops 30-50% over the next 1-2 years. For simplicity, let’s just say that a very frequent stock market cycle is up for 5 years and then down for 2 years.
You can see these repetitive cycles in graph #2 below for the 18-year period between 1965-1983 and in graph #3 below for the period 1995-2012. These are the type of market movements where the fat cats and the hedge funds make most their money (NOT in up markets only), and where the little guys get clobbered.
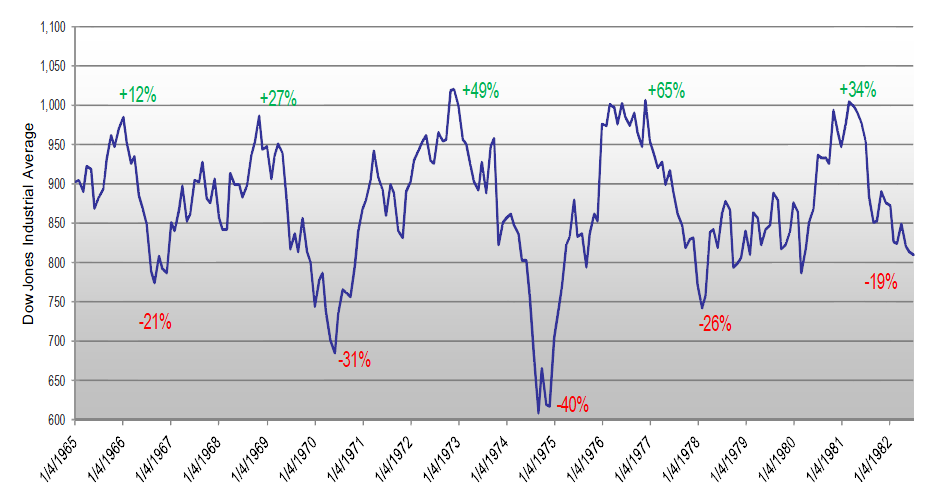
Graph #2
This graph shows the Dow from 1965-1983. In this 18-year period, buy-and-hope investors would have been down about 15% (really much more, because they could have basically doubled their money by being invested in 4% CDs or US Gov’t bonds in those 18 years) !!! Without some type of market timing, how could anyone have made money in this 18-year market ???
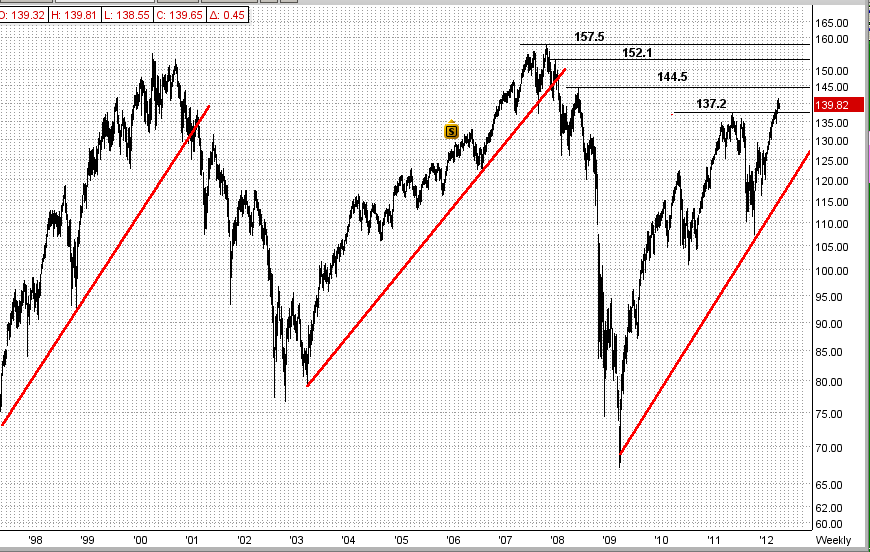
Graph #3
The graph below is for the period 1995-2012. In this graph, the red lines show the long-term trend lines. Even though MIPS3/MF trades the intermediate term cycles within the long-term cycles, by observing the long-term cycles we can see that:
(a) long-term trends are not random,
(b) long-term trends seem to be very similar in nature,
(c) there are very good “shorting” opportunities, even in up-trending markets, and
(d) once started, they go on for years (again, like up for 5 years and down for 2 years).
The first long-term cycle in graph #3 ran for 5 years (from 1995-1999) and the second one also ran for 5 years (2003-2007); but the third (current) long-term cycle has been going up for only 3 years (2009-2011). Does this mean that our current 3-year “bull” has two more years to run? Maybe, or even likely.
And, the entire world is anxious to see if the Dow will break its all-time high of 14,164 or if the SPY will break its all-time high of $157.5/share made in 2007 (which is only 11.5% higher than Friday’s close). To do so, the SPY would have to break major resistance levels at 144.5 and 152.1 to get there (see these resistance levels in graph 3). My guess is that the big guys would like to see the SPY break its all-time high (and they can make it happen) and the little guys are just now likely to start moving money from fixed income assets into equities. Both (or maybe just either) of these would push the market higher. This is NOT a prediction, just an observation.
And remember, if the above does not happen, the market will most likely drop and drop fast. Either way, MIPS will detect the trend. So, let’s be patient and wait for MIPS to tell us what to do.
Graph #3
Thursday, March 15 2012
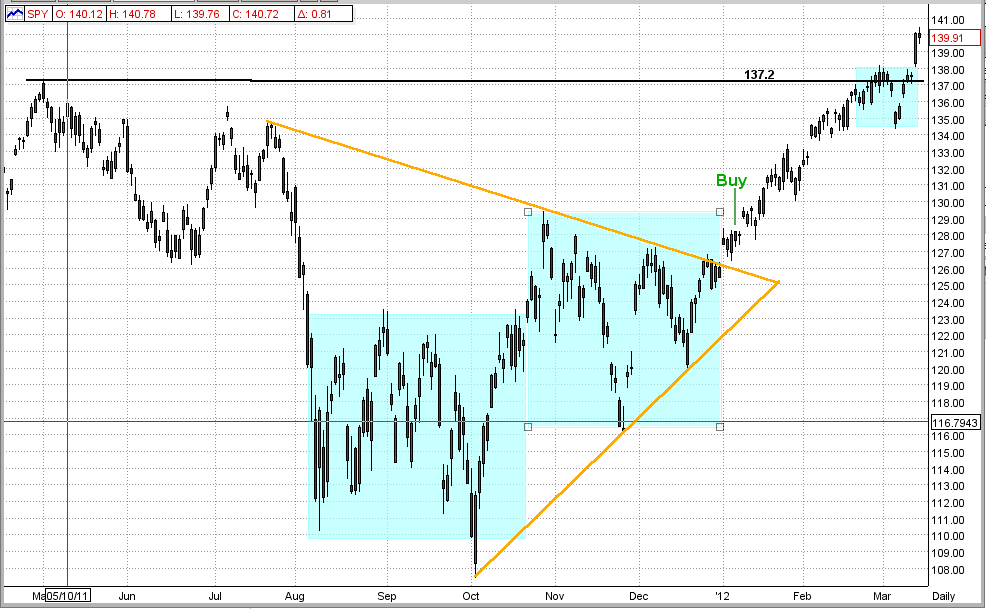
1st Graph (daily data)
FINALLY, the SPY definitively broke its upside resistance at $137.2, but only after about 8-10 failed tries. (See the 1st graph below). The Buyers finally "yanked" the SPY away from the Sellers in this tug-of-war and we are now at $139.91, and that is a good position to be in. So, what happens from here (see 2nd Graph)
Graph #1 - SPY Breaks $137.2 Resistance
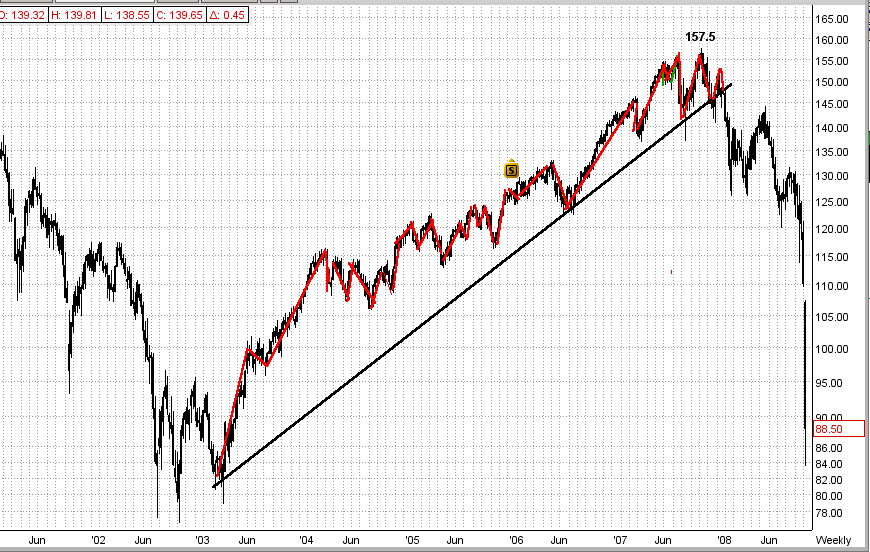
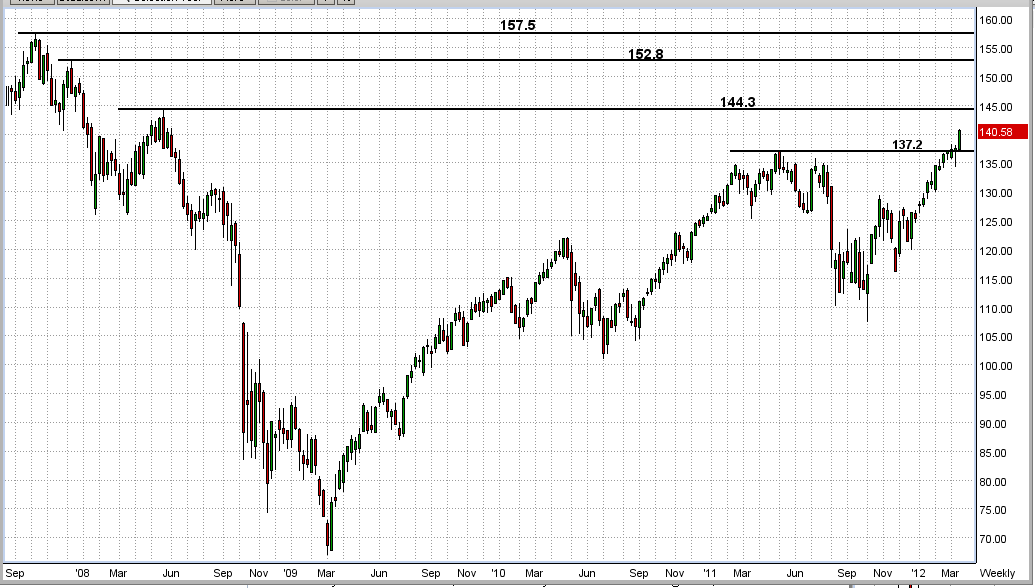
2nd Graph (weekly data)
This is simply a graphic view of the next three upcoming "resistance levels" that we will have to contend with, at 144.3 and 152.8 and "The Big One" at 157.5. The latter is "The Big One" because it was the HIGH for 2007. Does the market have enough "steam" to reach or surpass this "pinnacle" point at $157.5?
Wouldn't that be nice? None of us knows the answer to that, but we do have MIPS to guide us along the way. Stay tuned...
2nd Graph - Future Resistance Levels
Wednesday, March 07 2012
So far this week the market did what the market usually does at a "hard" resistance level; that is, it hit/slightly broke its "hard" upside resistance line and then bounced back. This is not one bit surprising. Many times it takes 4-5 tries to break a resistance level, and if it fails to break, the market then makes a substantial move in the opposite direction (5-10%). This is kind of like a tug-of-war between buyers and sellers, where each side makes attempts to drag the other side "across the line". After several tries, the losers start giving up as their efforts are thwarted and they understand the strength of the other side. Then, their will to resist disappears and the other side virtually yanks them across the line.
On Tuesday, the S&P 500 dropped around 20 points after 7 attempts in the last 2 weeks to break or hold above its resistance line. There were several reasons from the "pundits" about why the market dropped, but my guess is that they were all guesses. Most likely, it had nothing to do with Greece or China because there was really nothing new from either of them. We believe the market dropped because some big guys decided to take profits, and a ton of little guys followed them (right or wrong). Most likely, this was not a one-day reversal and it does NOT mean that the markets upside run is over. But, if the SPY does not retaliate with another assault on its $137.2 resistance level soon, this could signal a reversal of the current uptrend.
Remember, MIPS is looking for mid-term trend changes (up or down), and does not respond to 1-3 day changes. Thus, MIPS is trying to identify trend direction, NOT predict it. Usually timing systems that respond to 1-3 day changes are fast-trading systems (100+ trades/year), and they must attempt to "predict" or "forecast" market direction because they do not have enough time between trades to "analyze" much of anything.
So, let's wait a few days and MIPS will tell us what to do next.
Friday, March 02 2012
The SPY closed at $136.63 on Thursday...
The current upside resistance is at $137.2, less than 1/2 of 1% above this close ( see graph below)
- there is a good chance that the SPY will break this resistance level to the upside on Friday
- since we are still long, let's hope so
- if that happens, we could have smooth sailing because the next upside resistance is about 6.6% higher !!!
Of course, the market is not always that accommodating. So, if the SPY doesn't break up (or breaks up and falls back quickly), MIPS will get us out.

Sunday, October 16 2011
There are lots of "experts" that suggest that the market has established a new, long-term up trend. On a very short-term basis (days), they are correct.
MIPS is looking for long-term trends (weeks/months). See the graph below. MIPS is looking for trends that develop after the market breaks out of a trading range (as in 3Q'09), but NOT the short-term swing trends within the trading range.
 So, where is the market at this time
. The graph below shows that:
1) The SPY broke its 200-day EMA and the neckline of a head-and-shoulders top on 8/2/11
2) The SPY has been in a volitile "trading range" for 10 weeks (2-1/2 months)
3) The SPY is at another "critical point" at the upper end of its trading range; AND it is between
its 100-day EMA and its 200-day EMA.
4) Many investors see this as positive because of the short-term up trend; but "channel traders"
will see it at the top of its trading range and will sell/short SPY at the top of its trading range.
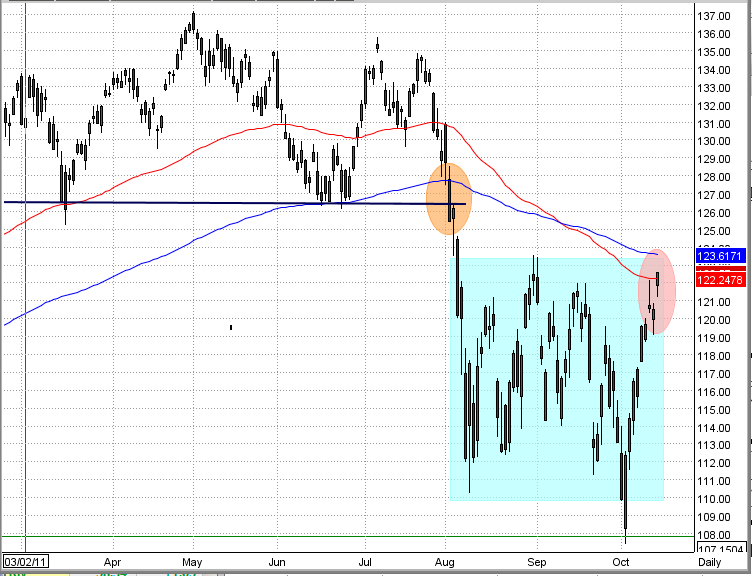 What does the past tell us
. Look at the chart below from 2007.
1) You should see the similarity between 2007 and today.
2) In 2007, the SPY broke the neckline of its head-and-shoulders top and 200-day EMA, and went into
a 2-1/2 month "trading range" (sound familar?).
3) After a strong "bounce back" that would suggest a new up trend (like today), the SPY truned around
at the top of this trading range, broke through the bottom of the trading range, and continued down
for 18 months, resulting in a 55% drop from the Oct'07 top.

The majority of the commercially available market timing systems have been through hell with this trading range (getting whipsawed) and MIPS has had some problems itself. [Of course, there are some high-frequency trading models (100 trades/year) that may have "caught" the top of some of these waves and done well, but they are in the minority.]
The market will eventually break out of this trading range (like it always does), and MIPS will tell us what to do. Over time, MIPS performs as well or better that most other timing system, most of the time with 1/5th as many trades.
Sunday, August 21 2011
Please Learn This:
- the result from shorting the market seems like "magic", but it is not!
- but, if you don't know what you are doing, you could lose big
1) Let's take the SPY from 2000 - 2007
- the SPY went from 150 (2000) to 75 (2003) back to 150 (2007)
2) With a buy/hold strategy, you would have been down 50% in 2003, and back to "even" in 2007. [BTW, you would not really be close to "even" because you would have been up 50% in 7 years with a 6% corp bond, like GE.]
3) If you used a buy/short strategy with a "perfect" system, you would have made 50% on your money in 2003 by being short
- then, when you went from short to long in 2003, you would have would now own three times as many shares of SPY (1.5 times your original money, buying at 1/2 the price)
- now, when the SPY went back to 150 (from 75 to 150), using a buy/short strategy, you would have had 3 times the money that you started with.
Of course, no one has a "perfect" system, but MIPS is a very good one.
- from 12/31/2007 to 8/19/2011, the SPY is down 23%, and MIPS is up 278% (see graph below for MIPS performance from TimerTrac.com) - so starting with $100,000, you would have $77,000 with buy/hold vs $378,000 with MIPS buy/short !!!!!
And, YTD in 2011, the SPY is down 11% and MIPS is up 18% (a 29% difference)...

|


