MIPS Members:
The stock market is now in relatively new, uncharted waters (as least for newcomers). Said another way, the SPY has not been in the “territory” above $145/share since 2008.
So, where do we go from here and how do we get there ?
Intermediate-Term Cycles
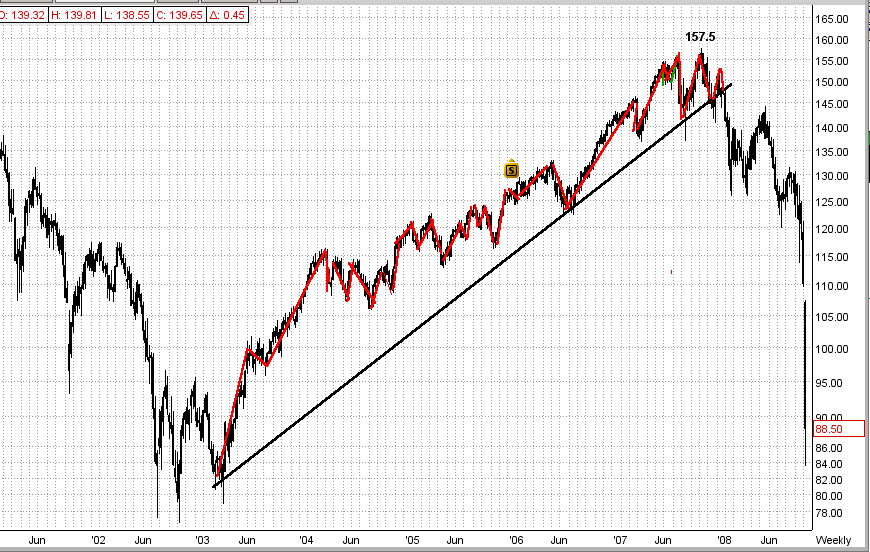
We all know that MIPS3/MF identifies intermediate-term cycles (weekly/monthly cycles) in the market, and not short-term cycles (daily cycles) nor long-term cycles (annual cycles). For example, in graph #1 below, the black line would be indicative of a very long-term cycle (5-year trend), and the red lines would be indicative of intermediate-term cycles (monthly/quarterly trends). Of course, any timing model that could accurately identify intermediate cycles, and trade the resulting trends long and short, would produce much better results than just “riding the long-term wave”. This is what MIPS2/LF and MIPS3/MF do, and they do it well. And, these are he models that we follow. [BTW – MIPS1/VLF tracks long-term (annual) cycles and trades an average of only 1 time per year.]
BUT, IS THERE ANYTHING THAT WE CAN LEARN FROM LONG-TERM CYCLES. The answer is yes, so lets go to graphs #2/3 below to see what we can learn.
Graph #1

Graphs #2/3 – Long-Term Cycles
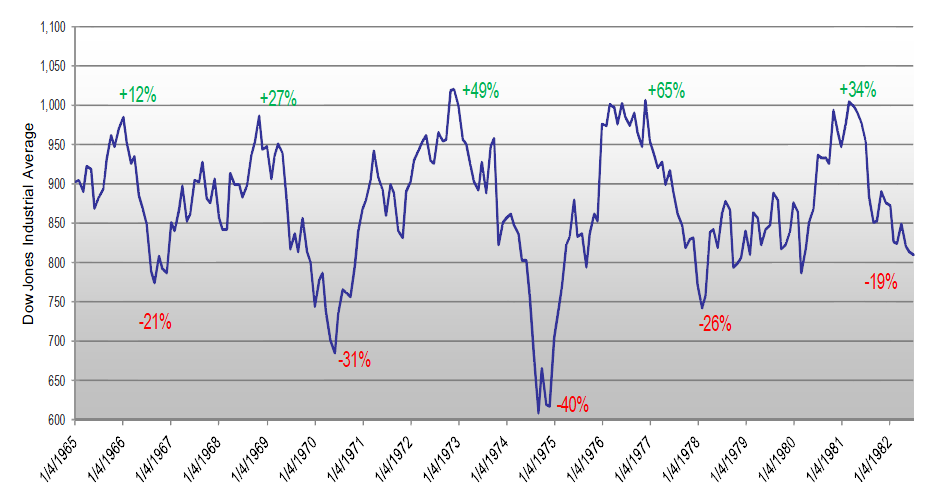
Everyone knows (or should know) that over the last 50 years, the market has a long history of repeating the same pattern (or cycle) over-and over. This cycle goes up for roughly 4-6 years and then drops 30-50% over the next 1-2 years. For simplicity, let’s just say that a very frequent stock market cycle is up for 5 years and then down for 2 years.
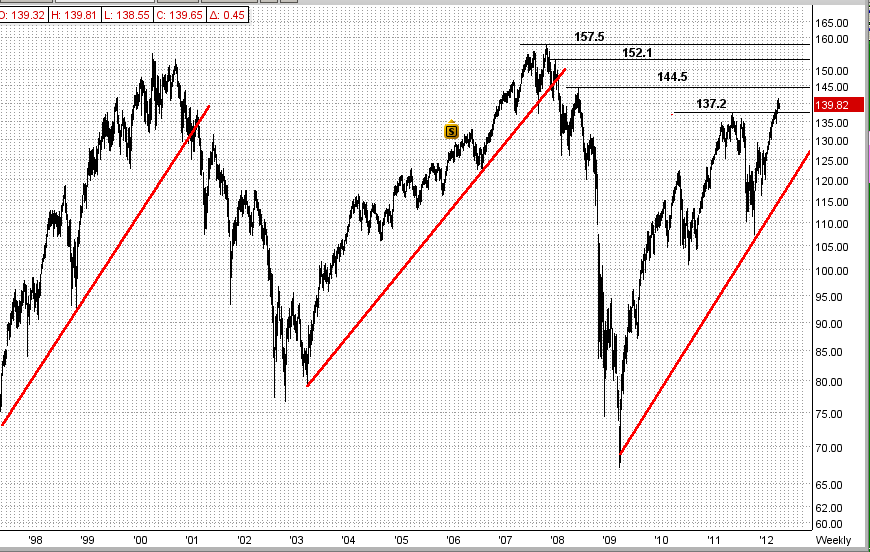
You can see these repetitive cycles in graph #2 below for the 18-year period between 1965-1983 and in graph #3 below for the period 1995-2012. These are the type of market movements where the fat cats and the hedge funds make most their money (NOT in up markets only), and where the little guys get clobbered.
Graph #2
This graph shows the Dow from 1965-1983. In this 18-year period, buy-and-hope investors would have been down about 15% (really much more, because they could have basically doubled their money by being invested in 4% CDs or US Gov’t bonds in those 18 years) !!! Without some type of market timing, how could anyone have made money in this 18-year market ???

Graph #3
The graph below is for the period 1995-2012. In this graph, the red lines show the long-term trend lines. Even though MIPS3/MF trades the intermediate term cycles within the long-term cycles, by observing the long-term cycles we can see that:
(a) long-term trends are not random,
(b) long-term trends seem to be very similar in nature,
(c) there are very good “shorting” opportunities, even in up-trending markets, and
(d) once started, they go on for years (again, like up for 5 years and down for 2 years).
The first long-term cycle in graph #3 ran for 5 years (from 1995-1999) and the second one also ran for 5 years (2003-2007); but the third (current) long-term cycle has been going up for only 3 years (2009-2011). Does this mean that our current 3-year “bull” has two more years to run? Maybe, or even likely.
And, the entire world is anxious to see if the Dow will break its all-time high of 14,164 or if the SPY will break its all-time high of $157.5/share made in 2007 (which is only 11.5% higher than Friday’s close). To do so, the SPY would have to break major resistance levels at 144.5 and 152.1 to get there (see these resistance levels in graph 3). My guess is that the big guys would like to see the SPY break its all-time high (and they can make it happen) and the little guys are just now likely to start moving money from fixed income assets into equities. Both (or maybe just either) of these would push the market higher. This is NOT a prediction, just an observation.
And remember, if the above does not happen, the market will most likely drop and drop fast. Either way, MIPS will detect the trend. So, let’s be patient and wait for MIPS to tell us what to do.
Graph #3
