Monday, December 16 2013
We at MIPS have always talked about and pointed out how the stock market moves in cycles. The MIPS models are designed to track intermediate-term cycles (like monthly cycles). But, of course, sometimes the market moves in "wiggles", not true cycles (e.g., really small day-by-day wiggles). Trying to trade wiggles leads one to much higher trading frequencies, and many times to getting whipsawed.
The last few weeks (and, in fact, several other times this year) are good examples of why one should not chase wiggles. See the graph immediately below. Looking at the market swings daily makes the changes look violent. We received many calls and emails from MIPS members last week asking what was going on in the market. Our response was "nothing that we should worry about, yet".
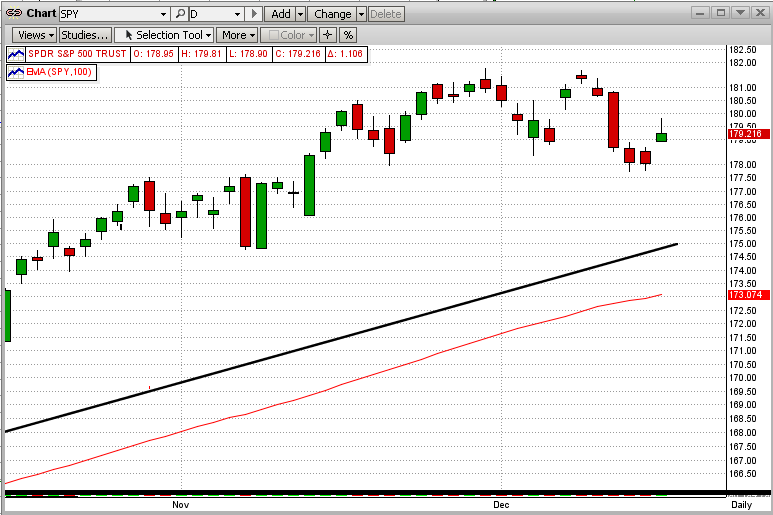
When we examine the market in the time frame that MIPS was designed to perform in the graph below, we now see a simple flat/sideways trading pattern, with the SPY trading plus and minus 1.13% around its mean-line value of $179.90/share. Now, that does not look so violent, and it is not violent in the context in which we are trading. These types of changes may be important to day traders that trade 5-10 times/day, but not to us. The moral of the story is for us to evaluate market moves in the context of our trading profile.
Which way the market moves from here is anybody's guess, and mine is that the market will move out of this sideways trading pattern (up or down) depending upon what the Fed says about its plans to "taper" pumping $85 billion/month in its bond-buying spree to keep interest rates artificially low. And, my guess is that the Fed will say it will not taper until 2014, and that will lift the markets. But remember, it is not what I think that matters, but what MIPS tells us.
Monday, November 25 2013
We have recently received several questions regarding the trading frequency of the MIPS models. Of course, the motivation for this is that the MIPS3/MF model has only traded twice in the last 12 months (and MIPS4/MF+ model has only traded 4 times in the same time period).
Over the last 11 years, these two MIPS models have traded an average of 10-15 times/year. But, what does that mean? It certainly does not mean that they trade once a month. A model that trades an average of 12 times/year can trade 2-4 times in some years and 18-20 times in others. And, when it does trade 12 times in one year, it can trade 3 times in one month and only once in the next 4-6 months.
The number one criteria that dictates the number of trades in any time period for a "trend following" model (like MIPS) is, of course, the time duration of the intermediate-term trends in said time period.
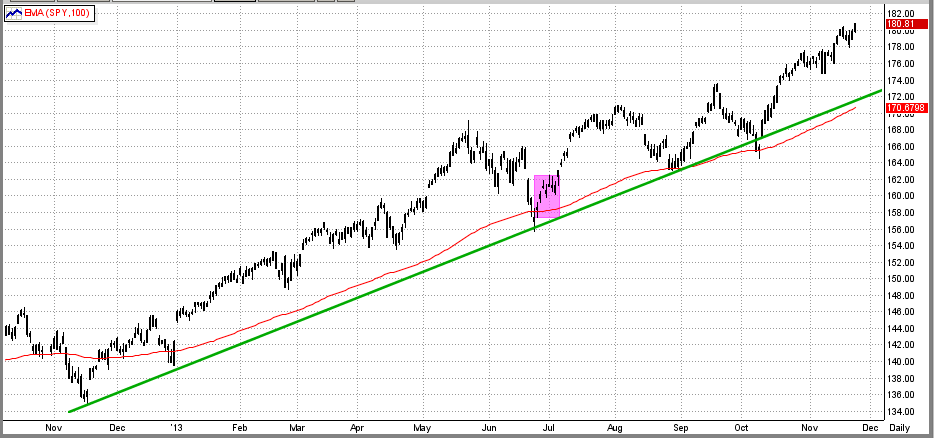
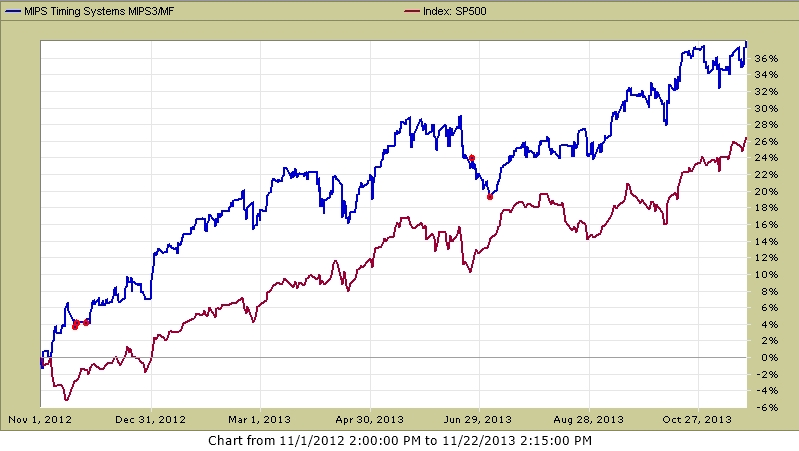
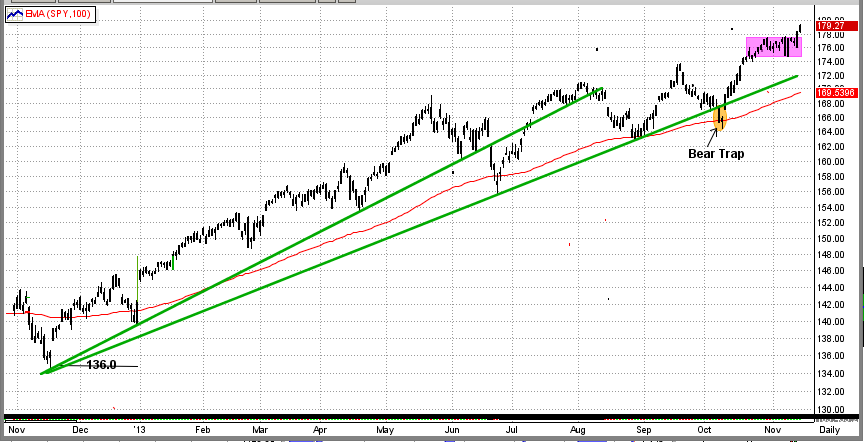
So, how does the above apply to MIPS3 and MIPS4 for 2013? To answer this question, let's look at the graph below of the SPY price action in the time frame of Nov'12 through Nov'13. In this graph, one can see the nearly perfect 12-month trendline of the SPY, and can hence understand why the MIPS3 and MIPS4 models have been long for the vast majority of this time period with very few trades. Remember, the MIPS models are following intermediate-term trends. A faster acting model would have tried to ride the shorter-term waves in the graph below, and would have traded much more often with no guarantee of better returns (but with a good chance of getting whipsawed).
SPY
LAST 12 MONTH'S PERFORMANCE (all graphs from TimerTrac.com)
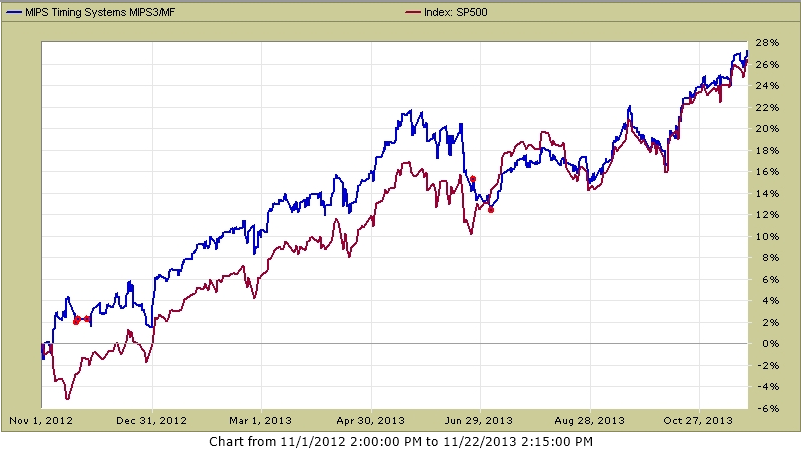
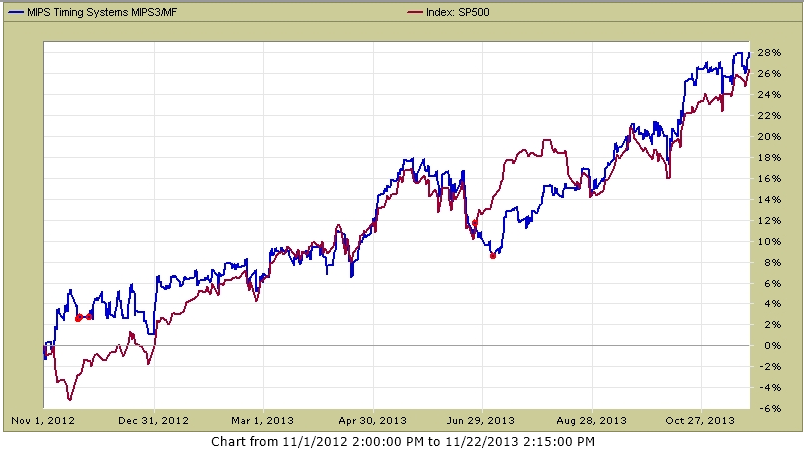
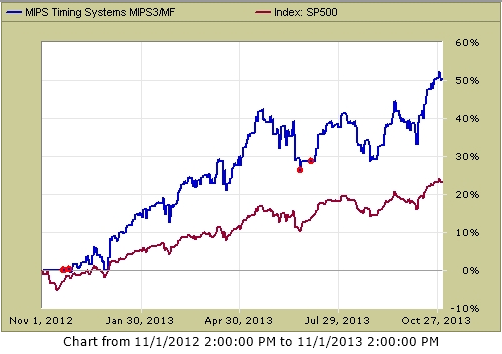
So, how did the MIPS3/MF model do in the last 12 months. We report most of our performance reports with MIPS trading the SPY long/short (or SPY long and SH short). But many of our MIPS members (including myself) trade "combos" like 1/4 each of SPY, IWM, QQQ, and SSO. See the performance of these ETFs below.
MIPS3 Trading SPY long/short
MIPS3 Trading IWM long/short
MIPS3 Trading QQQ long/short
MIPS3 Trading SSO long and SH short
PAST BEHAVIOR
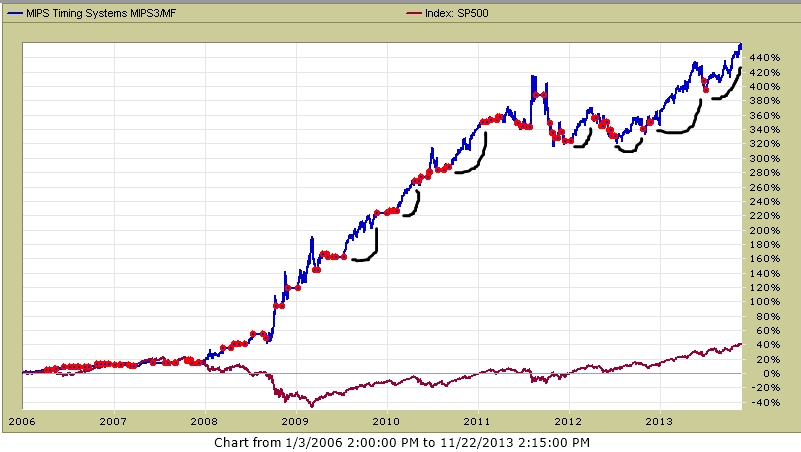
Please understand that a signal with a "life" of several months (not days) is normal behavior for the MIPS models. The models will follow the intermediate-term trends (up or down) for as long as these trends continue in the same direction. The red dots in the graph below show trades for the MIPS3 model during the time period of 2003-11/20/13. It can be seen that, in this time frame, there were at least 7 times in these 11 years when a trade signal lasted 4-6 months. And, you can see that ALL of them were winning trades (long and short).
MIPS3 Trading SPY long/short
Thursday, November 14 2013
In a previous blog on April 8, 2103, we wrote about how the stock market is basically being controlled by (the actions of) one man - Ben Bernanke. This, of course, has everything to do with his printing more and more of your money, to the tune of $85 Billion every month (that's over $1 Trillion/year) !!! And, the Fed continues to do so. The point of the previous blog (and this one) was that it is very hard for the market to go down with this kind of money working to keep interest rates low. Remember the #1 rule in stock investing - "Don't fight the Fed." Of course, with low interest rates, money naturally funnels its way out of bonds and into stocks (and there is a lot of money in the bond market, like about 5 times that in the stock market).
At any rate, after trading in a tight sideways pattern for over 3 weeks, the SPY broke to the upside yesterday (Wednesday) and again today. See graph blow.
Also, as expected, the long-term upside trend continues from all the way back in November 2012 (see the long trend lines in the graph below). Again, this is no surprise with the Fed's extensive QE3 "program" (if you want to call it that). When (and if) this comes to an end, it most likely won't be pretty.
Of course, this long, relatively smooth up-trend is the reason that the MIPS models have not traded very often between late 2012 and thru Nov 14, 2013. We will wait for MIPS to tell us when the party is over.
Sunday, November 03 2013
When trading double leverage ETFs (like for the SPY, IWM, QQQ, etc), we recommend:
(1) trading double leverage on long signals and single leverage on short signals, or
(2) simpy trading double leverage long only.
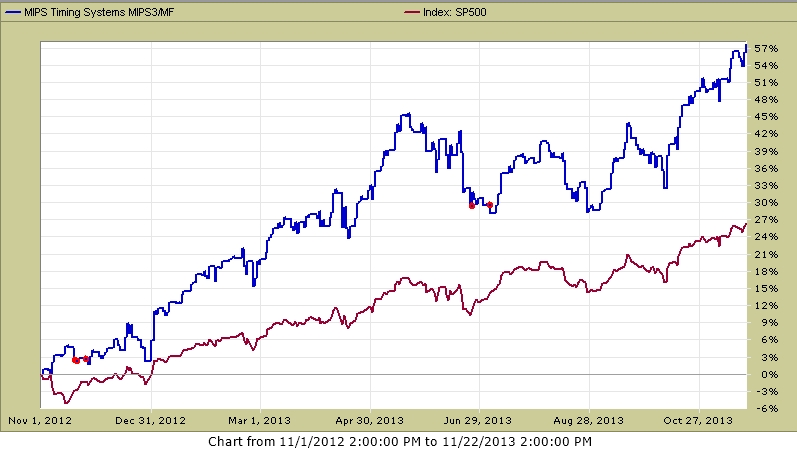
Here is how MIPS3/MF performed trading double leverage SPY (SSO) long only over the last 12 months.
SPY +23.4% SSO Long Only +50.5%
Friday, October 18 2013
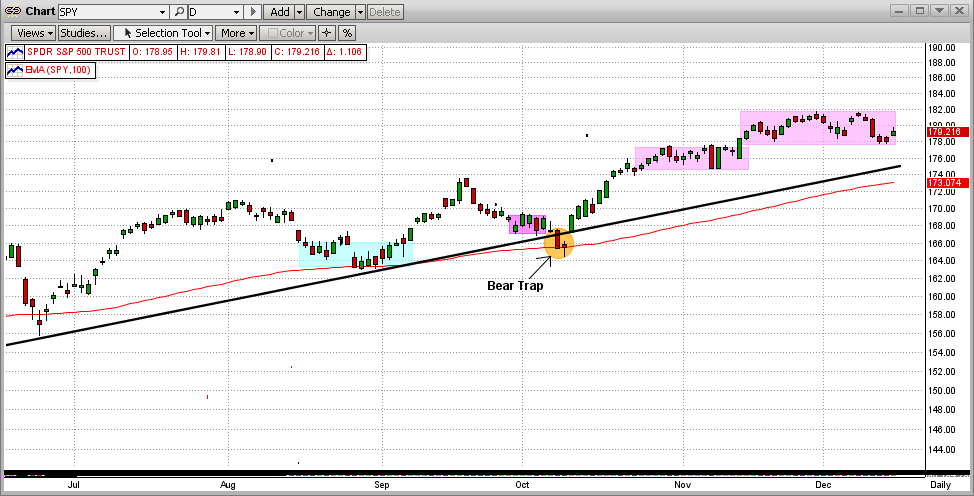
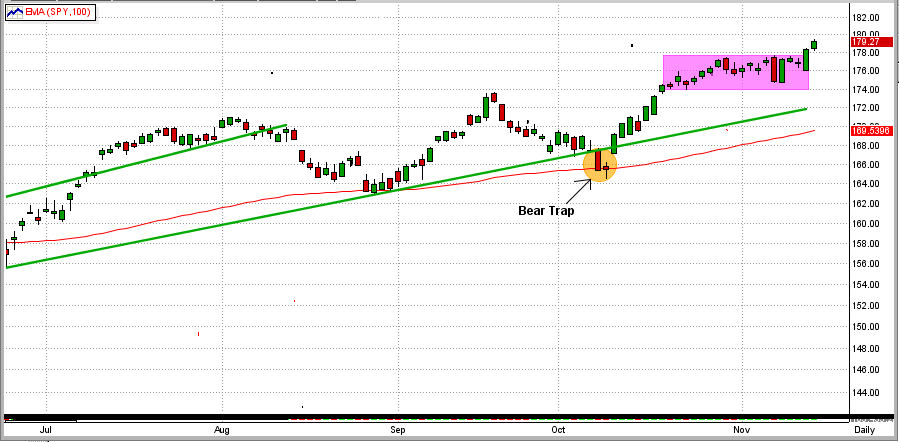
Whether it is the sequester, Fed tapering, debt limit fiasco, etc., the market in 2013 has been volatile. But, it has remained mainly in an identifiable up-trend. During this time, however, the market has had enough major "dips" to drive some market timing systems crazy. But, the MIPS models have remained Long for almost the entire year.
The last several months have been illustrative of this, and show that the MIPS models have not gotten "fooled" into costly short signals. For example, the MIPS models have been long since 9/3/13 (after a 6-day, nondescript "short" on 8/27/13). In other words, the MIPS models have ignored the recent Bear Trap in the graph below by staying Long, and have, hence, "dodged a bullet".
Many MIPS members are worried about the Market Crash of 2014, and wonder how MIPS will handle it.
Some timing systems have traded 15-25 times in 2013 and many have gotten whipsawed. In 2013, the MIPS models have been Long for the majority of the year, but are lagging the SPY by about 5%. Others have not traded at all and have "matched" the market. The problem with timing systems is that some do very well in up-markets and many of these do terribly in down markets, and vice-versa.
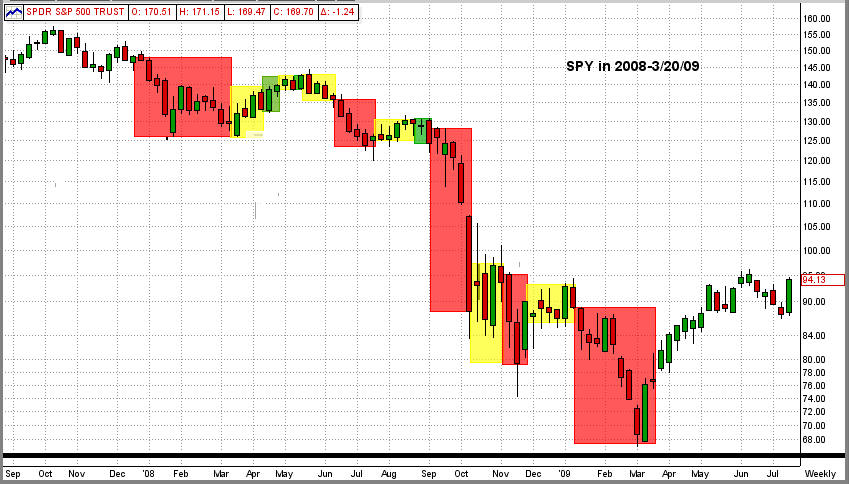
So, how does MIPS do in down markets? Our best example of this is in the year of 2008. The graph below shows the Long/Short/Cash Signals from our MIPS3/MF model in the time period 2008-3/20/09 (verified by TimerTrac).
Just how did MIPS3/MF handle the BIG market crash of 2008?
- well, it started with a short call on 12/12/07 for a 12% gain, followed by 4 other profitable short trades.
- for example, the total gain on the last 3 short trades between Sep'08-Mar'09 was about +40% !!!
This gives me great comfort and confidence in MIPS to get us out and to MAKE MONEY is the next CRASH !!
Legend: Red Box = Short Signals; Green = Long Signals; Yellow = Cash
Saturday, September 28 2013
It is not really whether or not a market crash is coming, it's when. How do we know this? Because the big-bad-bear ALWAYS comes.
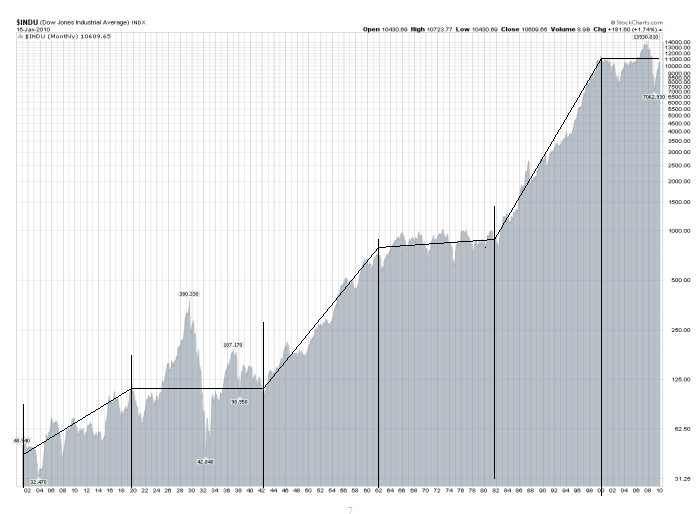
The very same "evidence" that Buy and Hold pundits (liars) use to prove that buy and hold works, actually proves that it does not!!! Their basic evidence is the "100 Year Dow" graph below. Upon close examination, starting with 1900-1920, you will see 20 good years followed by 20 flat/down years, over and over. BTW, being flat or "even" after 20 years is really a tremendous loss, because one would have doubled their money over 20 years with bonds paying only 3.6% !!!
From the graph below it would seem that, if people lived 100 years or more, the Buy/Hold liars may have a point. But most investors' prime "equity" investment years are from the time that they are, say, 45 years old (bought house, kids in college, career sound, etc.) until they are 65 years old (approaching retirement, need safe investments, more money in bonds, etc.) So, the prime time span for investors having a large portion of their portfolios in equities is about 20 years.
In the last 110 years, the 20-year good/bad periods were:
Good 1900-1920 1940-1960 1980-2000
Bad 1920-1940 1960-1980 2000-????
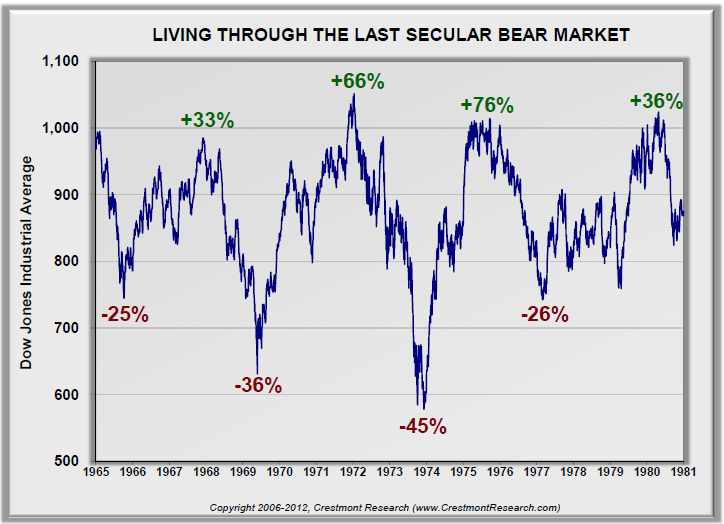
Almost everyone knows that the stock market in 1920-1940 experienced the biggest crash in the last 110 years, and we have personally "lived" through the market up/downs in 2000-2013. But, what about the market in 1960-1980? For that, see the graph below. One could say that the graph speaks for itself.
It should be obvious by now that this leaves the time period 2000-???? to dissect. Will we have another big drop? If so, when? And, how fast will the market turn down, and will MIPS catch the turn? My experience has shown the market crashes that result from bad fundamentals change slowly (long bubbles like housing, etc.), whereas, crashes that come from surprise "events" (like Lehman Bros.) change quickly.
See the graph between 2000-2013 below. We all know (unfortunately) that we have had two big market drops of over 50%. You will probably be relieved to see that, at the top, these markets traded in a range of (+ and -) 5% of their market tops for 8-9 months, before they headed down fast !!!
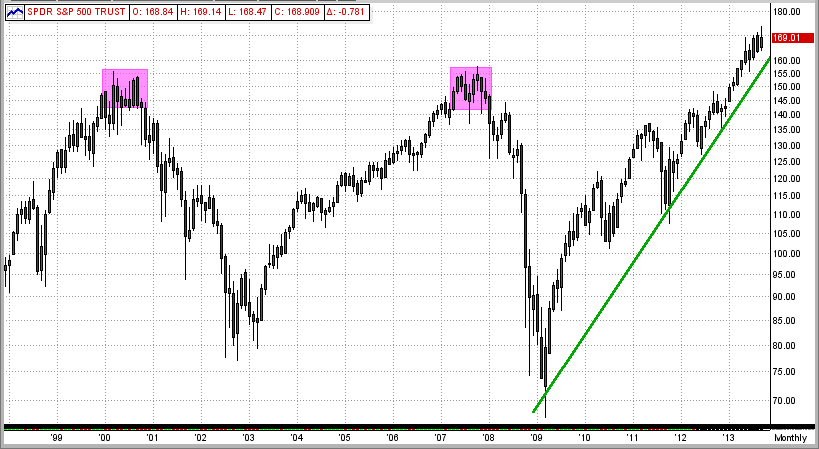
How did MIPS handle the market crash of 2008? Well, it started with a short call on 12/12/07 (+12%), followed by another short on 6/11/08 (+10), and then the mother of all shorts on 9/04/08 (+27%). What, me worry?
Saturday, September 21 2013
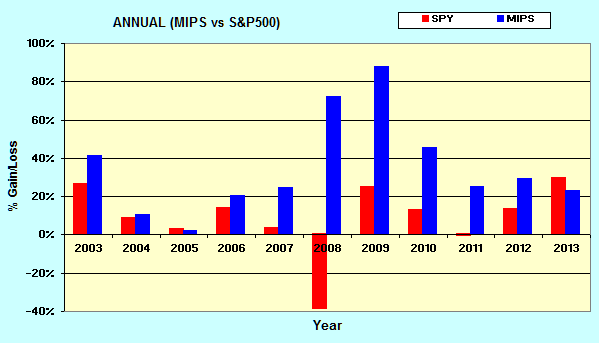
See the Annual Returns for the MIPS/Nitro model from 2003-2013 YTD below.
It is interesting to see that, in 2008, Nitro was up almost 90% when the SPY was down over 40%.
You might ask "How can that happen?"
- It happened because: (a) Nitro was not short the entire year, and
(b) the SPY did have some up periods in 2008, and Nitro was long in these up periods.
So, Nitro caught most of the up and down trends in 2008 (see Nitro signals and performance on the MIPS website).
Saturday, September 21 2013
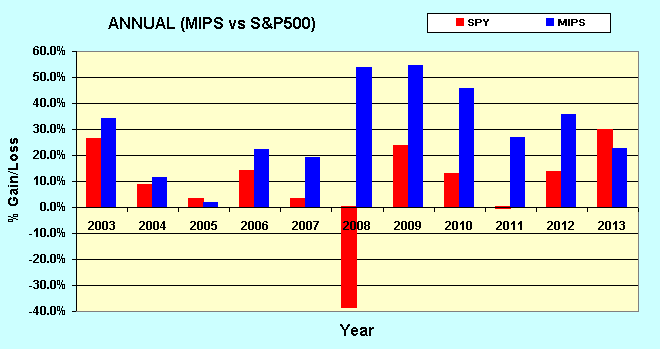
See the Annual Returns from the MIPS4/MF+ Model for 2003-2013 YTD below:
Wednesday, September 18 2013
Our Beloved Ben did it again !!!
- when he stood up and said "No Tapering," the markets went wild immediately.
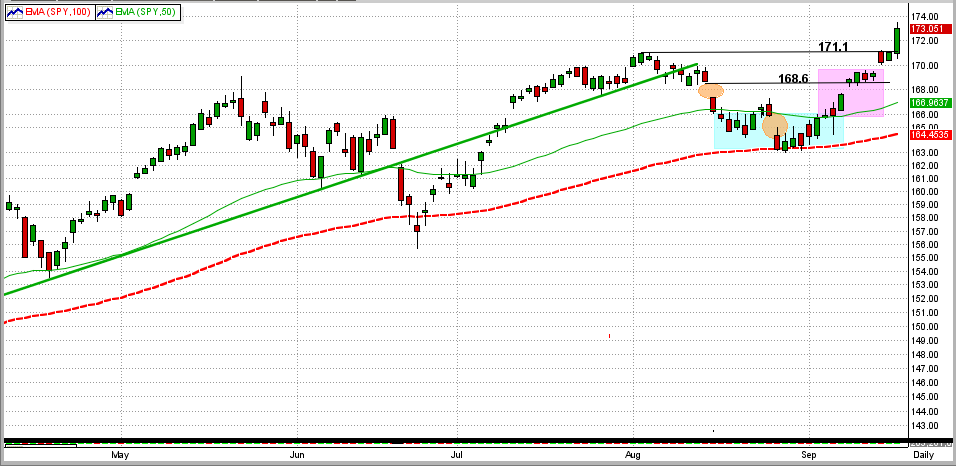
- the SPY easily broke its all-time upside resistance at $171.1 and closed at $173.05 (see the 1st graph below).
With liquidity coming from (a) Brother Ben, (b) mom-and-pop coming back in the market, (c) a mass exodus from bonds to stocks, etc., how could the markets go anywhere but up? [Bonds are such a bad investment now, we have read that even bond funds are buying stocks!]
We see more upside (and maybe even much more upside) in this bull run, but the market does not always follow my direction. Because of this, when the time comes to hold-or-fold, we rely on MIPS to tell us what to do.
More on this later...
Saturday, September 14 2013
MIPS Members:
In our previous blog from 9/9/2013, we showed the SPY's breakout from a several week, tight trading pattern. For the last several weeks, the SPY has been very volatile.
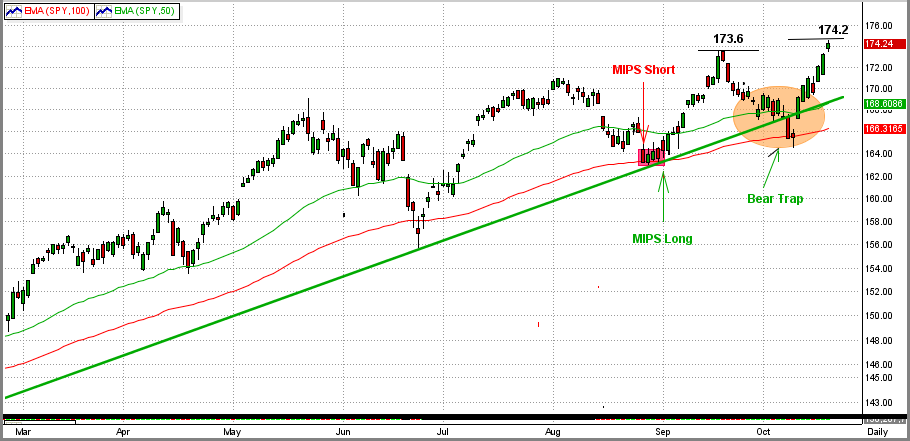
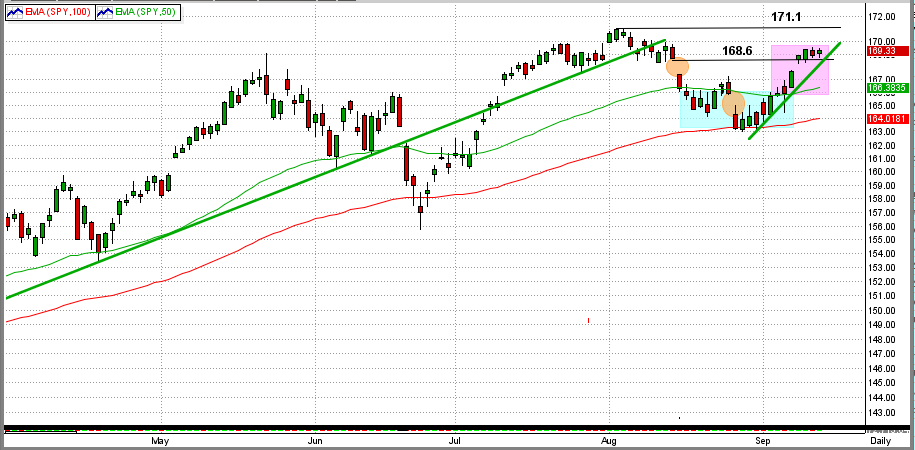
In the graph below, we can see that since 8/8/13:
1) the SPY broke its long-term trendline (top green line)
2) the SPY gapped down twice (orange circles),
3) it bounced off of the 100-day EMA and turned up (inflection point) on 8/28/13,
4) the SPY then broke above its 50-day EMA and closed both gaps,
5) it has held above both gaps (above 168.6) for 4 days now (purple rectangle).
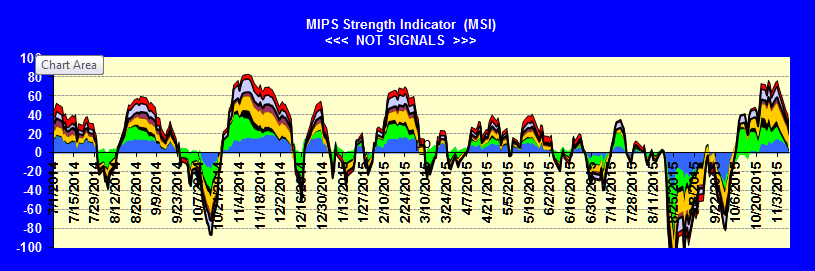
From here, of course, the SPY could challenge (and hopefully surpass) its all-time high at 171.1 or it could fall back significantly. I'm glad that we have MIPS to detect and tell us what we should do (see the MIPS Market Strength Indicator below).
The MIPS Market Strength Indicator (MSI) has improved significantly in September. See graph below:
|


