We at MIPS have always talked about and pointed out how the stock market moves in cycles. The MIPS models are designed to track intermediate-term cycles (like monthly cycles). But, of course, sometimes the market moves in "wiggles", not true cycles (e.g., really small day-by-day wiggles). Trying to trade wiggles leads one to much higher trading frequencies, and many times to getting whipsawed.
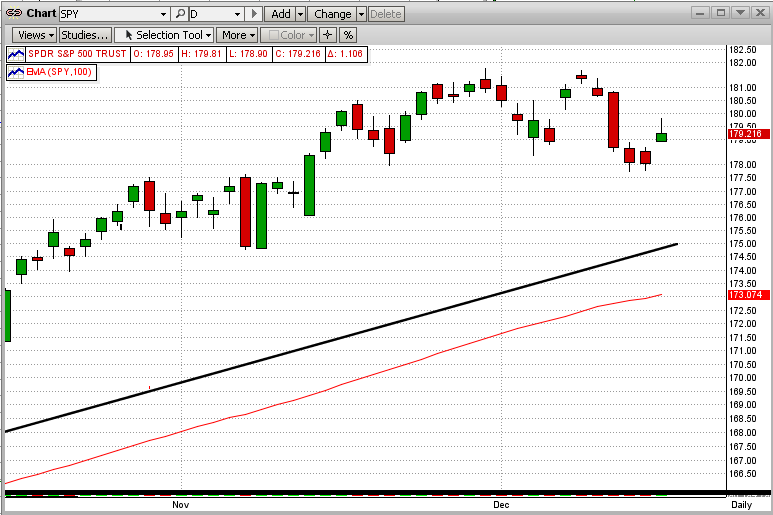
The last few weeks (and, in fact, several other times this year) are good examples of why one should not chase wiggles. See the graph immediately below. Looking at the market swings daily makes the changes look violent. We received many calls and emails from MIPS members last week asking what was going on in the market. Our response was "nothing that we should worry about, yet".

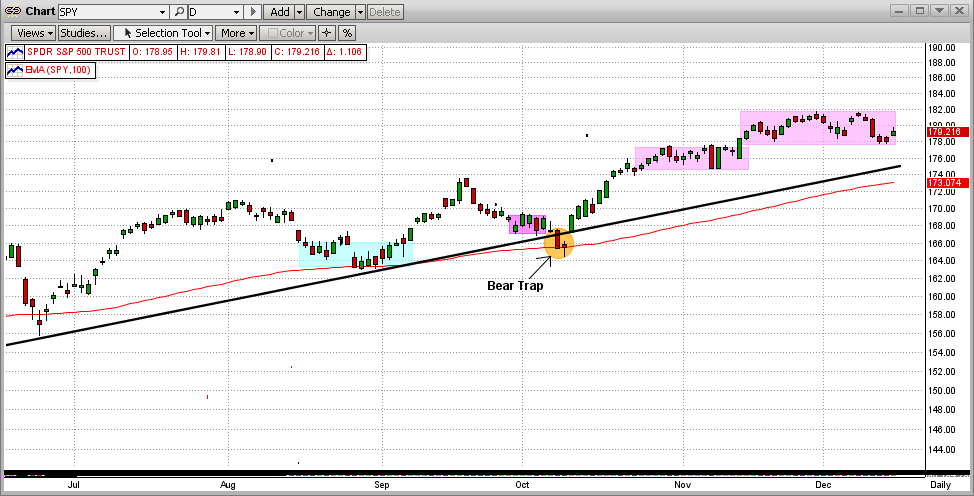
When we examine the market in the time frame that MIPS was designed to perform in the graph below, we now see a simple flat/sideways trading pattern, with the SPY trading plus and minus 1.13% around its mean-line value of $179.90/share. Now, that does not look so violent, and it is not violent in the context in which we are trading. These types of changes may be important to day traders that trade 5-10 times/day, but not to us. The moral of the story is for us to evaluate market moves in the context of our trading profile.

Which way the market moves from here is anybody's guess, and mine is that the market will move out of this sideways trading pattern (up or down) depending upon what the Fed says about its plans to "taper" pumping $85 billion/month in its bond-buying spree to keep interest rates artificially low. And, my guess is that the Fed will say it will not taper until 2014, and that will lift the markets. But remember, it is not what I think that matters, but what MIPS tells us.