Tuesday, January 29 2013
This blog post is all about "Is This Market Rally Going Higher?"
- it is not about whether or not this market should go higher, and that is a big difference.
Almost any news can change the short-term direction (days/weeks) of the market, but only strong buying or selling volume can keep a trend going intermediate-to-long-term (like weeks/months). The four cycles in the long-term ups-and-downs in the market are something like that below:
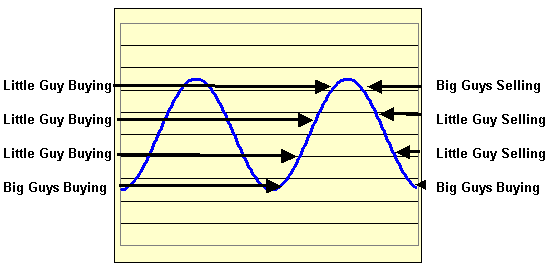
The steps in recovering from a bear market are (see the steps on the left side of the graph above):
1) the big guys buy at the market bottom (remember, they cause the bottom, not call it)
2) aggressive little guys who sold low, then sell their bonds and get back into equities when they
are still low
3) average little guys who sold about halfway down, also move money from bonds and get back
in the market
4) conservative little guys (who swore off the market), cave in and buy near the top (again and
again).
The steps after a long up market (like now) are shown below (also see the steps on the right above):
1) after the little guys have 80+ percent of their assets invested in equities, the big guys start a
stampede down
- we are not there yet, because the little guys have plenty of buying power tied up in bonds
- the SPY now is about $150.7/share and the all-time high from Oct'08 is about $157.5/share
- we believe that the big guys will let the little guys push the market to the all-time high (and
maybe higher)
- the big guys, of course, will be trying to start "panic buying" from the little guys near the top
- in reality, the big guys are not calling the market top, they are causing it
2) after the SPY makes new highs and the market gets even more "overbought", the big guys will
"dump"
3) the big guys' heavy selling will cause a big downside jolt in the market and the little guys will run
for the sidelines
4) as the first wave of little guys sell the market lower, more little guys will sell in stages all the way
to a new bottom.
In essence, we do not believe that the big guys will let this market "crash" until the SPY has "tested" its all time high at $157.5/share This might not happen until we have a small pullback, but we do think it will happen. And, we think there is a good chance that the little guys will push it that high, OR higher. But, we also believe that a big drop is possible (even likely) after that.
Either way, MIPS will catch the new trend and get us on the right track !!!
Thursday, January 24 2013
The title of this email was borrowed from an article on CNBC. And, remember my blog post from last week? ("Tipping Point for the Market in 1Q'13!") Well, it's all about that. The market (SPY) has gone up almost every day since the beginning of the year. And, the SPY broke its "up pennant" pattern decisively on 1/18/13. It seems to be headed for the SPY all-time high of $157/share (or about $1,570 on the S&P 500), made on 10/11/2007. Of course, we can expect extreme resistance at $150 and above, as the bulls and bears fight it out.
The SPY crossed $150 today, but was beaten back by the bears right around the $150 mark (and almost created the dreaded "one-day key reversal pattern"). Some say the bulls are determined to move the SPY up to test the all-time high and others say the market is way "over bought" and overdue to fall back. See excerpts of what CNBC says below the graph.
Thursday, 24 Jan 2013 | 10:36 AM ET
The Standard & Poor's 500 crossed the last big, round number between here and a record high, a destination considered inevitable by some Wall Street pros. Early Thursday trading saw the S&P 500 briefly pass through 1,500, just 65 points shy of its 1,565 record set in 2007.
Dan Greenhaus, BTIG; and Scott Sperling, THL Partners, discuss the market's recent rally and provide an outlook on private equity. While many traders usually dismiss the big, round numbers as having little meaning from a fundamental or technical standpoint, eclipsing this mark could be different.
"It's psychological more than anything," said Justin Wiggs, vice president of trading at Stifel Nicolaus. "If we stay above 1,500 it could bring some incremental dollars off the sidelines." The move past 1,500 comes as investors have been showing more confidence in stocks, finally taking some of the $2.7 trillion lying dormant in low-yielding money market funds and pumping it into equities. Stock-based mutual funds saw $9.3 billion of inflows last week and $23.6 billion over the past two weeks, according to the Investment Company Institute.
The 1,500 billboard could become just a signpost along the way if current chart patterns hold up. "We're already confirmed to go maybe not exactly to the all-time high but pretty darned close," said Abigail Doolittle, technical strategist at Seaport Group in New York. That trading behavior has been significant within the context of the Federal Reserve's liquidity programs. The central bank has pumped nearly $3 trillion through its government debt-buying program known as quantitative easing, or QE.
Doolittle has issued bearish calls in the past and still believes the long-term picture of the stock market is troubling, but sees Federal Reserve liquidity driving the market now. "It's going to be interesting to see how this plays out. It's unbelievable that the Fed has been able to pull this off," she said. "I applaud them because it hasn't collapsed yet, but I'll be shocked if there's not some severe market action to the downside, very similar to 2000 and 2007."
While the round number are often dismissed, they can prove formidable barriers. The S&P 500 struggled for three months in 2012 to clear 1,400, but once it did the average zoomed higher. "If it was the first time we were hitting the big, round number it could represent resistance. We've already been through there a couple times," said Mark Arbeter, chief technical strategist at S&P Capital IQ. "The completion of some chart formations suggests we could have measured moves back up towards the all-time highs in the first quarter."
"This is a very frustrating market," said Kathy Boyle, president of Chapin Hill Advisors. "It's times like this when I feel like throwing in the towel. That's when I feel like I should stick to my guns."
"end..."
Thursday, January 17 2013
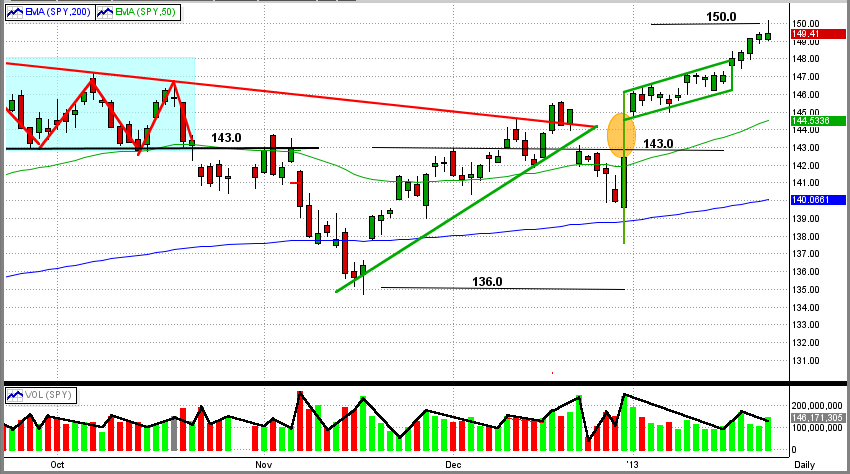
It looks like we are at a "Tipping Point" in the market for 1Q'13. Let's look at the performance of the SPY since 12/31/12. We received an overdue Christmas present on 12/31/12, as the SPY roared up over 2% on that day. On the first trading day of this year (1/02/13), the SPY "gapped up" and closed even higher on this day's close at 146.06. Overall, these two trading days accounted for a total gain of about 4.7%, with high volume on both days!!! Thanks for the good start, big guys.
Since then, the SPY has formed a classic "up flag" pattern, but on low volume (the big guys letting the little guys push the market even higher). Today we almost saw an impressive break of the SPY to the upside of this pattern, but instead the SPY closed at or near the top of this pattern's upper range at $148.0/share. By the way, this is above the 4-year high for the SPY of $146.99/share on 1/02/08. If we break out of this pattern decisively to the upside, we believe that we will see new all-time highs for the SPY (and other indices) in the first half of 2013.
[My opinion, and my opinion only, is that the big guys (Goldman Sachs, etc.) will let the little guys (those of us with less than $20 million) push the market to all-time highs. And, just about when all of the little guys have 80-90% of their portfolios in equities, the big guys will sell the market down big-time. BTW, I developed MIPS to help me trade with quantitative analysis rather than with my opinions, and MIPS has been very, very successful on that issue.]
Wednesday, January 09 2013
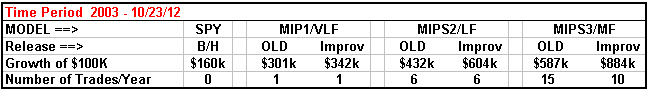
Our flagship MIPS3/MF model did NOT do really well in 2012. Our portfolio managed by MIPS3/MF trading
SPY long and short was up about 8.5% for the year (9% counting dividends earned and commissions
paid), versus about 13% growth for the SPY. So, what can we do to perform better?
Here are three ways to do better using the MIPS3/MF model (at least they have been better over the last 7 years).
Improvement #1 - Trade Multiple ETFs
As most of you know, our MIPS models are tracking the ETF for the S&P500 Index (SPY), because we
believe that the S&P500 is a very good representation of "the market". For this reason and this reason
only, we report our performance of MIPS models trading the SPY.
However, as you most likely know, MIPS members are not restricted to trading just the SPY. In fact, as
you can read under the "Services" tab on our homepage, MIPS members can trade any ETF that
"correlates" well with the SPY (or any mix thereof). Most of he ETFs that represents the major USA
indices (SPY, MDY, IWM, QQQ), fill this bill. See the definition of "correlates" at Investopedia.com:
http://www.investopedia.com/terms/c/correlation.asp#axzz2HRqpl6YI )
Therefore, if so desired, MIPS investors can trade the following:
I.) Conservative investors trading SPY long and short (or buying SH on shorts).
II.) Aggressive investors buying 1/3 each of SPY, IWM, QQQ on long signals, but only
shorting the SPY on short signals (or buying SH).
III.) More Aggressive investors buying 1/3 each of SPY, IWM, QQQ long and either shorting
these ETFs or buying their corresponding inverse ETFs on short signals (SH, RWM, PSQ).
BTW, I usually apply profile "II" or "III" above to my trading.
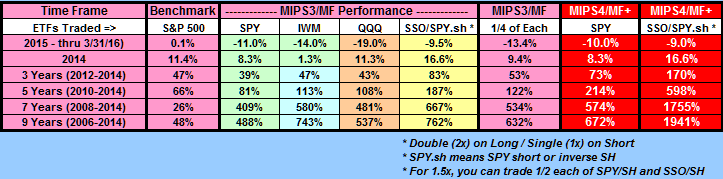
So, in the last 3 years 2010-2011-2012 (certainly not the best time for MIPS3/MF), when the SPY with
buy/hold was up 28%, MIPS3/MF trading just SPY (using profile "I") was up 42% (not at all bad). But,
trading with profile "III" in this time period, MIPS3/MF would have been up a whopping 58% (tons better
than the 28% with buy/hold, and also better than 42% from trading just the SPY with MIPS3/MF).
If we look at the last 7 years (longer-term view), the SPY was up 14%, and the trading profile "III" with
MIPS3/MF would have been up 379% (verified by TimerTrac.com) !!!
Improvement #2 - New "Improv" Release
This one is on the house. The performance of the current MIPS models are some of the very best in
the industry. However, as most of you know, we at MIPS are continually trying to make our models
even better.
To that end, we recently updated some of the algorithms in our models to respond more effectively
in flat or sideways market (like the markets in 2011-12), and hence these MIPS models will do a lot better
in these types of markets in the future. This, of course, will improve the overall results of all MIPS models
going forward.
Please note that these are NOT NEW models, they are simply the old models with relatively simple
but very effective revisions. When we develop a completely different model, the name of the new
model, or course, will definitely be different from that of any existing models (as in MIPS3/MF versus
MIPS2/LF).
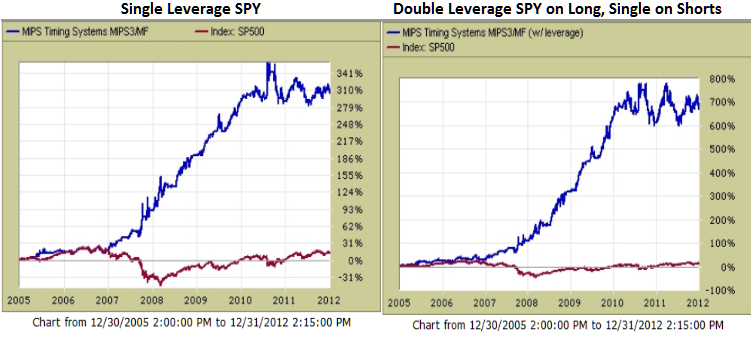
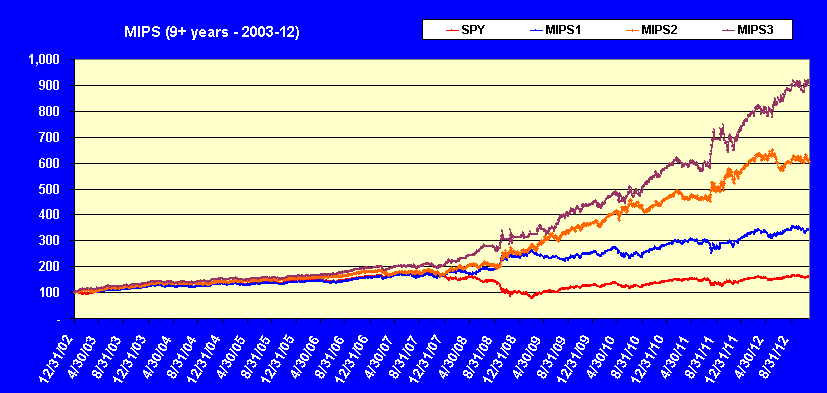
Improvement #3 - Trading Leveraged ETFs
Investors who are willing to take more risk would most likely do better with the MIPS3/MF model trading
"double leveraged" ETFs. I personally do not like to trade leveraged ETFs on every trade. Sometimes
I do use double leveraged SPY on long signals, but I use single leveraged SPY on short signals. The
results of using MIPS3/MF signals with this trading strategy are shown below (from TimerTrac.com).
In the 7-year period of 2006-12, MIPS3/MF trading single leveraged SPY was up 314% (left graph); but trading
double leveraged SPY on long signals and single leveraged SPY on short signals would have produced gains of
about 700% (right graph). Please pay close attention to the vertical axis in both graphs below.
Thursday, December 27 2012
We got a real scare in the market today as the stock market fell more than 1% after Senate Majority Leader Harry Reid said that is unlikely that a deal could be reached in Congress before the Dec. 31st "deadline". This made us revisit our thoughts that we may be on a downward path in an eerily similar fashion to that in 2007-08 (see the graph immediately below and the first graph in our "Previous email"). Had the rapid fall continued, this could have been a grim day for the bulls. It is good to note that the pullback of the last 4 days has been on low volume.
On the positive side for the bulls, the SPY experienced what could prove to be a "one-day key reversal" where the market drops dramatically on a day following a short-term pullback, but recovers and closes above or near its open on that same day. Also positive is that the SPY broke its 100-day EMA, but recovered and closed above it (blue dotted line). Of course, this DOES NOT MEAN that the downward move is over, but it is a good sign.
We all know that the market's next short-term move is going to depend upon any progress (or lack thereof) in the negotiations in Congress regarding taxes and spending cuts and whether concrete progress is apparent in avoiding going over the "Fiscal Cliff".
It is impossible for any of us predict the outcome of these negotiations, so we will have to wait until these negotiations progress (or stall), and let MIPS decide what we should do.
Stock Market Crash of 2012 ???
Saturday, December 22 2012
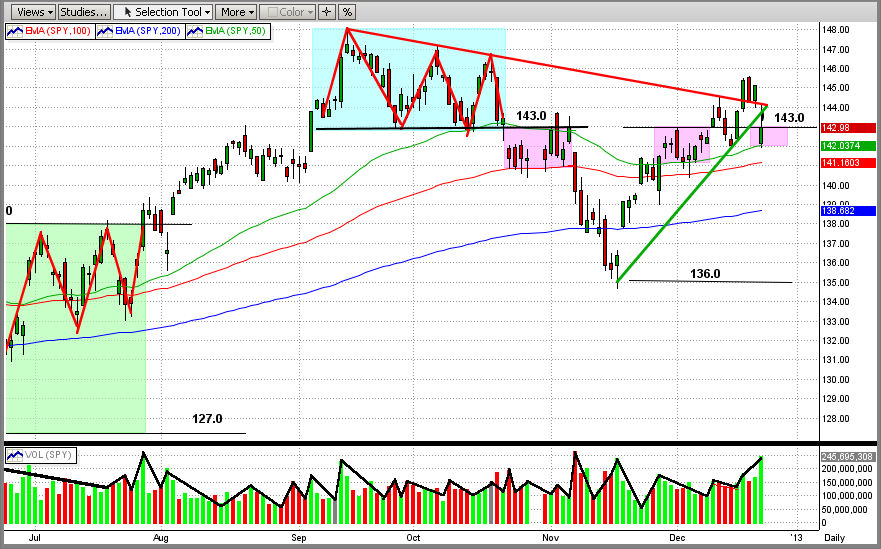
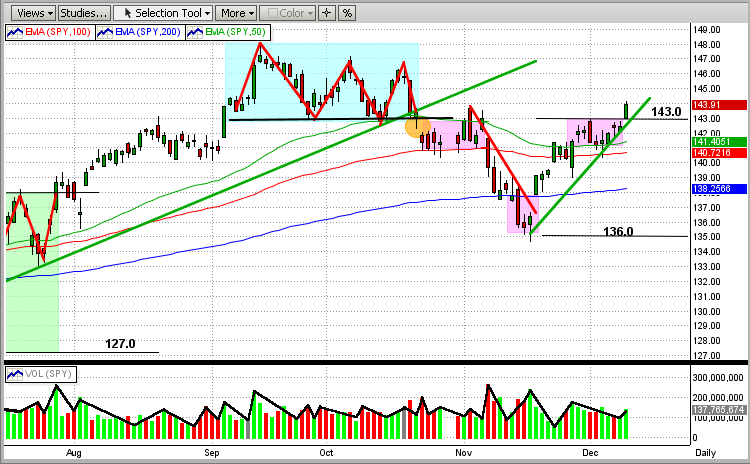
Responding to the bad news from John Boehner that he was calling off the vote in the House on the GOP's "Plan B" to avoid going over the "Fiscal Cliff", the SPY (and all other USA markets) fell substantially Friday. The SPY opened on Friday at $142.17 (approx $1421.7 on the SP500), which accounted for the downside "gap" of -$1.93 (or 1.34%) from Thursday's close of $144.10. Then, the SPY gained back $0.62 to close at $142.79, for a total loss of-$1.31 from Thursday's close (see the graph below). This $1.31 drop equates to approximately -$13 on the SP500 (or almost -1%).
An interesting phenomenon has developed in the market around $143/share (neckline of the triple top).
1) In late Oct/Nov, the SPY bounced between $143 and the top of the 100-day EMA for 2 weeks, and
then fell almost 5% to $136 (left-most pink box).
2) Then again in late Nov/early Dec, after bouncing off of its support at 136, the SPY came all the way
back and traded between $143 and the top of its 50-day EMA for 8 trading days, before it broke out
to the upside (middle pink box).
3) Unfortunately, the upside move did not last long, as the SPY again fell back to between $143 and
50-day EMA. This is where we stand now (right-most pink box).
4) If the SPY does not again challenge the $143 resistance and goes down from here, we would of course,
face an immediate correction.
5) On the other hand, another attempt by the SPY to break $143 to the upside would be its 3rd attempt.
We believe that, if the SPY does break above $143 on this 3rd attempt, the upside move will last a while.
But, if the SPY fails to break above $143, the immediate future could be very worrisome, or worse.
Of course, what happens to the US stock markets in the short-term (weeks) will most likely depend upon:
(a) what our "heroes" in Congress decide to do about our country's financial future (taxes, spending, debt),
if they can decide on anything at all, or
(b) if they will continue to prove that they are incompetent and can't get anything done, thus letting our
country fall over the "Fiscal Cliff" into a financial abyss.
[Sorry for my nasty tone in the above paragraph, but I am fed up with our congressional "leaders" on both sides.]
But remember, we can follow the above with interest but without having to decide which way the markets will go (or why), because we can rely on MIPS to tell us what to do, and when.
The above has nothing to do with the MIPS models, and are simply observations and/or opinions of the author.
Tuesday, December 11 2012
The previous email below was from 12/03/12, and was entitled "Year-End Rally or New Bear?" (2nd graph below).
After today's nice market gain, it seems like the "Year-End Rally" has won. All MIPS models are long, so that's a good thing.
In the 1st graph immediately below, you can see that the SPY danced between its 50-day EMA and the strong upside resistance level of $143/share (the neckline of the triple top) for almost two weeks. But, today the SPY broke out of this tight trading range and closed up at $143.44 on slightly higher volume.
We all know that one day does not dictate a new market direction, but today's breakout was impressive. If indeed this turns into a nice new intermediate uptrend (year-end rally), MIPS should stay long. However, if it turns south, we can expect MIPS to pick up the new downtrend and take us short. More later ...
Saturday, December 08 2012
Does history repeat itself? If so, does stock market behavior repeat itself? There are a lot of people that hope that it doesn't, but we know that many times it does.
The two graphs below are pretty compelling.
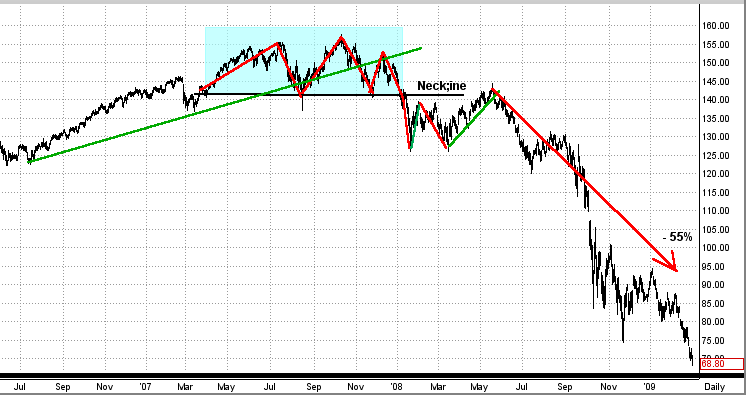
The first graph is a picture of the stock market crash of 2008, and the second one is the market behavior in 2012.
First Graph (2007-08)
In 2007-08 the SPY formed a triple top in the second half of the year. During that time, the SPY broke its intermediate-term trend line and then it broke through the bottom of the neckline of the triple top. After a fall through the neckline, the SPY re-tested the resistance of the neckline, fell back some, and then re-tested the neckline again. After two attempts to break the neckline to the upside, the SPY fell apart and dropped 55% !!!
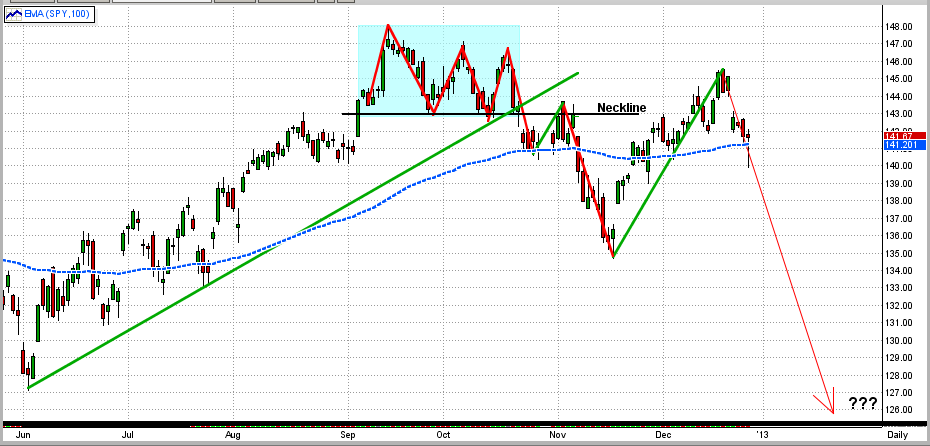
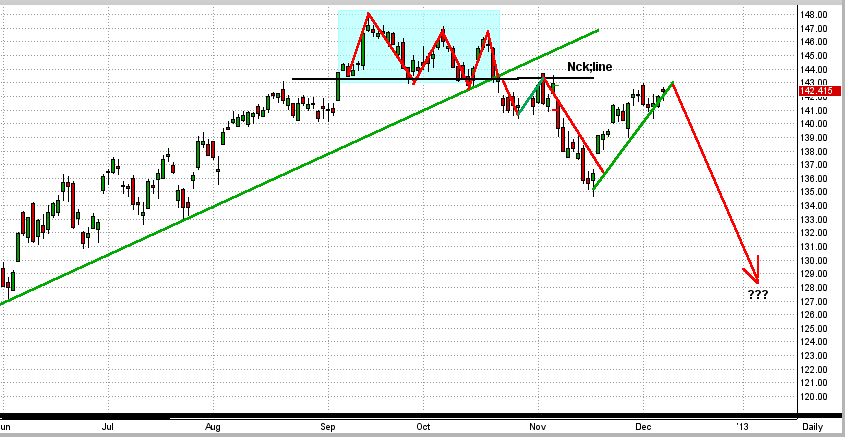
2nd Graph (2012)
In 2012 the SPY formed a triple top in the second half of the year. During that time, the SPY broke its intermediate-term trend line and then it broke through the bottom of the neckline of the triple top. After a fall through the neckline, the SPY re-tested the resistance of the neckline, fell back some, and then re-tested tested the neckline again. After two attempts to break the neckline to the upside, the SPY does what ??? (End of story for now.)
Pretty darn compelling and scary. Of course, the direction of the SPY (the market) most likely will show its hand in the next 2-3 months, and we will have either: (a) a booming bull market or (b) a big drop in the market. The good news it that, the bigger the move, the more we will make after MIPS determines the "new trend".
BTW- I follow MIPS, not the charts. But, over the years, I have found the charts to be a reasonable indicator (better than nothing). MIPS does not follow the the charts either; it is much more intricate than any one indicator.
Stock Market Crash of 2008 (graph is for the SPY)
Stock Market Crash of 2012 ???
Tuesday, December 04 2012
Good news, we are introducing new releases of our MIPS1/VLF, MIPS2/LF, and MIPS3/MF MIPS models that produce better results than our current models. The current models are very good, but the improved models ("Improv") are even better, with lower drawdowns and fewer trades/year. Please note that these are NOT new models, but simply revisions to the current models. Therefore, all models will retain their current names. BTW, "Improv" is an in-house project name for the development of these new models, and this name will not be used commercially. In this email, any reference to "Old" models means the current ones.
Of course, the past performance on our website and the past performance verified by TimerTrac.com will not change (can't change the past). But, our "release" process requires that we extensively "backtest" all new models (like the "Improv" models) to verify that they perform better than the current models over all time frames.
For example, see the table and graph immediately below
- the performance table and graph below were generated with "Improv" signals.
Performance with our "current" models can see seen on our website under the "Performance"
tab or under the "Signals" tab (past signals button); or performance results from our MIPS3/MF
model can be calculated and verified on TimerTrac.com from 11/04/05.
Monday, December 03 2012
As we all know, there is now somewhat equal pressure to push the market up as there is to push it down. The optimists are banking on our leaders solving our budget problems before we go over the fiscal cliff and on a Santa Claus rally that they have become accustomed to as in past Decembers. On the other hand, the pessimists are concentrating on a weakening EURO from defaults in some of the PIIGS countries, and are betting against the fiscal cliff problems being solved prior to Dec 31, 2012.
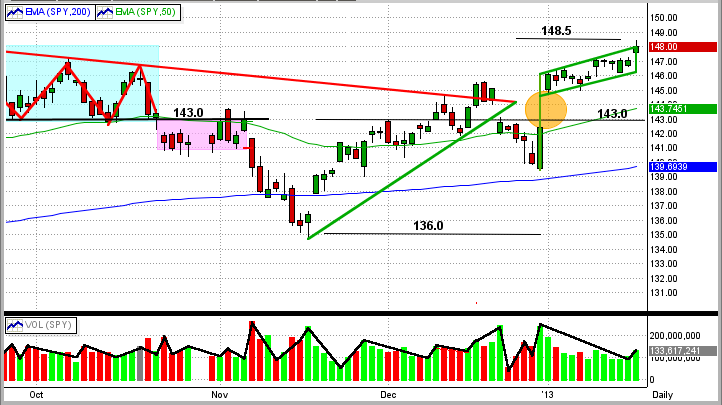
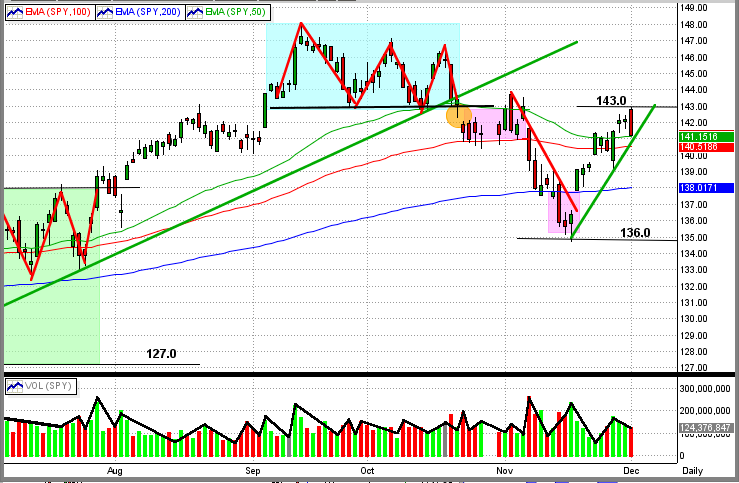
The graph below shows the recent market action (SPY price graph). From this, you can see the SPY breaking out of its November downdraft (red line) and forming a new, short-term up-trendline (rightmost green line).
Today (Dec 3rd), the SPY hit a strong upside resistance level at $143/share and bounced back down. That, of course, is bearish. This upside resistance is from the neckline of the recent triple-top (cyan box). The fact that the SPY hit and held above the 50-day EMA is bullish. The next support level is at $135/share on the SPY.
The greatest threat facing intermediate-term traders is if the SPY goes into a fast sideways trading pattern, like the one seemingly forming with tops at $143/share and bottoms at $135/share. This pattern would result in a sideways trading pattern with highs/lows plus and minus about 3% around the midpoint at $139/share. Unless an investor can trade close to these high/low points, they could get whipsawed and lose lots of $'s. Most investors cannot trade this pattern successfully on their own, and these investors need to follow a good timing system (like MIPS) or go to cash until the market breaks out of the sideways pattern, if it does form.
Or course, the SPY could simply turn around and break above $143/share into a rally or fall straight through $135/share into a new bear market. This is the type of market where MIPS can issue frequent trades because there is no solid intermediate-term trend, but that is better than being out of sync with the market and getting clobbered with fewer trades.
|


