Saturday, December 08 2012
Does history repeat itself? If so, does stock market behavior repeat itself? There are a lot of people that hope that it doesn't, but we know that many times it does.
The two graphs below are pretty compelling.
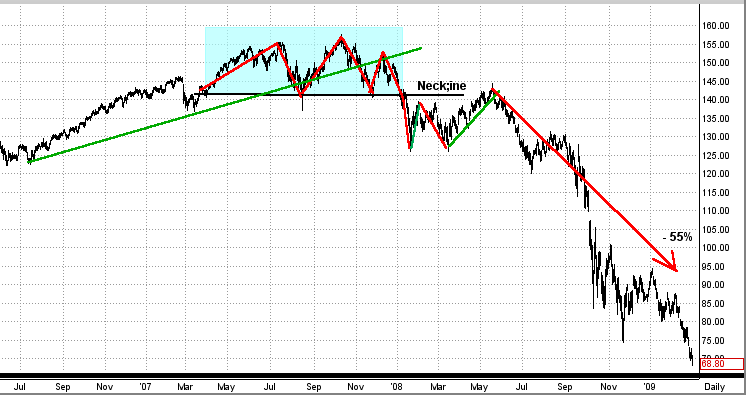
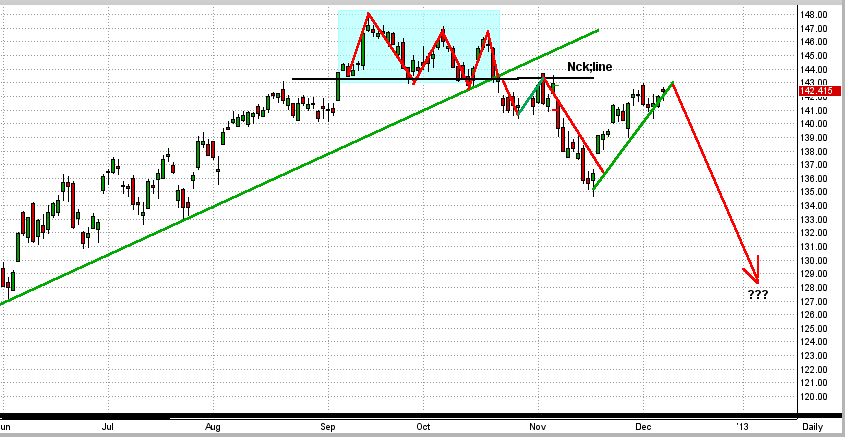
The first graph is a picture of the stock market crash of 2008, and the second one is the market behavior in 2012.
First Graph (2007-08)
In 2007-08 the SPY formed a triple top in the second half of the year. During that time, the SPY broke its intermediate-term trend line and then it broke through the bottom of the neckline of the triple top. After a fall through the neckline, the SPY re-tested the resistance of the neckline, fell back some, and then re-tested the neckline again. After two attempts to break the neckline to the upside, the SPY fell apart and dropped 55% !!!
2nd Graph (2012)
In 2012 the SPY formed a triple top in the second half of the year. During that time, the SPY broke its intermediate-term trend line and then it broke through the bottom of the neckline of the triple top. After a fall through the neckline, the SPY re-tested the resistance of the neckline, fell back some, and then re-tested tested the neckline again. After two attempts to break the neckline to the upside, the SPY does what ??? (End of story for now.)
Pretty darn compelling and scary. Of course, the direction of the SPY (the market) most likely will show its hand in the next 2-3 months, and we will have either: (a) a booming bull market or (b) a big drop in the market. The good news it that, the bigger the move, the more we will make after MIPS determines the "new trend".
BTW- I follow MIPS, not the charts. But, over the years, I have found the charts to be a reasonable indicator (better than nothing). MIPS does not follow the the charts either; it is much more intricate than any one indicator.
Stock Market Crash of 2008 (graph is for the SPY)

Stock Market Crash of 2012 ???
