For some time, we have been talking about this war between the Bulls and Bears, but we never really defined it. We call it a war, because that is what it is like.
To help explain this, let's refer to the "Battleground" map below, with the following "definitions".
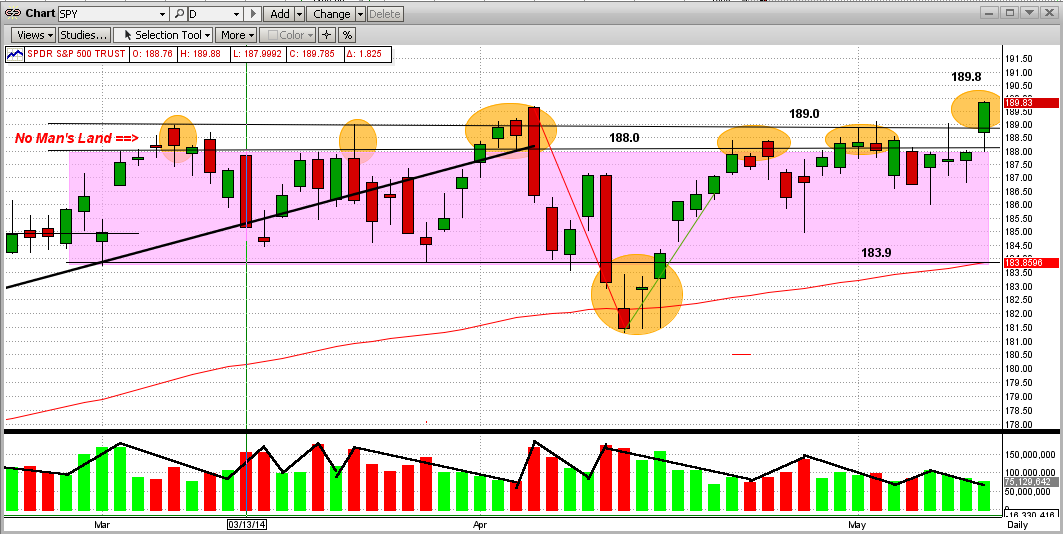
1) The SPY numbers ($188/share) are kind of like "mile markers".
2) The main battlefield is the purple area between markers 184 and 188.
3) The first wall of resistance in the battle is at 188 and the absolute "stone wall resistance" is at 189.
4) Between 188-189 lies an area that we call No Man's Land, that is deadly to try to cross or occupy.
It is like the Normandy Beach in WWII, the Shenandoah River in the Civil War, or a "moat" in the
Middle Ages. The casualties in this "zone" are almost unbearable, but sometimes attackers manage
to cross it. (Like now?)
So, using the above definitions, the History of the Battle of No Man's Land is:
1) Let's say the green bars are attacks by the Bulls and the red bars are retreats.
2) The Bulls attacked the Bear's first resistance level at 188 in the first week of March 2014 and then
pushed through No Man's land to 189 before getting stopped, routed on 3/13/14 and pushed back
to about 183.5 by mid-March.
3) Then there were 5 more broad attacks during the battle (orange ellipses).
4) The Bulls camped at the 188 level or hunkered down in No Man's Land for 26 days/nights in this
2-1/2 month battle.
5) The Bulls hit or broke over the wall at 189 nine times in this battle and failed every time, except on
its ninth try (today), where it stopped at 189.8.
6) One major problem is that the breach today above 189 came on low volume (kind of like the Bear's
super troops were not in this battle).
7) Now it is up to the Bulls to "hold their ground" and/or capture more territory, while the Bears must
concentrate on re-claiming the territory that it lost today.
The Bulls should not celebrate until the market moves higher or at least they retain what they has gained so far.
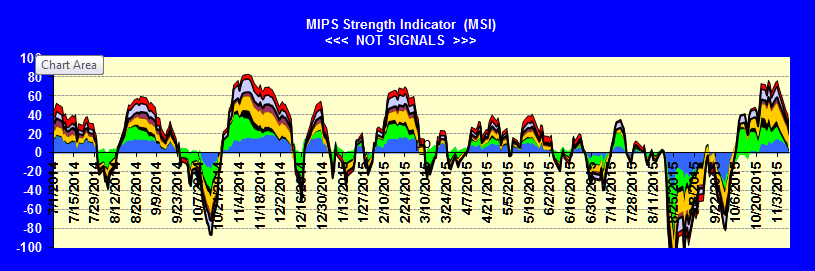
Our MIPS Market Strength Indicator is strong to the upside now, but we all know that this can change quickly.
- see 2nd graph below.
Remember, MIPS may see this somewhat differently, so let's wait for MIPS' signals.
Battleground Map
MIPS Market Strength Indicator (5/12/19140
===============================================================================
<<< Previous Blog >>>
MIPS Members:
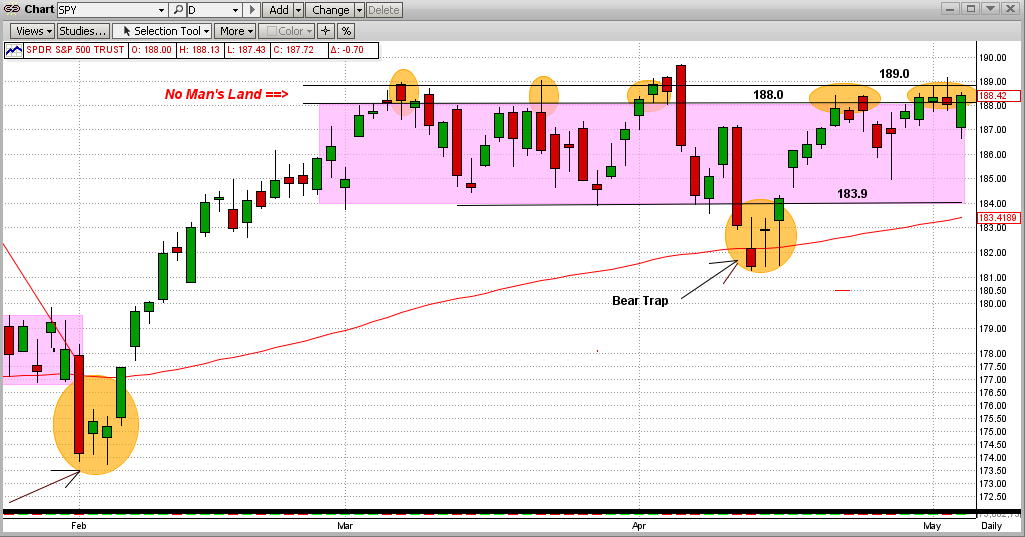
On yesterday's close, the SPY again stuck its head above 188.0 into No Man's Land (e.g., between 188.0 and 189.0). In fact, there is a very interesting phenomenon going on in this very tight range. Let's look at the stats from the graph below.
1) The SPY has been in a rather tight, sideways trading range since 3/03/14 (for over 9 weeks). This is also called a flat or horizontal "pattern", and 9 weeks in this pattern is somewhat rare.
2) The SPY has not been able to break firmly above its strong resistance level at $189.0/share except for a few hours on 4/04/14, then it got "slapped" back down. And, in the entire time period, the SPY hit or stuck its head above the 189.0 level seven times, again only to be slapped back each time.
3) Anomaly - the SPY had been "trapped" in the trading range of 188.0-189.0 (No Man's Land) five times during this period (see orange ellipses in graph below). This is very unusual. In fact, the SPY has hit 188.0 or closed in No Man's Land 23 days (or 47% of the time in the sideways trading range). So far, every time the SPY has stuck its head above the fence at 188.0, it got slapped back to the lower end of the trading range (184-185).

Of course, the SPY will not stay flat forever. It will break out of this flat trading range, and most likely soon. And, when it does, the market's move up or down from the trading range will be bigger the longer the SPY was in the flat pattern.
Which way will it break?
We need to trust MIPS to answer that.
|


