The trading frequency of the MIPS models in the last 12-15 months has been the lowest in our history (e.g., just 2 trades in 2013 with MIPS3/MF). Historically, MIPS3/MF and MIPS4/MF+ trade an average of 12-15 times/year.
We have MIPS members that want to know more about why low-trade years happen, and what the consequences are. The answer is quite simple (and good). The MIPS models only trade when they feel strongly that the market (as measured by movements of the SPY) has changed direction from up-to-down or vice versa. MIPS does not trade just to trade!
In other words, a MIPS model trades only when it has identified an "Inflection Point" (and a new trend). If it turns out that MIPS does not experience a strong trend going forward, it may quickly reverse its decision. This is why the losses on our losing trades are only 1/3 the size of the gains on our winning trades.
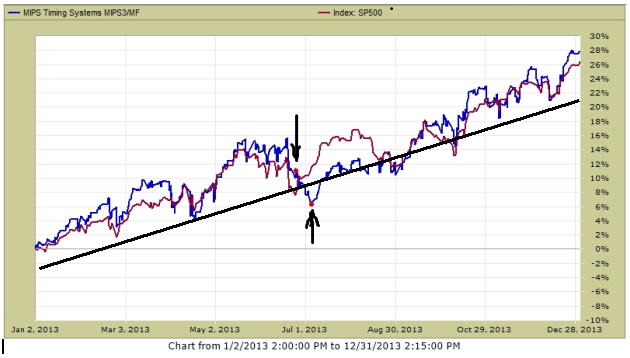
So, getting back to the point, the market in 2013 was in one big, continuous, strong up-trend for the entire year (see the 1st graph of the SPY benchmark below). This is about as smooth as a market can get. In 2013, the SPY was up about 26% and MIPS3 trading IWM was up 28%. Hard to complain about that !!!
Remember that it is hard if not impossible to "beat the index" in up-markets that do not present any opportunities to make money by being short. On the other hand, it is hard if not impossible not to make good money in these markets by just being long the entire time. The only way that you can lose money or not make money in these markets is by getting whipsawed.
You will notice that there are no real practical, intermediate-term down-trends in 2013, where MIPS could have made money by being short. Most of the "dips" in 2013 reversed themselves quickly before any new real trends formed, thus presenting a pattern where many fast-acting timing models got whipsawed. MIPS3 made only two trades in 2013, one on 6/24/13 (short) and a quick reversal on 7/3/13 (back to long).
MIPS3/MF in 2013 (2 trades - red dots) SPY +26% MIPS IWM +28%
Now the question should be: "How did MIPS3/MF do in other fast, high-growth markets in the past"?
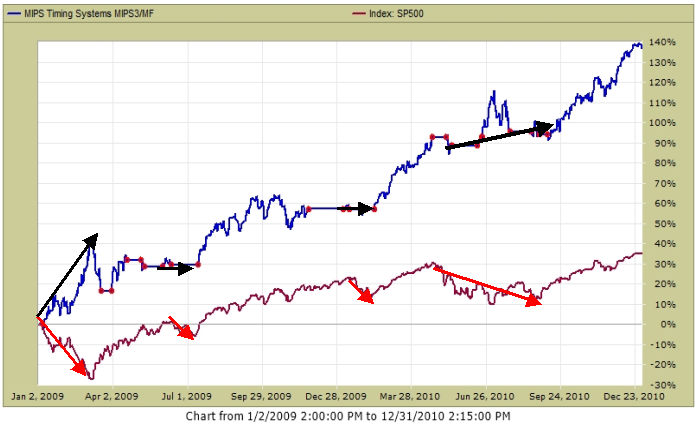
A good time period to examine to help answer that question is in 2009 and 2010. Remember, in strong up-markets, you can only really "best the index" by a healthy margin if and when your timing model identifies and trades real down-trends where "shorts" make money.
So, let's look at how MIPS3 trading IWM did along that line in 2009 and 2010 (two up-years).
- For that, see the graph immediately below. In the several times when the SPY went south, MIPS3 went
either "short" or to "cash".
As you can see from the graph below, if the market presents "tradable" down-trends where "shorts" make money, the MIPS models will most likely identify and trade them.
- MIPS3 below issued 10 trades in 2009 and 15 trades in 2010.
MIPS3/MF in 2009 and 2010 (25 trades - red dots) SPY +36 MIPS +138%

So, let's sit back and follow MIPS...
- remember, MIPS3 is a good model, but MIPS4 is even better
- if you can trade ETFs on the next day's open, use MIPS4
- but, if you must trade mutual funds on the next day's close, use MIPS3.


