Friday, January 31 2014
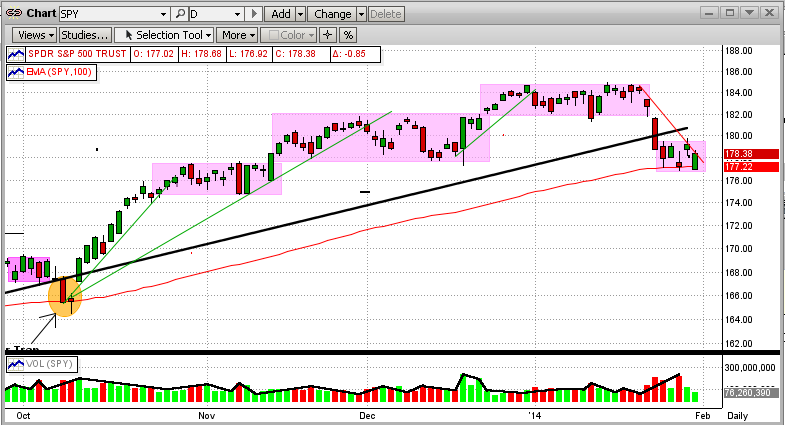
Up day, down day; three up days, three down days; etc. We have seen three multi-week sideways trading patterns in the SPY since October 2013. Then, we had a relatively big drop six days ago, followed by what is looking like another sideways trading pattern. In effect, the market has not really gone anywhere since mid-November 2013. So, is this the start of the Big One Down?
Read on... This blog is an update to a prior blog entitled "Market Crash Coming?" (see below).
The points of our previous blog below are that: (1) the last two crashes in 2000 & 2008 took 8-9 months to develop, so the Big Ones do not normally happen quickly, and (2) when the big drop started in 2008, MIPS3 picked it up quickly and did very well for the year (MIPS3 up over 50%, SPY down over 50%).
As mentioned above, in the last few days, the SPY movements have developed into another sideways pattern, and of course, no one knows which way it will break out from here. But, the breakout is usually in the same direction that the market was heading when it went into the pattern. In this case, that means down, but the bulls are still flexing their muscles to the upside (with help from the Fed). So far this year, there has not been much harm done either way because every down day has been followed by an up day. This is not usually a recipe for a big drop, but anything can happen. Of course, MIPS is analyzing the market movements in many ways that we cannot. And, the MIPS models were developed to not "jump-the-gun" (like we might do), and make a big mistake.
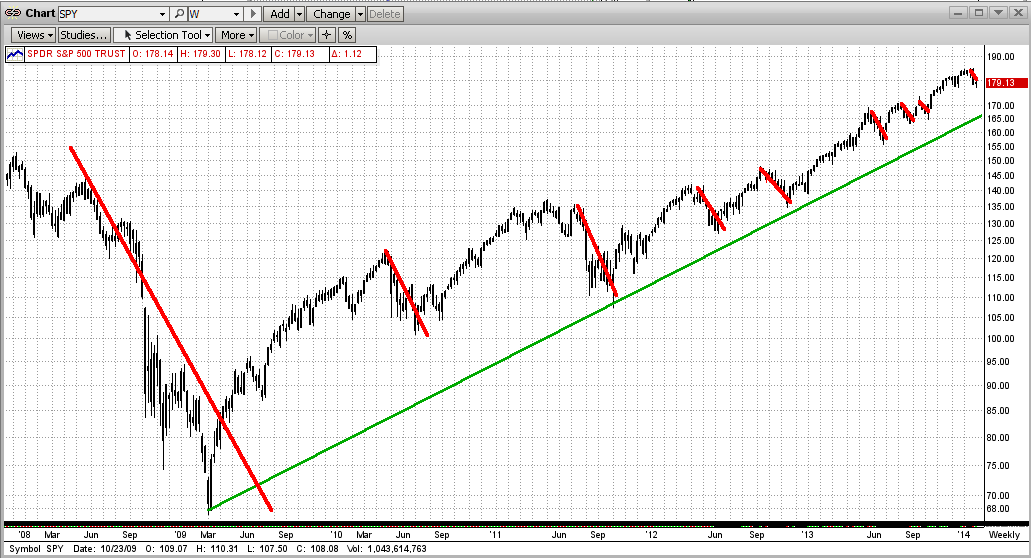
BTW, many investors are freaking out because of the market weakness in the last seven days. But,
the seemingly "big" market drop that we are seeing now is actually "tiny" once you stand back
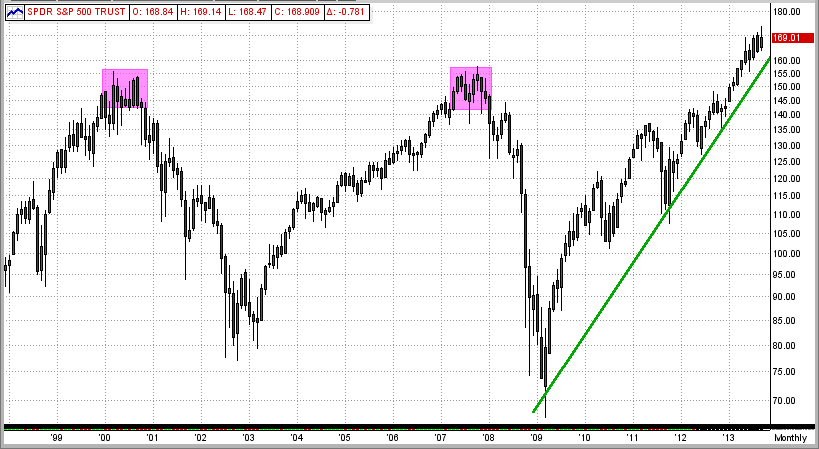
and look at it from a long-term perspective (like over several years, as in the graph below).
Then, you can see that this year's "dip" is hardly even noticeable compared to other market "drops"
between 2007 and now.
- So, sit tight and don't panic.
- Remember, many investors lose most of their money thru panic selling, but a good "mechanical"
model should give you the confidence and discipline to "stay put" until you get another signal.
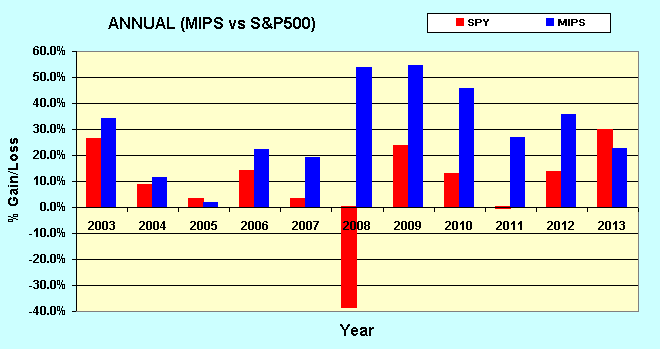
Finally, how did MIPS do in the last 11 years ???
- very well, see the MIPS4 performance below
Hope this helps !!!
===================================================================================
| Subject: |
MIPS - Market Crash Coming? |
| Date: |
Sat, 28 Sep 2013 13:42:38 -0500 |
| |
|
|
|
It is not really whether or not a market crash is coming, it's when. How do we know this? Because the big-bad-bear ALWAYS comes.
The very same "evidence" that Buy and Hold pundits (liars) use to prove that buy and hold works, actually proves that it does not !!! Their basic evidence is the "100 Year Dow" graph below. Upon close examination. starting with 1900-1920, you will see 20 good years followed by 20 flat/down years, over-and-over. BTW, being flat or "even" after 20 years is really a tremendous loss, because one would have doubled their money over 20 years with bonds paying only 3.6% !!!
>From the graph below it would seem that, if people lived 100 years or more, the Buy/Hold liars may have a point. But most investors' prime "equity" investment years are from the time that they are say 45 years old (bought house, kids in college, career sound, etc.) until they are 65 years old (approaching retirement, need safe investments, more money in bonds, etc.) So, the prime time span for investors having a large portion of their portfolios in equities is about 20 years.
In the last 110 years, the 20 good/bad periods were:
Good 1900-1920 1940-1960 1980-2000
Bad 1920-1940 1960-1080 2000-????
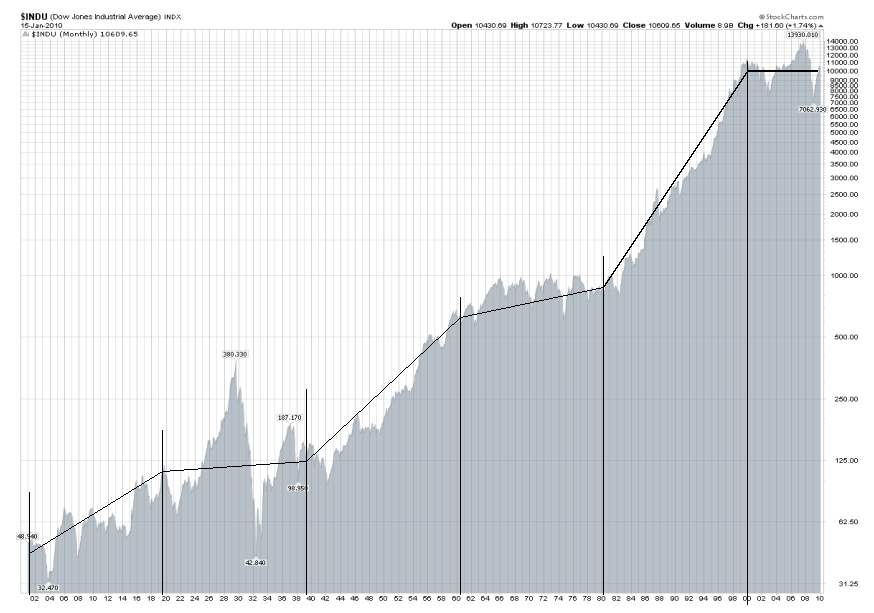
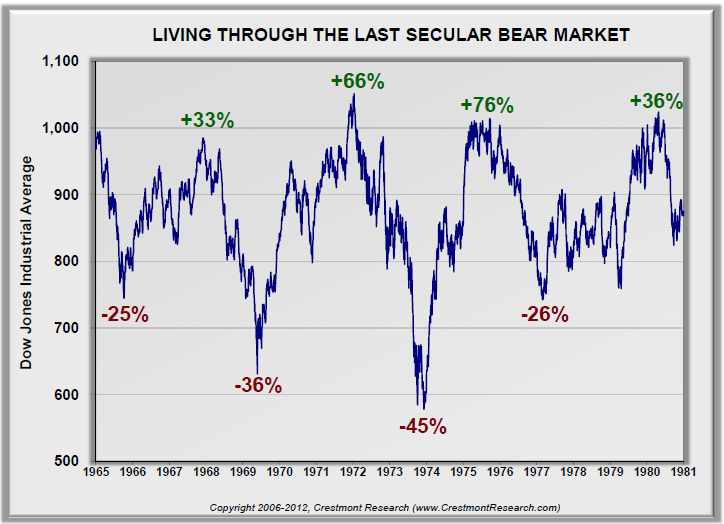
Almost everyone knows that the stock market in 1920-1940 experienced the biggest crash in the last 110 years, and we have personally "lived" through the market up/downs in 2000-2013. But, what about the market in 1960-1980? For that, see the graph below. One could say that the graph speaks for itself.
It should be obvious by now that this leaves the time period 2000-???? to dissect. Will we have another big drop? If so, when? And, how fast will the market turn down and will MIPS catch the turn? My experience has shown the market crashes that result from bad fundamentals change slowly (long bubbles like housing, etc.), whereas crashes that come from surprise "events" (like Lehman Bros.) change quickly.
See the graph between 2000-2013 below. We all know (unfortunately) that we have had two big market drops of over 50%. You will probably be relieved to see that, at the top, these markets traded in a range of (+ and -) 5% of their market tops for 8-9 months, before they headed down fast !!!
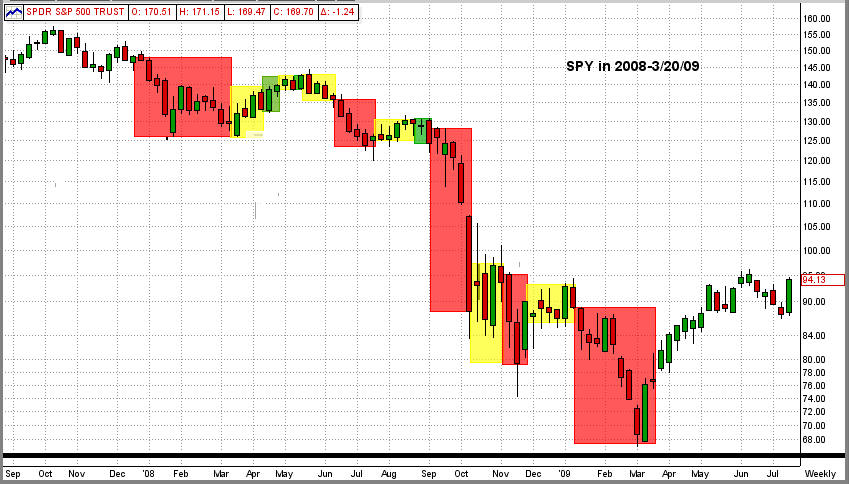
How did MIPS3/MF handle the BIG market crash of 2008?
- Well, it started with a short call on 12/12/07 for a 12% gain, followed by 4 other profitable short trades.
- Total gain of about +40% on the last 3 short trades between Sep'08 - Mar'09) !!!
- See graph below. What, me worry?
Legend: Red Boxes = Short Signals; Green Boxes = Long Signals; Yellow Boxes = Cash
|
|


