Let's not forget that the main things (and maybe the only things) moving the stock market are the plans and actions of the Fed. In my lifetime of investing, the only long-term indicator that has never failed is the one between the money supply and stock market movements. Over the years, the market has had substantial gains when the money supply was growing and big contractions when money was tight. That is when I learned to "never fight the Fed".
These days however, with this Fed's actions, the markets are convoluted. A couple of weeks ago, the market took a big hit when Bernanke (Ben) set some guidelines for when the Fed might start throttling back on printing money (so-called "tapering"). Printing more money, of course, means diluting our actual money, with hypothetically "more for everyone". Problem is, however, the "everyone" does not include us. Ben was emphatic that when the economy improves, the Fed will cut back on printing money (as should be). And, this drives the market down? Great.
Then, the following week, reports showed that whatever economic growth that we may have had (if any) was slowing or reversing. In other words, Ben's Quantitative Easing is NOT working!!! On this news, the market dropped, right? Wrong again. The fat cats and big traders, who couldn't care any less about our economy, drove the market way up and started a new up-trend. It seems to me that something is wrong when the economy slows and the market goes up. No wonder no one even claims to know how to invest in this environment (and by "how to invest", I am including stocks, bonds, gold, etc.)
So, here are the possibilities that we see from here:
(Note: this is not part of the MIPS program, but only my opinions of how I think the big guys and traders see the market.)
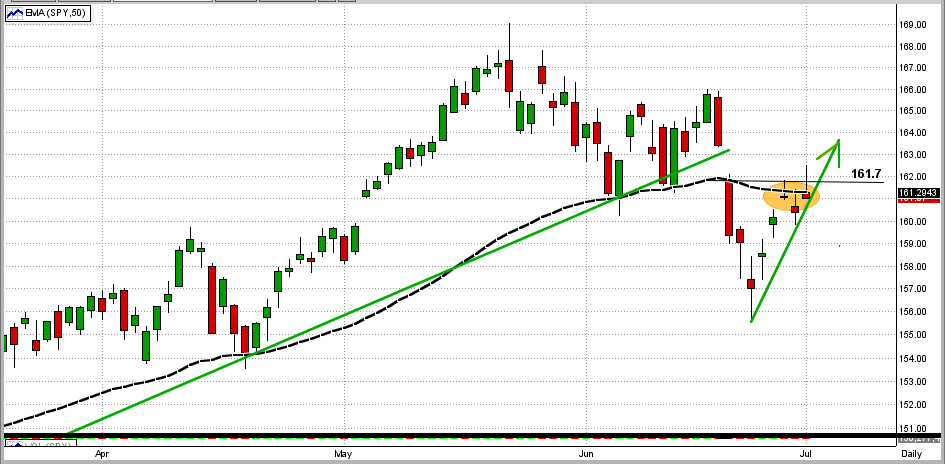
I.) Graph #1
In the graph below, we can see that (a) the market took a dive 9-10 days ago when Bernanke opened his mouth, (b) it had a "key reversal day" four days later when reports showed a slowing economy, and (c) it has made a sharp rebound since then. Now, we are at a critical juncture. The SPY has hit and failed to break its 50-day EMA (black dashed line) to the upside in the last three days and, hence, has failed to recapture lost territory above $161.7 on the SPY (orange ellipse). If the SPY does break this resistance level to the upside in the next few days, the bull should continue to run. If not, we will continue to scenarios II or III below.
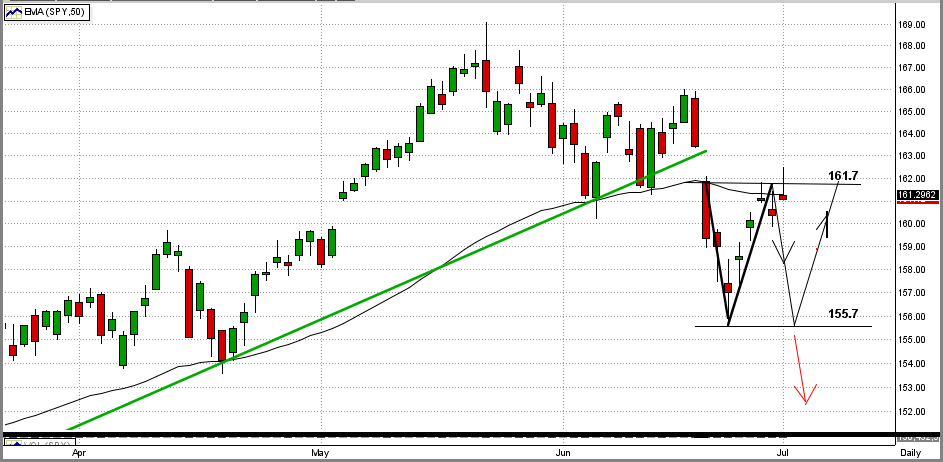
II.) Graph #2
If the SPY fails to break above its 50-day EMA and its 161.7 resistance, it will turn around and head back down. If this happens, there is a good chance that the market will trade in a sideways trading pattern as shown in black below. This is a dangerous pattern because of the high possibility of getting whipsawed.
III.) Graph #2
The other possibility if the market retracts from this 161.7 resistance level is that it will not go into a sideways trading pattern, but rather head down into a much larger correction (red arrow).
Like everyone else, we really have no bias one way or another on these possibliities. I keep saying "don't fight the Fed", but so much damage has already been done that anything is possible.
Like it or not, the fat cats will have to make a move sooner or later. MIPS will be closely watching their volume and will closely track (and duplicate) their movements. Right or wrong, the big guys move the market one way or another, and I want to be in their camp when they do.
And, we must rely on the math in MIPS' models to figure this out for us.


