Sometimes things just ain't what they seem. You can look at one single thing from two different viewpoints, and it can look like two very different things.
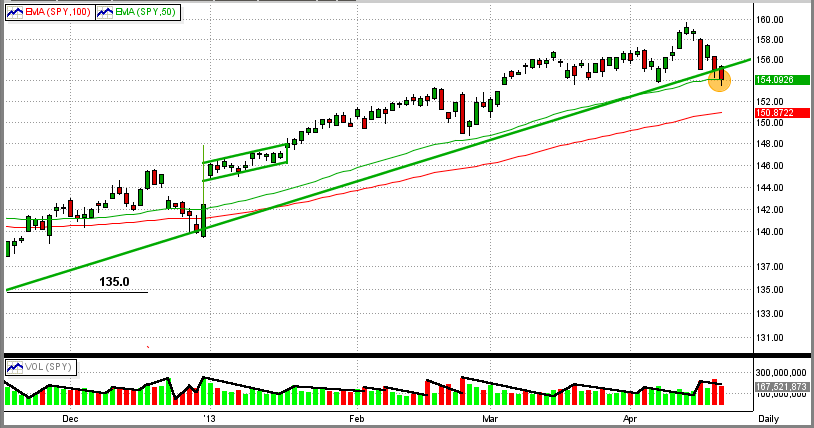
For example, take the recent stock market behavior (Graph #1). When we look at it from a short-term perspective (days/weeks), the recent market looks somewhat violent and erratic. Previously, the market was following a fairly smooth trendline, and recently it seems to be diving. The SPY broke this trendline to the downside today, but bounced back a little and settled right on top of its 50-day EMA. Everyone is jittery about which way the market will go from here. The answer, of course, is not in these numbers. All we are seeing is what engineers call "noise" and not yet a new trend. Trends take longer to develop, and that is what MIPS is all about.
Graph #1

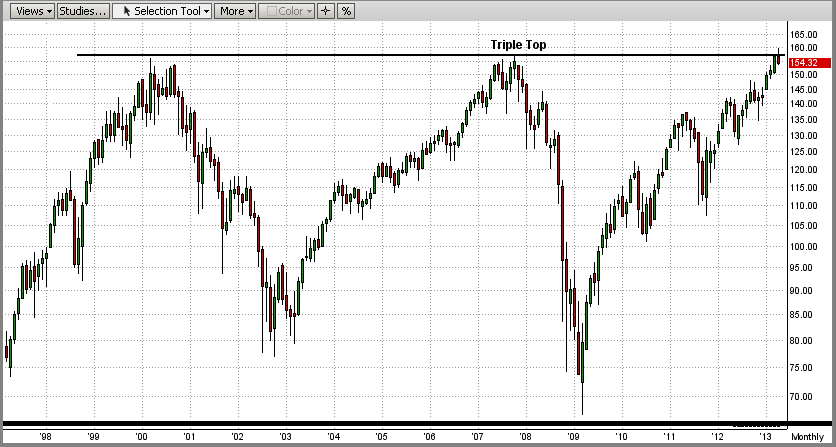
Graph #2
Now, if we look at the very same time frame (last few weeks) on a longer-term scale, it looks like almost nothing is happening recently (last little "bar" on the top right is the entire month of April 2013). But from here we can see that we are "sitting on the fence" of what will most likely be a new, dramatic move. We happen to be sitting on a time-bomb of a 13-year Triple-Top. The SPY hit and stopped going up at almost exactly $157.5/share for the third time in 13 years (2000, 2007, 2013). You can see from Graph #2 that the market does not dilly-dally for long periods at these "tops", mainly because everyone has their finger on the trigger. We all want to move very fast when a new trend (up or down) becomes apparent. So, let's be very attentive and watch for signals from MIPS.