We have received several emails from our subscribers asking how a model like MIPS3/MF, which trades an average of 15 times/year, can issue 2-3 trade signals in one week.,
The happens because:
1) the 15 trades/year for MIPS3/MF is an “average”, which means in some years it can trade
only 9 times (like in 2009) and in other years it may trade as many as 24 times (like in 2011), and
2) in any time frame, MIPS can trade 2-3 times in one month, and only one time in 3-5 months
(like at the end of 2010).
The main reason for this is the MIPS models have multiple “stop-gap” and “safe-guard” measures built in that “test” the integrity and accuracy of each and every signal. Specifically, for a few days after every trade, MIPS checks to see if the recent signal really is on the right track. These stop-gaps and safe-guards are NOT simply “stops” as we know them, but are proprietary algorithms that check to see if the SPY is following the expected price/volume pattern predicted by the algorithms in the recent signal.
Normally, the MIPS models issue new signals based on many indicators/algorithms that believe that they have found a directional change in the market, like an “Inflection Point” or a “Key Reversal”, etc. When MIPS issues a signal based on the consensus of these algorithms, it then spends the next few days verifying the “expected outcome”. If the “expected outcome” is not met, MIPS will either (a) reverse its position or (b) get out entirely (i.e., go to cash).
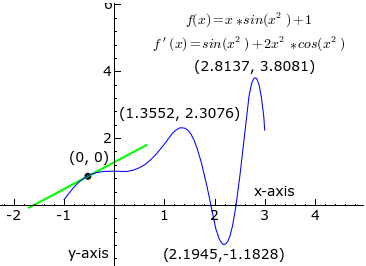
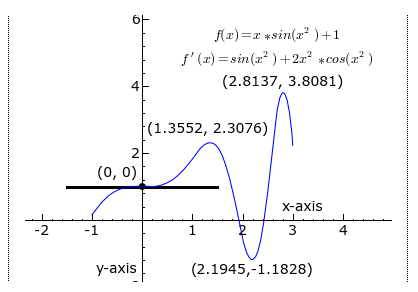
See the example below for Inflection Points
Click here for animated example =>
http://en.wikipedia.org/wiki/File:Graph_of_sliding_derivative_line.gif


In this graphic animated presentation from Wikipedia above, imagine that the curved blue line is the price of the SPY and the traveling lines are the “slope” of this price curve at any point on the curve. Therefore,
1) when the slope is pointed up, the SPY is in an upward pattern, and
2) when the slope is pointed down (red line), the SPY is in a downward pattern, and
3) when the slope is flat or zero (black line), the SPY is in a flat or sideways pattern, and
is signaling the potential of having reached an “Inflection Point”.

In the Wikipedia example above, at first the SPY is going up and the slope is pointing up (green up-line). When the slope turns flat/zero like it does near the Y-axis (black flat line), MIPS is looking for a change in direction in the SPY price from up to down (Inflection Point), and could signal a short signal. If the slope stays flat for a while or if the slope turns back up instead of turning down, MIPS could reverse its short signal and either (a) go long, or (b) go to cash. If MIPS does issue a cash signal and the slope then continues back up from there (as in the Wikipedia example as it crosses the Y-axis), MIPS will ultimately go long again. Over time, MIPS will go through tough periods trying to find a new trend and goes through 3-4 trades of –3% to +3%, but MIPS will ultimately find an intermediate trend (up or down) that will make us +10 to +15%, and the cycle repeats.
These “safety” algorithms above result in:
1) Negative - a few more trades than normal, and
2) Positive - greatly reduced losses on incorrect signals.
This can be seen in the MIPS long-term trading results below:
Winning/Losing Trades Average Gain/Loss
Winning Trades = 65% +3.0% Avg Gain/Trade
Losing Trades = 35% - 1.1% Avg Loss/Trade
After 100 trades, the win/loss ratio above equates to 195% up (65 x 3%) and 38.5% down (35 x 1.1), or 156% up (not compounded). Compounded, this would be in the range of 250% up (or more). And this happened in a market that was up only about 1% after 8 years and 100 MIPS trades.
We are not certain how many timing models have built in stop-gaps and safe-guards like MIPS, but we know a very large number of them that don’t.