There is a lot of talk (and a lots of good reasons) why we should strongly consider the possibility of, and even expect, the end of this market rally and/or the end of this 10 year bull market.
Current Rally
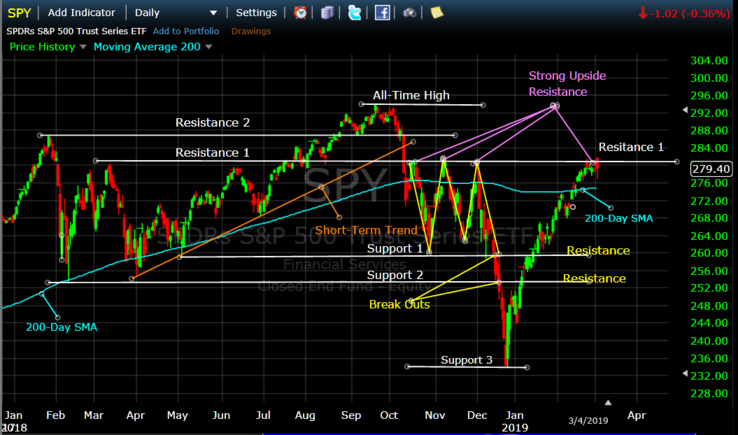
First, the current rally in the S&P 500 (SPY) has been "on" for two strong months (up over 20%) without looking back, and is now being challenged by strong resistance at $281/share. As you can see in the graph immediately below, the SPY has tried to break above $281 for the last 5 days in a row, and has failed to do so. And, exactly $281/share was the strong resistance price to the upside in the previous three rallies in 4Q'18. So, what's next?
Longer-Term
There are a multiplicity of reasons why the long-term bull market that we have been in since 2009 may be coming to an end. We have what feels like the strongest political unrest in decades, the Fed and interest rates, China tariffs, overbought markets, slower earnings growth, etc. We are all aware of these and there is no reason to repeat them herein.
There is one other thing brewing that all investors should be aware of that could lead to a correction soon or even be the catalyst for a serious bear market. This threat is "Margin Debt". Margin Debt, of course, is the money that large investors and institutions have borrowed (hence, debt) to buy or short more equity positions than they have "real" money to cover. For example, qualified investors can buy $2,000,000 in equities with the $1,000,000 in cash they actually have (2.0x leverage) by "borrowing" the sceond $1,000,000 (debt). This is great ride when the market is going up. But with 2.0x leverage, if the equity they own drops say 25%, they will have lost 50% of their initial investment.
The above is why Margin Debt is dangerous for investors who owe the debt AND for us that don't. It is dangerous for these investors because of their leverage and it is dangerous for us because when the market goes against the investors who owe the debt (mainly very large investment firms and hedge funds), they run for the hills and drive the market down much quicker than normal (and innocent buy and hold investors can get cremated along the way).
Warning
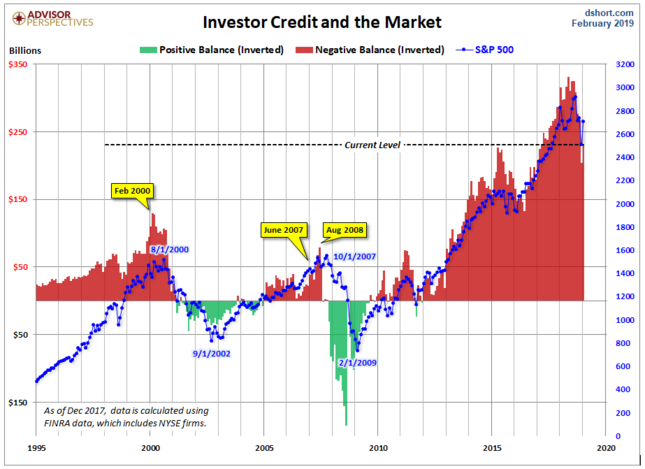
Margin Debt is at an all-time high from all views (like total debt, or debt as a % of ownership, etc). See the graph below. The current level of debt is staggering, especially when compared to 2000 and 2008.
Observation
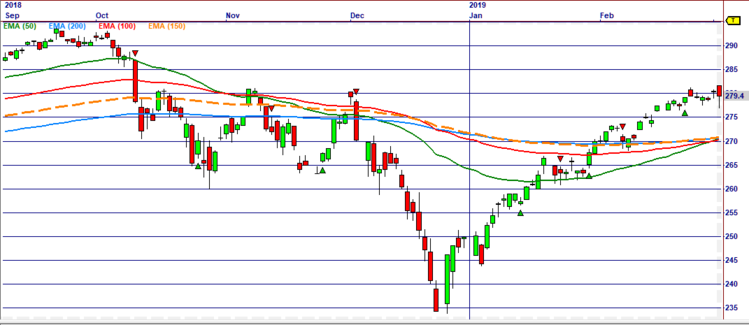
When stock markets roll-over from up-to-down, its moving averages roll-over from where the short term moving averages (50-day) are on the top and long-term averages (200-day) are on the bottom to where the short-terms are on the bottom and the long-erms are on the top. And, vice-versa for markets that move from down-to-up.
Note that in September 2018 the market was going up and the 50 was above the 100, and the 100 was above the 150, and the 150 was above the 200. Then, as the SPY tumbled in 4Q'18, by mid-December the moving averages had changed places with the 50 on the bottom and the 200 on the top. Since then, with the current rally, all moving averages have merged to the same price today, which kind of puts all market direction forecasts back to ground zero. So, where does the market go from here?
Wow, what can normal investors like us (the little guys) do in times like this. MIPS told us what to do in 2008 and we were up over 50% when the market was down more than 50%. So, we are going to wait for MIPS to tell us what to do in 2019.
Paul Distefano, PhD
CEO / Founder
MIPS Timing Systems, LLC
Houston, TX
281-251-MIPS(6477)


