Some time ago, I would have been surprised at the negative inputs that MIPS is getting from "some" (small number) of its members because of the high number of trades (9 trades) that the MIPS models have issued in the last 90 days. But, I am really NOT surprised because we had almost an identical response from other members in 2017 when the MIPS models did the opposite, and had No trades for the entire year (yes, zero).
In this blog, we will attempt to explain the high number of trades from MIPS in the last 90 days; and we will refer to our previous Blog from Nov 19, 2017 to explain the lack of MIPS trades in 2017. Over the last 13 years, the MIPS models have averaged about 12 trades/year, with 20+ in some years and 0-2 in others.
Popular quantitative models are based on concepts such as:
1) Trend Following - following short, intermediate, or long-term trend lines
2) Reversion to the Mean - Reverses when the markets get over-bought or over-sold
3) Momentum - puts more trust in markets that are moving in one direction, with higher or lower movements
4) Rate of Change - highly affected by markets when the slope of the movement is growing or decaying,
5) etc, etc, etc.
MIPS
MIPS is basically a trend-following model, but has algorithms built in to recognize over-bought and over-sold markets, markets that are gaining or losing momentum, and especially markets that are moving sideways (forming a recognizable "Consolidation Pattern").
MIPS behaves differently in slow and fast moving markets, up markets, down markets, and flat/sideways markets. In 2017, the market moved as a strong up-market for the entire year, so there was no need to "trade" just to trade, at the risk of being "fooled" by small dips. So, MIPS detected that, and did not trade at all that year.
On the other hand, since 3Q'18 we have been in a flat/sideways market. This is VERY dangerous market pattern, because there are basically NO identifiable trends (flat trend), and most other indicators are in chaos also. In fact, trying to identify market direction in this type of market is like trying to figure out who is winning a battle of thousands of warriors in hand-to-hand combat !!!
In this type of market, the MIPS models are programmed to go into a "preservation of capital" mode; which essentially means that, to be "safe", the models will go into (and stay in) Cash more often. So, instead of trades being long-to-short, most will be long-to-cash-to-short (and vice-versa for short-to-long trades). With this approach in 2018, the MIPS models ended up with small gains instead of big losses from getting whipsawed like many other quantitative models.
MIPS Gains in the last 3 years
The goal of all timing models should be to keep up with (or do a little better than) the market (S&P 500) in up markets, and to beat the market (or at least not lose money) in down markets. If you want to beat the market in strong up markets, you should do so by trading with 25% (1.25x) leverage or 50% (1.5x) leverage on Long Signals. On Short Signals, you should traded with 0.5x or 1.0x leverage.
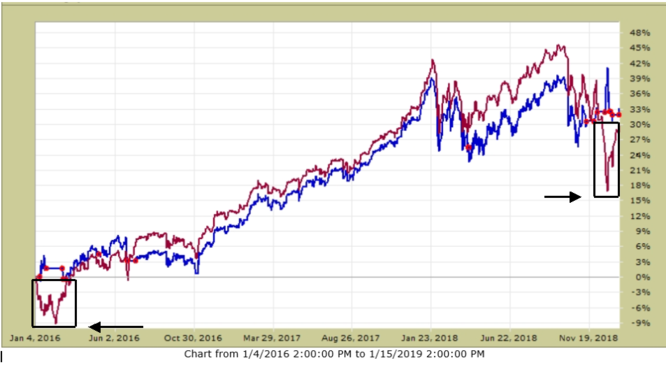
Overall, since the beginning of 2016 thru 01/15/2019, MIPS is up about 33%, while completely avoiding the big drops in the beginning of 2016 and in the last few weeks in 2019. Of course, this means if you were trading with $100,000 you would have ended up with about $33,000. Not bad since your trading advice from MIPS would have been only $39 or $59 per month for 3 years !!!
2016 - 01/15/19
MIPS - Blue Line
SPY - Red Line (big drop boxes are drops in the SPY)
Red dots show actual trades
2008 - Market Crash
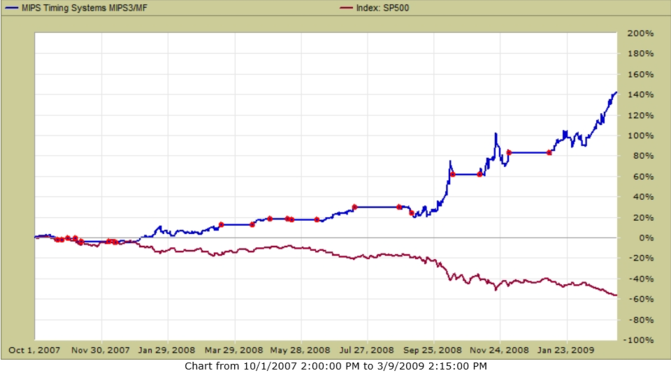
With good quantitative models, the "magic" comes in down markets. Notwithstanding the analysis above the graph above, the big payback comes in unanticipated years when the market crashes, as in 2008. The graph below shows what MIPS would have done for you in 2008, with no leverage.
In the 2008 crash (4Q'07-1Q'09), with MIPS Signals you would have been up +140%, while with buy-and-hold you would have been down -55% (yes, LOST 55%). Again, while investing with MIPS signals your $100,000 investment in Oct'07 would have been $140,000 at the end of 1Q'09 (+40%). On the other hand, with buy-and-hold your $100,000 investment in Oct'07 would be $55,000 at the end of 1Q'09 (-45%). That's a spread of $85,000. You do the math and see if that performance would be worth $39/month !!!
2008 Crash
MIPS - Blue Line
SPY - Red Line
Red dots show actual trades
BTW, trading just the SPY and SH (or any other two ETFs), it should take only 10 minutes to make a trade. So, 12 trades/year (24 round trip) would use up a max of only about 4 hours of your time per YEAR. If you cannot or will not spend that much time managing your life savings, you should either buy-and-hold or hire a money manager (most charge a fee of about 1.5% er year, and require a minumun investment of about $100,000).
Best Wishes !!!
Paul Distefano, PhD
CEO / Founder
MIPS Timing Systems, LLC
Houston
281-251-MIPS(6477)
www.mipstiming.com
===========================================================================
<<< Previous Blog >>>
Saturday, November 18 2017
Some investors (including some MIPS members) seem to think that when there is not a position change (Signal Change) in a MIPS model for a long period of time, they are being ignored or something is wrong with the model that they are following. They can't seem to understand that a good model (like MIPS) only changes position when the market changes its behavior, and that change is detected by the model. With MIPS, this would be when the intermediate-term market "trend" changes direction. We at MIPS input data and run our models daily (in triplicate), independent of whether or not there is a change of any type.
All daily model developers (including MIPS) provide their subscribers with "Investment Positions" (Long or Short or Cash) about 250 days every year (52 weeks/year x 5 trading days/week - holidays). This is not a function of how often their models trade.
There is, however, a big difference in how these "Investment Positions" are reported amongst model developers (aka Signal Providers):
1) Some Signal Providers send out emails to subscribers with current positions every trading day, whether or not the signal has changed. Many subscribers do not like this because they get inundated with emails from their Signal Provider and many times they miss a "signal change" due to confusion or boredom.
2) Other Signal Providers only send out emails to subscribers when there is a change in position from their model. Subscribers don't like this because there can be long periods of time (weeks/months) when they don't hear from their Signal Provider, and hence they are not 100% sure that they did not miss a signal change somewhere along the way or that the Signal Provider is now inactive.
3) At MIPS (as with most other good Signal Providers), we send out
(a) A "Signal Change" email the very day that one of our models calls for a change in position
(Long-to-Short or Short-to-Cash or etc.)
(b) A "Signal Status" email every weekend showing the current position for all MIPS models.
Our subscribers like this because the "Signal Status" tells them if they are in the correct
position at that time.
The moral of this story is that MIPS runs its models each and every day, no matter what the market is doing. This includes the status and behavior of hundreds of technical indicators and mathematical equations, and thousands of calculations. it is NOT any easier to run the model when the current signal remains the same or when there is a signal change.
We report the results to you every time there is a Signal Change, with instructions on our website for you NOT to change this new position until there is another Signal Change issued by the MIPS model that you are trading with. In the meantime, we keep you up-to-date on the Signal Status for each MIPS model every weekend, in case you accidentally did not act on the latest Signal Change during the week.
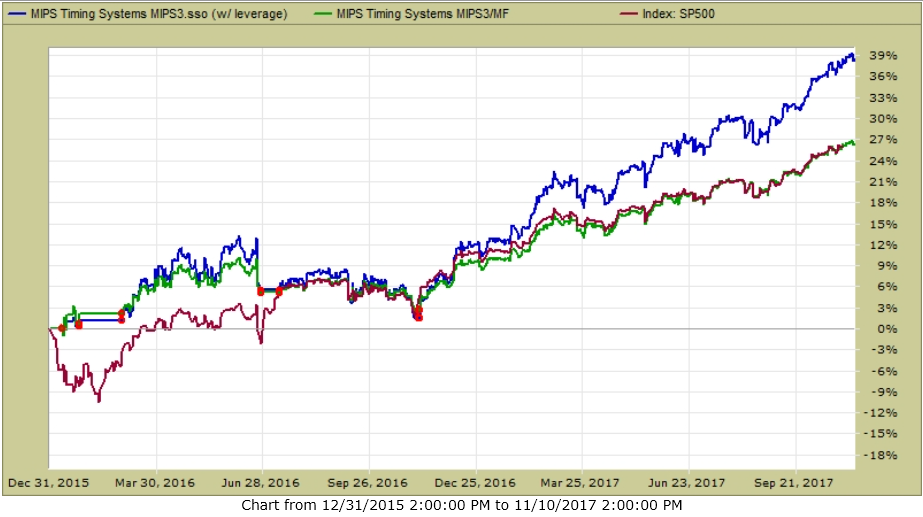
Here are the trades (red dots) and performance of the MIPS3 model since 2016
Blue Line - MIPS3 1.5x Long / 0.5x Short +39%
Green Line - MIPS3 1.0x Long / 1.0x Short +27%
Red Line - SPY........................................ +27%
Red dots show actual trades
Best Wishes...
Paul Distefano, PhD
MIPS Timing Systems, LLC
Houston, TX
281-251-MIPS(6477)


